
As a DevOps engineer with over a decade of experience in log management, I've seen countless teams outgrow Splunk and search for alternatives. If you're aiming to cut costs, scale more efficiently, or use cloud-native solutions, choosing the right Splunk alternative can significantly improve your observability strategy.
In this comprehensive guide, I'll walk you through the top Splunk alternatives for 2024, based on real-world implementations and performance benchmarks.
- Why Look for Splunk Alternative
- Comparison Table
- Decision Framework
- ELK (Elasticsearch, Logstash, Kibana)
- Graylog
- DataDog
- Grafana Loki
- SumoLogic
- Last9
- How to chose the right Splunk Alternative
- Frequently Asked Questions (FAQs)
Why Look for Splunk Alternatives?
In my experience, organizations typically consider Splunk alternatives for these reasons:
- Cost Optimization: Splunk's pricing model can become prohibitive quickly, especially for startups and small to medium-sized businesses. The cost per GB of ingested data can add up quickly, making it challenging to scale. I've seen companies reduce logging costs by up to 60% with alternatives.
- Cloud-Native Scalability: Many alternatives offer better performance in cloud environments with Kubernetes. In a recent project, we achieved 3x faster query times after migration.
- Resource-intensive: Splunk requires significant hardware resources to run effectively. This can lead to increased infrastructure costs, particularly for organizations dealing with large volumes of log data.
- Complexity: Setting up and maintaining Splunk can be challenging, often requiring dedicated expertise. This complexity can lead to increased operational overhead and longer time-to-value.
- Limited flexibility: Some teams find Splunk's licensing model and feature set restrictive for their specific needs. This can make it difficult to adapt the tool to unique use cases or evolving requirements, especially in dynamic environments like those using Docker and microservices.
Now, let's explore some compelling alternatives that address these pain points while still providing robust log management and observability capabilities.
Top Splunk Alternatives
Quick summary of each Splunk alternative - their key features, and cost considerations.
| Feature | Last9 | Splunk | ELK | Graylog | Datadog | Grafana Loki | Sumo Logic |
|---|---|---|---|---|---|---|---|
| Open-source | Proprietary solution | Fully open-source | Fully open-source | Proprietary solution | Fully open-source | Proprietary solution | Proprietary solution |
| Control Plane | Fully managed and controlled | No control plane | No control plane | Limited control plane | No control plane | Limited control plane | No control plane |
| Ease of Setup | Quick and simple | Complex setup, requires effort | Moderate complexity to set up | Easy to set up | Moderate setup complexity | Easy to set up | Moderate setup complexity |
| Scalability | Highly scalable for large environments | Scalable for large environments | Scalable but can be complex | Scalable for large environments | Scalable for large environments | Scalable for large environments | Scalable for large environments |
| Cost | Affordable for all | Affordable for small to medium | Cost-effective for small setups | Mid-range to high cost | Affordable for small to medium | Moderate to high cost | Moderate to high cost |
| Log Management | Excellent log management | Excellent log management | Excellent log management | Good log management | Good log management | Excellent log management | Excellent log management |
| Metrics | Excellent metrics monitoring | Good metrics monitoring | Limited metrics capabilities | Excellent metrics monitoring | Good metrics monitoring | Good metrics monitoring | Good metrics monitoring |
| Tracing | Excellent tracing capabilities | Limited tracing capabilities | No tracing support | Good tracing support | No tracing support | Limited tracing capabilities | Limited tracing capabilities |
| Visualization | Built-in Grafana integration | Built-in dashboard features | Moderate dashboard features | Excellent visualization tools | Good visualization (via Grafana) | Good visualization tools | Good visualization tools |
| Machine Learning | Limited machine learning features | Limited machine learning capabilities | Limited machine learning features | Advanced machine learning | Limited machine learning features | Advanced machine learning capabilities | Advanced machine learning capabilities |
| Docker Support | Excellent support for Docker | Excellent support for Docker | Good Docker support | Excellent Docker support | Excellent Docker support | Good Docker support | Good Docker support |
| Microservices Monitoring | Excellent microservices monitoring | Good microservices monitoring | Limited microservices monitoring | Excellent microservices monitoring | Good microservices monitoring | Good microservices monitoring | Good microservices monitoring |
1. ELK (Elasticsearch, Logstash, Kibana)
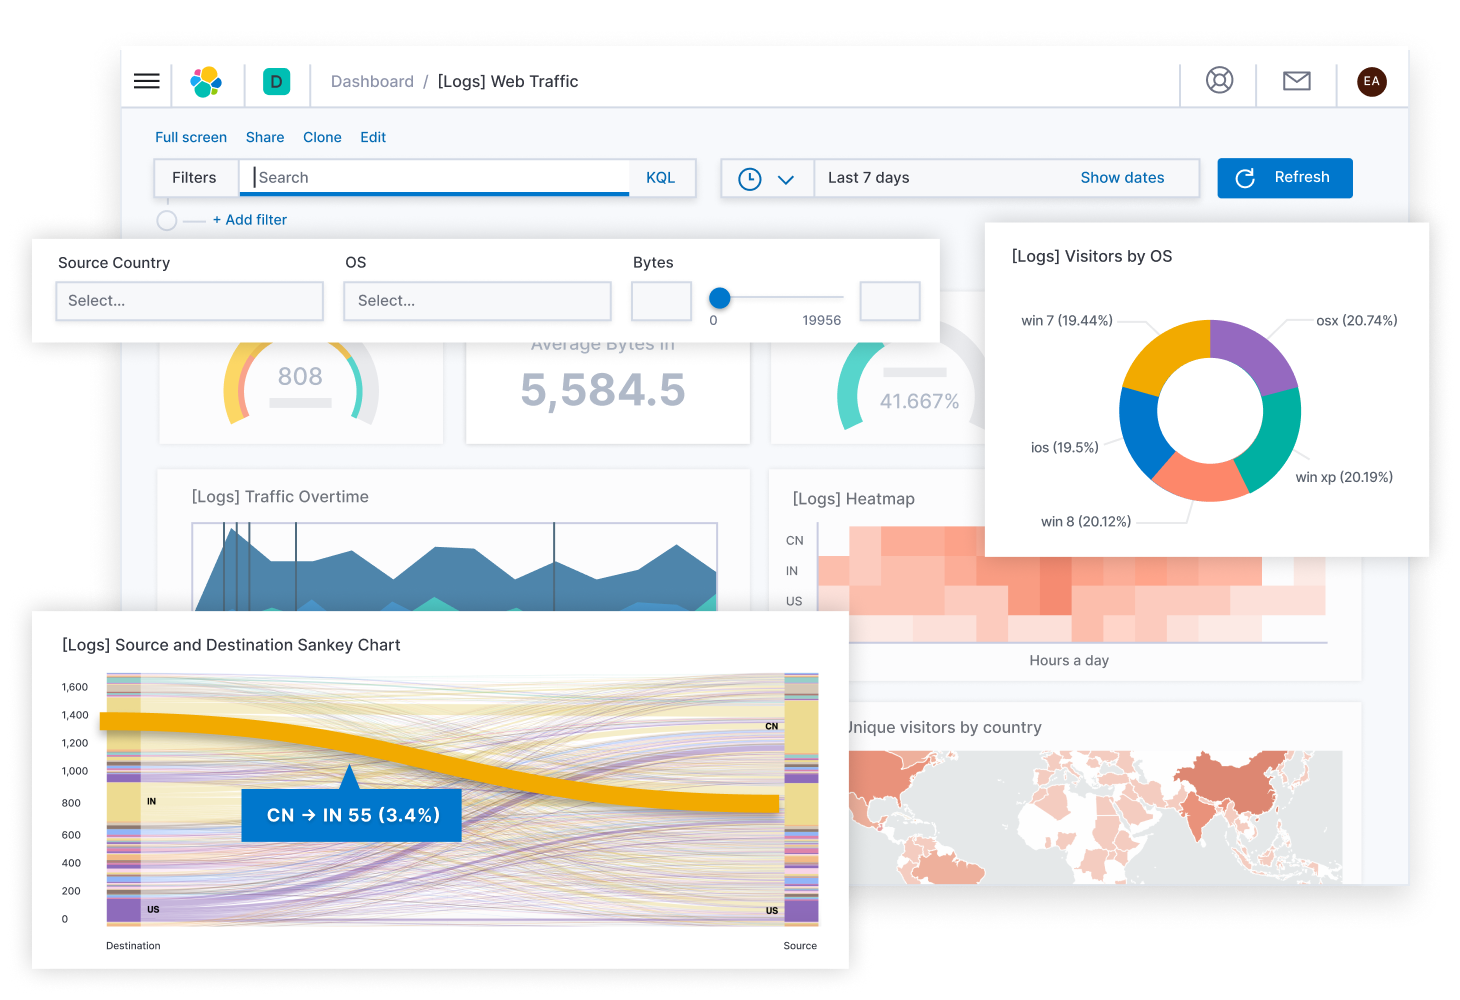
ELK is one of the most popular open-source alternatives to Splunk, especially after it reverted to an open-source license. It consists of three main components:
- Elasticsearch: A distributed search and analytics engine
- Logstash: A data processing pipeline for ingesting and transforming logs
- Kibana: A visualization layer for creating dashboards and exploring data
Pros:
- Open-source and free to use, allowing for significant cost savings
- Highly scalable and flexible, capable of handling large volumes of data
- Large community and extensive plugin ecosystem, providing numerous integrations and extensions
- Powerful full-text search capabilities and support for various log formats
- Real-time data processing and analysis, facilitating quick root cause analysis
Cons:
- Can be complex to set up and maintain, requiring expertise in multiple components
- Requires significant expertise for optimal performance tuning
- Resource-intensive at scale, potentially leading to high infrastructure costs
- Known issues with sharding and uptime in large-scale deployments
Best for:
Organizations with in-house expertise looking for a customizable, open-source solution. ELK is particularly well-suited for teams that need flexibility in their log management and analysis workflows, especially those dealing with diverse log formats and microservices architectures.
2. Graylog
Graylog is another open-source log management platform that offers a more focused alternative to Splunk. It's designed to be more user-friendly while still providing powerful log collection and analysis capabilities.
Pros:
- User-friendly interface, making it easier for teams to adopt and improving overall user experience
- Strong syslog handling capabilities, ideal for network device logs and infrastructure monitoring
- Built-in alert functionality for proactive monitoring and automation
- Scalable architecture suitable for both small and large deployments
- Supports custom plugins and integrations, enhancing its capabilities as a comprehensive monitoring solution
Cons:
- Limited visualization options compared to ELK or Splunk
- Smaller community and ecosystem, potentially leading to fewer resources and third-party integrations
- Less powerful query language compared to some alternatives
Best for:
Teams that prioritize ease of use and straightforward log monitoring, particularly those dealing with syslog data from network devices and looking for a cost-effective monitoring solution.
3. Datadog
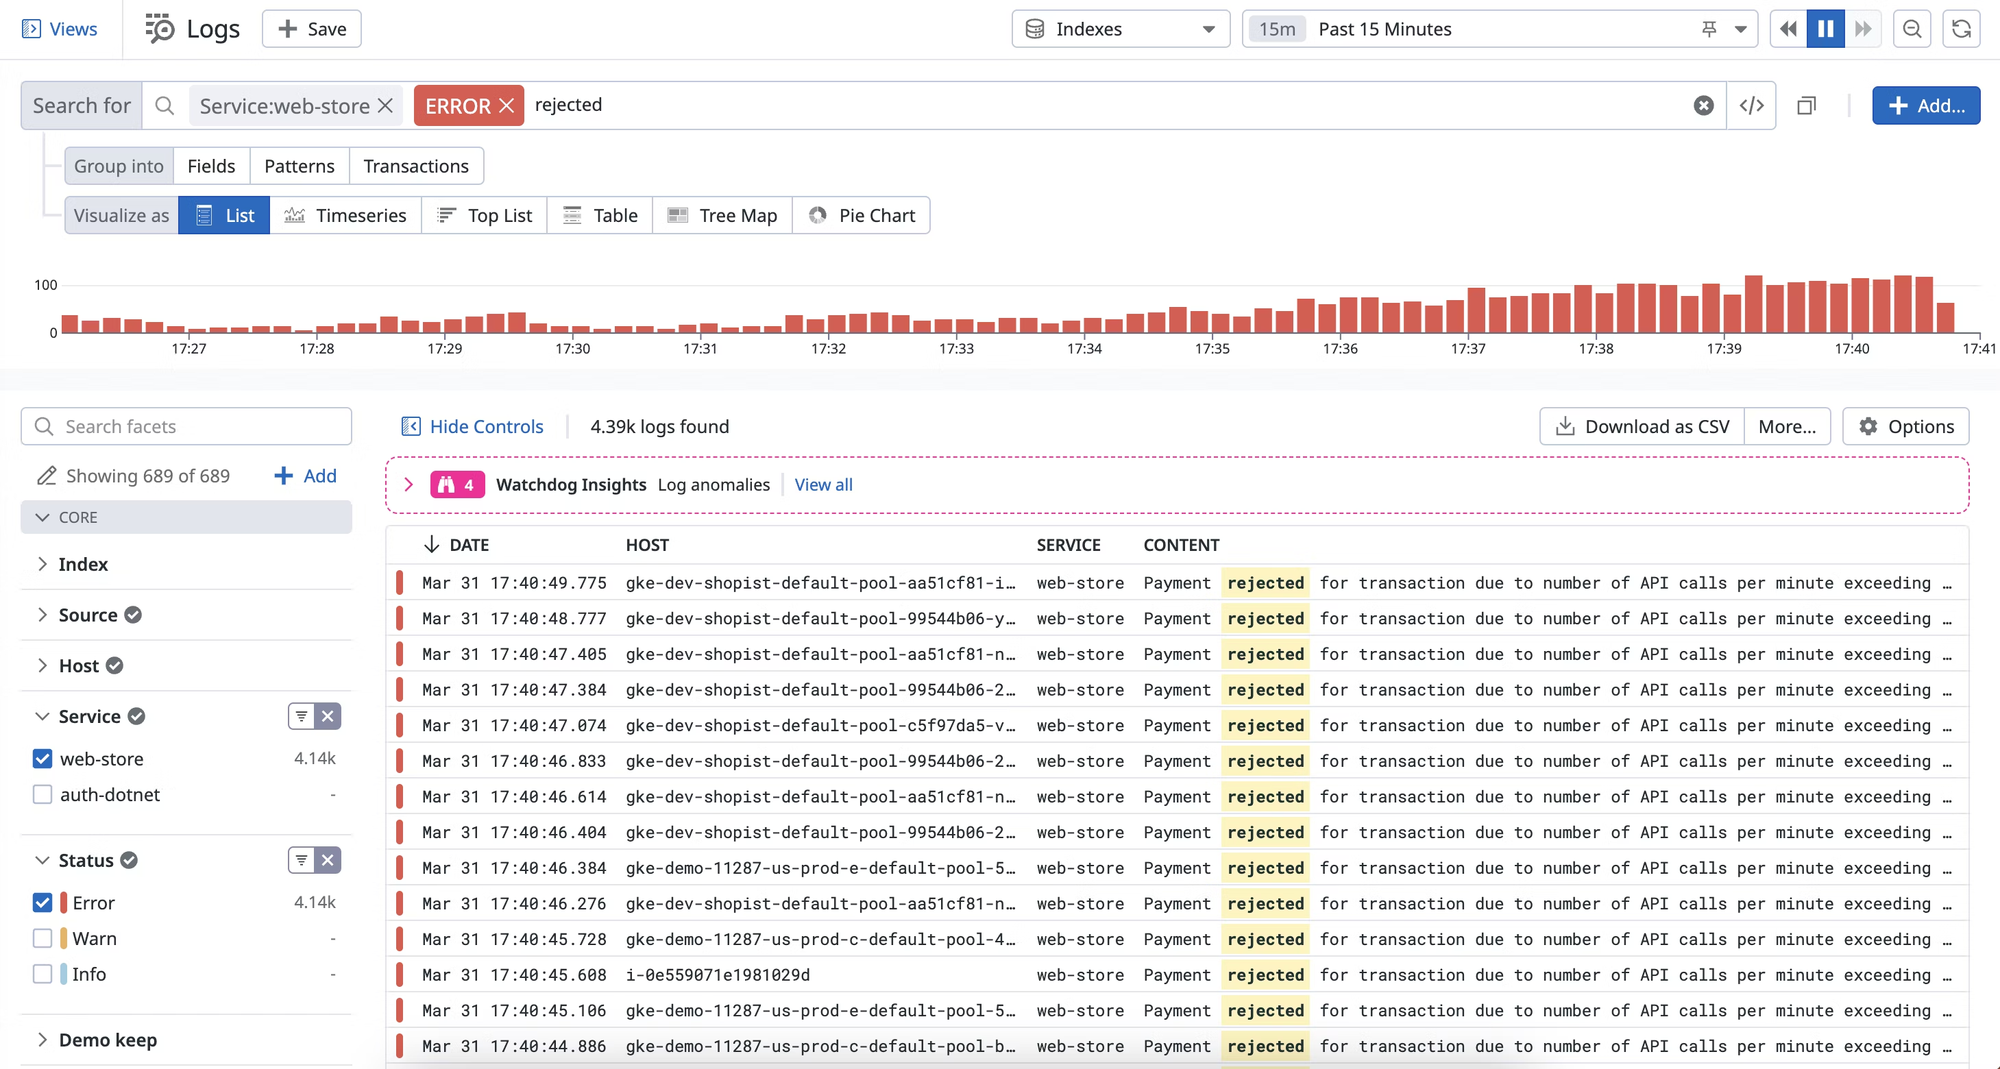
Datadogof is a popular cloud-based monitoring and analytics platform that offers a comprehensive suite of observability tools. It provides log management capabilities alongside metrics, traces, and synthetic monitoring.
Pros:
- Easy to set up and use, with a user-friendly interface that enhances the overall user experience
- Extensive integrations with various tools and services, making it easy to adopt in diverse environments including Docker and microservices
- Powerful analytics and visualization capabilities, including machine learning-driven insights for root cause analysis
- Unified platform for logs, metrics, and traces, providing a holistic view of infrastructure monitoring
- Strong support for cloud-native and containerized environments
Cons:
- Can become expensive at scale, particularly for high-volume log ingestion
- Potential for vendor lock-in due to the integrated nature of the platform
- Some advanced features may require significant configuration
Best for:
Organizations looking for a cloud-native, easy-to-use SaaS solution with minimal setup required. Particularly well-suited for teams already using cloud services and looking for a unified observability platform that can handle complex microservices architectures.
4. Grafana Loki
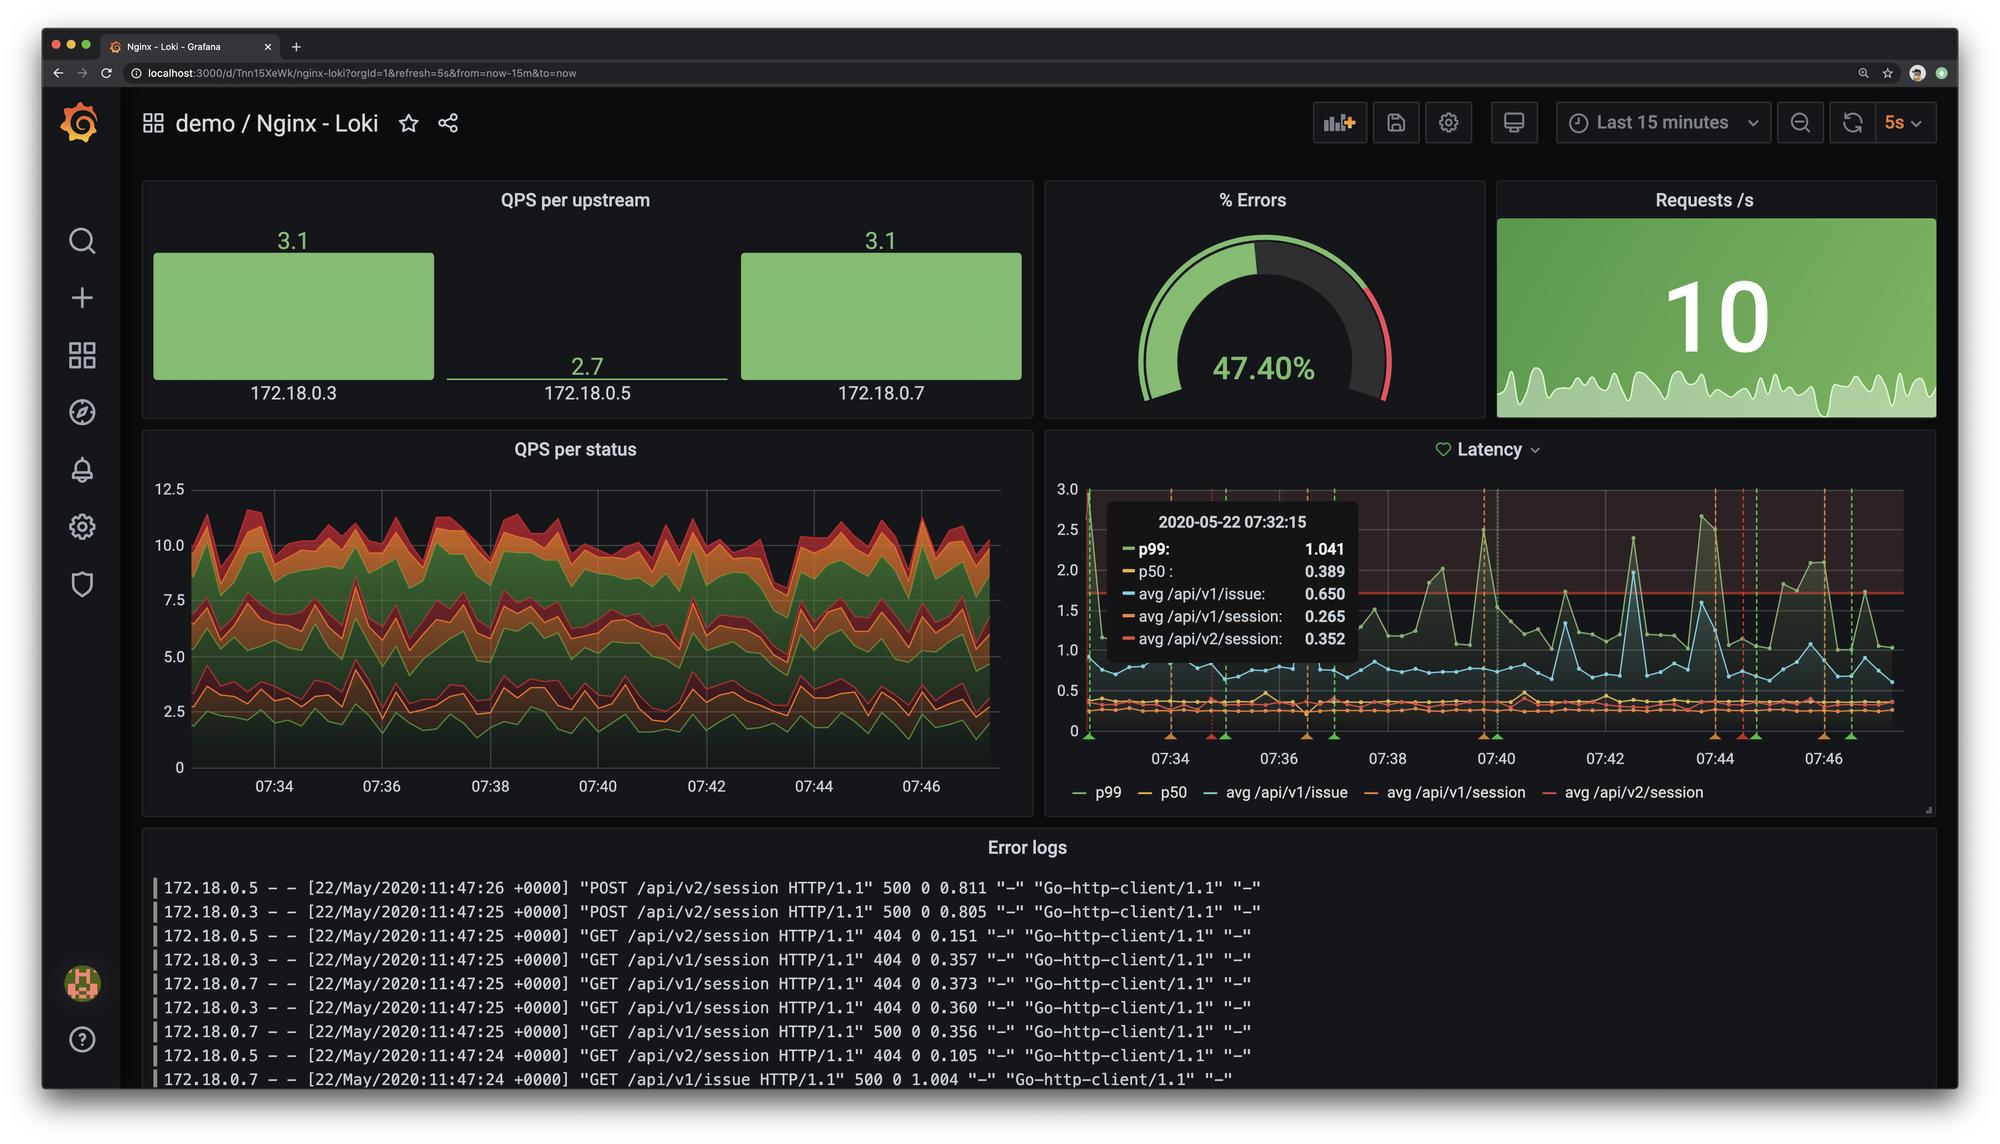
Grafana Loki is a horizontally scalable, highly available, multi-tenant log aggregation system inspired by Prometheus. It's designed to be cost-effective and easy to operate, making it an attractive option for teams already using Prometheus and Grafana.
Pros:
- Designed to be cost-effective and easy to operate, with lower resource requirements than some alternatives
- Integrates easily with Grafana for visualization, using existing dashboards and alerting
- Works well in Kubernetes and Docker environments, making it suitable for cloud-native architectures
- Uses label-based indexing, similar to Prometheus, for efficient log querying and parsing
Cons:
- Limited query language (LogQL) compared to some alternatives, which may not be suitable for complex log analysis needs
- Still maturing as a platform, with some features in active development
- May require additional tools for comprehensive log processing and transformation
Best for:
Teams already using Prometheus and Grafana for metrics who want to add log aggregation to their stack. Particularly well-suited for Kubernetes and Docker environments and organizations looking for a cost-effective logging solution that integrates well with their existing monitoring tools.
6. Sumo Logic
Sumo Logic is a cloud-native, machine data analytics platform designed for modern applications and cloud infrastructures. It offers log management alongside metrics, traces, and security analytics.
Pros:
- Strong security and compliance features, including data encryption and access controls
- Machine learning-powered analytics for anomaly detection and pattern recognition
- Good for both logs and metrics, providing a unified view of application and infrastructure performance
- Cloud-native architecture designed for scalability and reliability, suitable for microservices environments
- Extensive library of pre-built dashboards and integrations, enhancing the overall user experience
Cons:
- Can be expensive for high data volumes, with costs potentially escalating quickly depending on the pricing model
- Some users report a steep learning curve, particularly for advanced features
- Less flexibility compared to open-source solutions for customization and on-premises deployments
Best for:
Organizations prioritize security and compliance, especially in regulated industries. Well-suited for enterprises with cloud-native architectures looking for a fully managed SaaS observability solution that can handle complex parsing and analysis tasks.
7. Last9
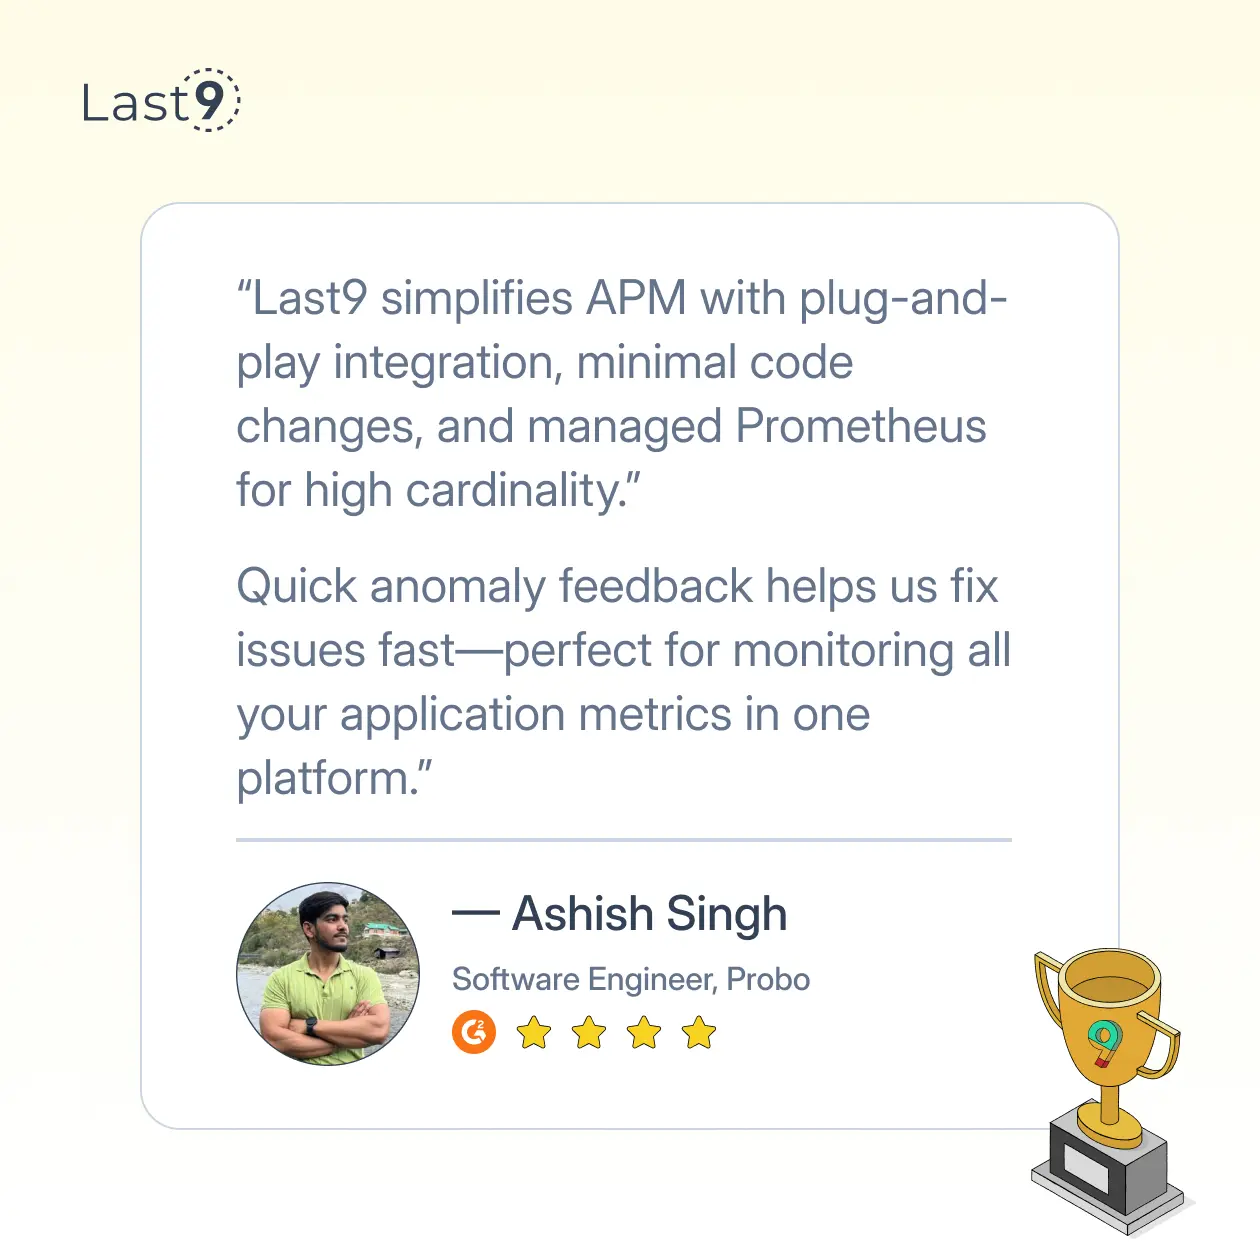
Last9 is a Telemetry Data Platform trusted by industry leaders like Probo, Games24x7, CleverTap, and Replit. We help optimize cloud-native monitoring by finding the sweet spot between performance, cost, and user experience.
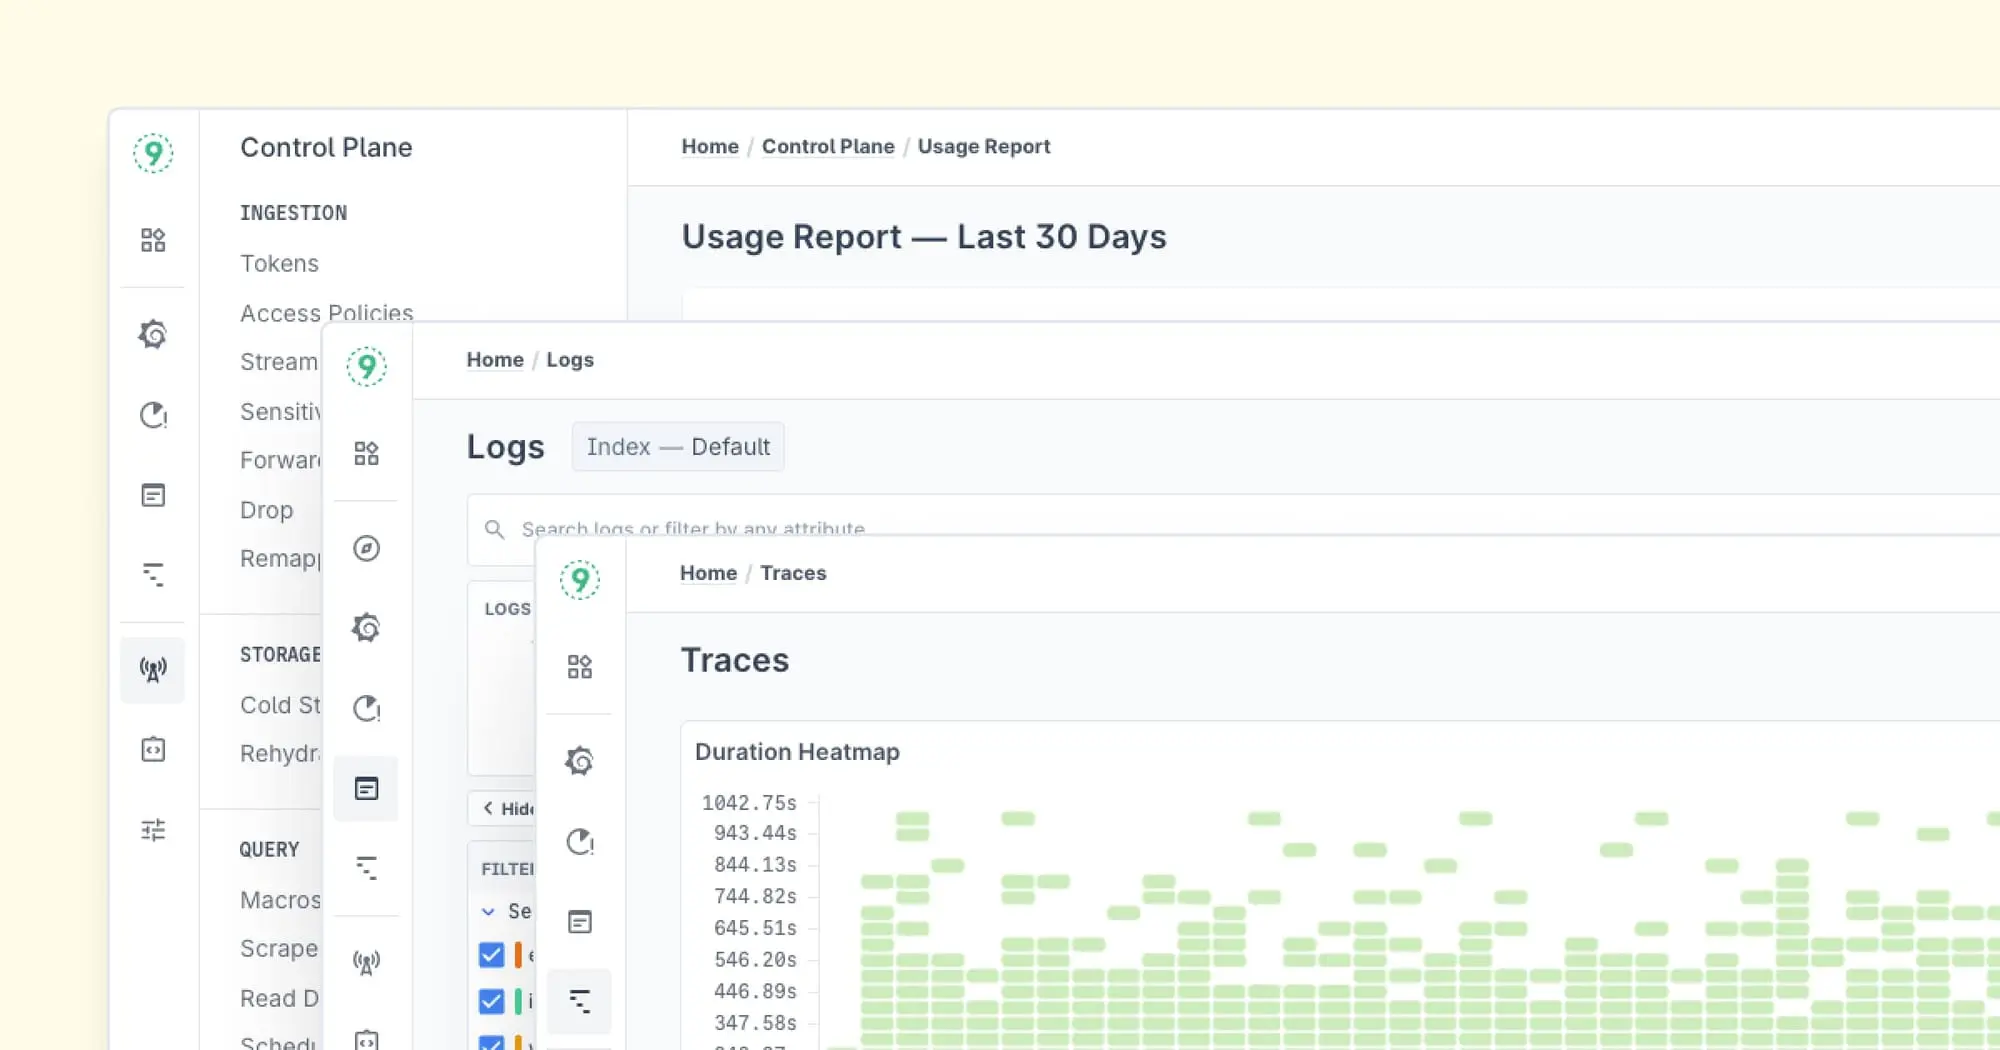
Our platform connects effortlessly with tools like OpenTelemetry and Prometheus, bringing together metrics, logs, and traces—making it easier to manage high-cardinality data.
With our Control Plane’s smart alerting and real-time metrics, engineering teams gain valuable insights, making observability and operational intelligence more accessible and actionable.
Pros:
- The only provider with a control plane to interoperate with the Open Telemetry Ecosystem
- Good for both logs, metrics, and traces, providing a unified view of application and infrastructure monitoring
- A recommendation engine to provide an extensive library of pre-built dashboards and integrations, enhancing the overall user experience
Cons:
- Does not yet offer on-premise solutions.
- Not suitable for organizations looking for open-source solutions.
Best for:
Organizations dealing with high-cardinality data, who want to do more while keeping costs in check. Ideal for those looking for a single tool to manage metrics, logs, and traces.
Perfect for cloud-native enterprises seeking a fully managed SaaS observability platform that can handle complex pipelines and diverse logging sources while preventing unexpected billing spikes.
How to Choose the Right Splunk Alternative
Picking the right Splunk alternative depends on your unique needs. Let’s walk through some key factors to consider.
1. Control Plane: Managing the Log Flood
When working with tons of logs, a control plane is essential. It helps you manage high-volume data ingestion without it spiraling out of control. If you're handling massive logs, make sure the solution you choose has a solid control plane—something like Last9 works great for this.
2. Data Volume: What’s Your Scale?
If you’re dealing with huge amounts of data, ELK is a solid option, especially if you want to manage it yourself. But keep in mind, it comes with added complexity. On the flip side, if you want something that scales without extra work, Sumo Logic or Last9 are managed solutions that handle the heavy lifting for you.
3. Budget: Cost vs. Complexity
Cost is always a factor. ELK and Graylog are open-source and budget-friendly, but they require a bit of management. If you’re not keen on handling the operational side, Datadog or Sumo Logic are managed solutions that come at a higher cost but save you time and resources.
4. Cloud Strategy & Ease of Use: Going Native
For cloud-native environments, you’ll want something optimized for scalability and ease of use. Grafana Loki and Last9 are great for this, providing a smooth experience for cloud setups and easier integrations.
5. Advanced Analytics: AI Insights?
If you're looking for AI-driven insights, focus on tools that are pushing the limits in machine learning and predictive analytics. Datadog and Sumo Logic are ahead of the curve, so it’s worth keeping an eye on what new features they’re rolling out.
6. Ease of Integration: Fitting into Your Stack
Finally, make sure the tool integrates easily with your current systems. Solutions like Grafana Loki and Last9 are designed to fit easily into modern tech stacks, especially for containerized and cloud-native environments.
Conclusion
While Splunk is a powerful tool for log management and observability, there are now many alternatives that offer similar functionality at a fraction of the cost.
Whether you choose an open-source option like ELK or Grafana Loki, or a cloud-based platform like Datadog or Sumo Logic, it's important to pick a tool that fits your team's needs, budget, and expertise.
Be sure to take advantage of free trials and proof-of-concept deployments to evaluate each option. This hands-on experience will help you assess factors like user experience, parsing capabilities, and support for diverse log formats.
Frequently Asked Questions (FAQs)
What are the alternatives to Splunk?
There are several alternatives to Splunk, including Last9, Graylog, Datadog, Grafana Loki, and Sumo Logic, which we've covered in detail in this article. Other options include Loggly, Dynatrace, New Relic, and Logz.io. Each of these tools offers unique features and capabilities that may suit different organizational needs and use cases.
What is the AWS tool similar to Splunk?
AWS offers Amazon CloudWatch and Amazon OpenSearch Service (formerly Amazon Elasticsearch Service) as tools similar to Splunk for monitoring and log analysis. These services provide capabilities for collecting, analyzing, and visualizing logs and metrics from AWS resources and applications.
How is Splunk better than other tools?
Splunk excels with its powerful data analysis capabilities, extensive features for log management, real-time monitoring, and a robust ecosystem for integration with various tools and platforms.
Its strengths include handling large volumes of diverse data types, providing advanced search and analytics features, and offering a wide range of pre-built apps and integrations. However, these advantages come with higher costs and resource requirements compared to other alternatives.
Can Grafana replace Splunk?
Grafana is primarily a visualization tool and does not have the same extensive log management and data indexing capabilities as Splunk. While it can't fully replace Splunk on its own, Grafana can complement tools like Elasticsearch or Prometheus for visualization purposes.
It also integrates with Last9. For a more complete Splunk alternative, Grafana is often used in combination with other tools, such as Grafana Loki or Last9 for log aggregation.
Who bought Splunk?
Splunk was acquired by Cisco in a $28 billion deal announced in September 2023. This acquisition aims to combine Splunk's data analytics capabilities with Cisco's networking and security expertise to enhance its observability and security offerings.
What is equivalent to Splunk in Azure?
In Azure, the equivalent to Splunk is Azure Monitor, which includes features for log analytics, application insights, and monitoring. Azure Monitor provides similar capabilities for log management, performance monitoring, and analytics within the Microsoft Azure ecosystem.
Is Splunk better than Elasticsearch?
Splunk and Elasticsearch serve different purposes and have their strengths. Splunk is a complete solution for log management, monitoring, and analysis, while Elasticsearch is a search and analytics engine often used as part of the ELK Stack (Elasticsearch, Logstash, Kibana).
The choice between them depends on specific use cases, requirements, and factors such as cost, scalability, and existing infrastructure. Elasticsearch, when used as part of the ELK stack, can provide similar functionality to Splunk at a potentially lower cost, but may require more setup and maintenance.
What is the Microsoft equivalent of Splunk?
The Microsoft equivalent of Splunk is Azure Monitor, which provides similar capabilities for log management, monitoring, and analytics within the Azure ecosystem.
It integrates with other Azure services and offers features like Log Analytics and Application Insights for comprehensive monitoring and troubleshooting of applications and infrastructure.
Is Splunk similar to Tableau?
While both Splunk and Tableau deal with data analysis and visualization, they serve different primary purposes. Splunk is focused on log management, IT operations monitoring, and security analytics, primarily dealing with machine-generated data.
Tableau, on the other hand, is a powerful data visualization and business intelligence tool designed for creating interactive dashboards and reports from various data sources, including databases and spreadsheets. While there is some overlap in their visualization capabilities, they are generally used for different use cases in an organization.
Are SIEM and Splunk the same?
SIEM (Security Information and Event Management) refers to a category of tools used for security monitoring and management, while Splunk is a specific platform that can serve as an SIEM tool among its other capabilities for log management and data analysis.
Splunk can be configured and used as an SIEM solution, but it also has broader applications in IT operations, application monitoring, and business analytics. Many organizations use Splunk as their SIEM solution, but there are other dedicated SIEM tools available in the market as well.