Since the start of COVID, 👟 Runkeeper reports a 62% spike globally in people heading out for a weekly run. This statistic is put in context; there is a +47.3% (globally) increase in people running compared to last year. And every one of those runners has one objective, to Run more and Run better.

⏱️ Which one of these stats do you associate with better?
- ✅ Yesterday, I ran 5 km in 25 minutes.
- ❌ Yesterday, I ran at 13 kmph.
❤️ Which one of these do you associate with better?
- ✅ During Yesterday's run, my average Heart rate was 140 bpm.
- ❌ During Yesterday's run, my heart pumped 3500 times.
Specific measurements, like the total distance over time, only make sense as a cumulative sum. Whereas some measures like heart rate only make sense as an aggregate over time.

Something about Targets and Objectives
🏃 Every runner sets themselves targets that would look like these:
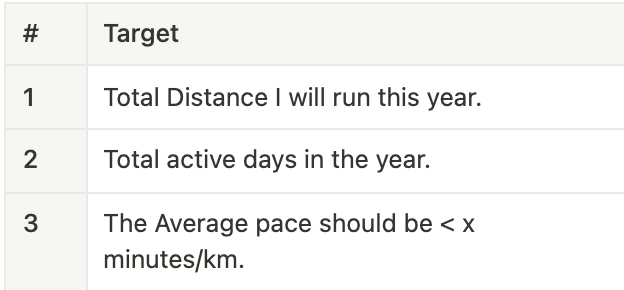
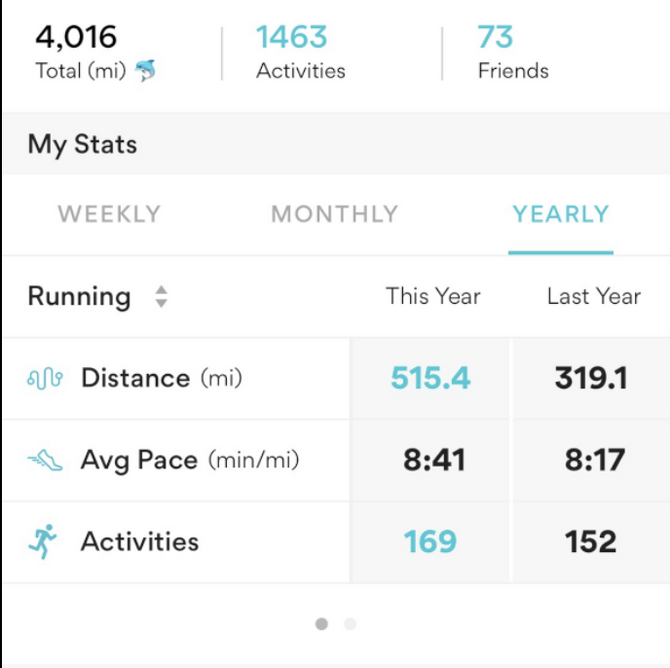
Targets and Objectives
👟 What do I need to achieve these goals?
- Consistent motivation
- Maximum performance. Performance is the relative measure, so we will have to define things we need to track to measure performance.

⏮️ When will you come to know that you have achieved your target?
- End of the year.
Objectives here are what we call the Lagging indicators
⏩ How do I ensure that I consistently progress toward achieving those goals?
- For this, now we need a continuous measure.
The continuous measure here is my average active days/week, OR moderate pace should be less than x min/km, which we call Leading indicators.
When we set annual running targets, we only talk about outcomes. So, for example, we do not speak about Heartbeat as a yearly target.
That is the difference between a Leading Indicator and a Lagging Indicator of performance.
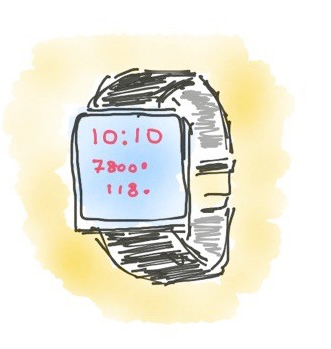
Remember, the best way to run a fast marathon is to run most of your laps at 4 mins/km.
Applying another variation, most people rely on average Heart Rate as a metric to measure the capacity to do more in the remainder of the run. If you keep a reasonable heart rate, the chances of hitting the goal amplify.
But, How do I define a reasonable Heart rate?
Option A: 120 bpm in the first minute and 119 bpm in the second
Option B: 209 bpm in the first minute and 20 bpm in the second ☹️
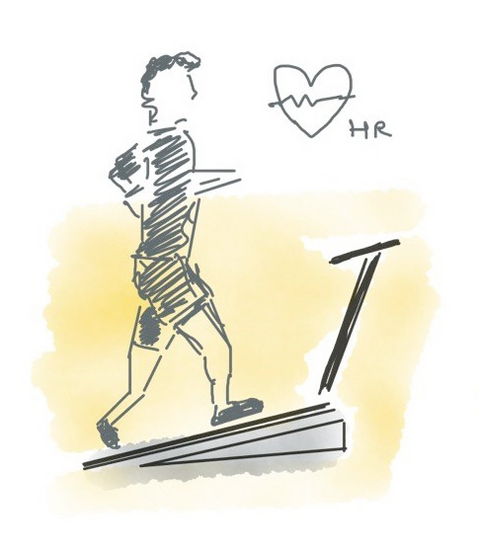
So what do we need to do?
- We need to improve the number of good minutes, in the case of heart rate. 95% of the time, my heart rate must be < 120bpm
- We need to improve the number of good km in interval time. For example, I must run 90% of my km < 4.5 minutes.
- We need to improve the number of active days; in the case of yearly goals, I must be active on 80% of the days.
🤷🏻♂️ How is all of this tied to SREs and SLOs?
The responsibility of choosing the right indicators and knowing what to aggregate is an integral part of an SRE's job. Unfortunately, they often overlook customer experience in favor of perceived "real" metrics like CPU, Memory, Disk, etc.
SREs are trained and coaxed to measure what is easy rather than right. But in modern cloud-native systems, where Infrastructure perishes and resurrects by the minute, monitoring components and servers feels like an outdated trick. In the contemporary age of Server-Less, Services are the only experience the customer cares about. And hence, Service Level Objectives.
🥇 However, relying on a Single percentage to identify the overall health of service may feel risky at first. Please refer to our detailed SLO workbook to learn how to adopt SLOs.
🎁 To summarize,
- To achieve predictable progress - have a clear objective to know what success looks like.
- But, objectives can only have success/failure as an outcome. So, to avoid disappointments, you need a Leading Indicator of continuous performance for faster course correction.
- Service Level Objectives are a practical framework for measuring and preventing undesired outcomes.

In another blog we are discussing Service Level Indicators and setting Service Level Objectives. Go check it out.


