

It’s 3 AM, and your phone buzzes—server down. You fumble for your laptop, trying to figure out what went wrong while half-asleep. A slow database query? A spike in traffic? An unhandled error?
Without proper monitoring, you’re left guessing. Server health monitoring is about spotting early warning signs before they turn into full-blown outages.
This guide walks through everything you need to know—from setting up the right tools to strategies that help you stay ahead of issues, so you’re not troubleshooting in the middle of the night.
What Is Server Health Monitoring?
Server health monitoring tracks your server's vital signs—CPU usage, memory consumption, disk space, and network traffic. Think of it as a fitness tracker for your infrastructure.
Your servers are constantly working, processing requests, running applications, and handling data. Without proper monitoring, you're flying blind. When (not if) something goes wrong, you'll be the last to know.
Server health monitoring typically works by:
- Collecting Metrics
Monitoring tools gather key performance data at regular intervals. Common metrics include CPU usage, memory consumption, disk I/O, network traffic, and request latency. These metrics help detect system stress before it leads to failures. - Storing Time-Series Data
Raw data is stored in a time-series database, enabling trend analysis over different periods. This historical data is crucial for identifying performance patterns, predicting resource needs, and spotting recurring issues. - Establishing Baselines
Monitoring systems analyze collected data to establish normal operating ranges for key metrics. By comparing real-time values against these baselines, deviations—such as unexpected CPU spikes or increasing error rates—become easier to detect. - Triggering Alerts
Automated alerts notify teams when predefined thresholds are exceeded. Alerts can be configured for different severities, ensuring that minor issues are logged while critical failures get immediate attention. Proper alert tuning prevents unnecessary noise while ensuring important signals aren't missed. - Visualizing Trends
Dashboards present real-time and historical data in an intuitive format, making it easier to track server health at a glance. Engineers can quickly see performance trends, correlate metrics, and identify the root cause of issues without manually digging through logs.
Effective monitoring gives you both real-time awareness and historical context—essential for both troubleshooting and capacity planning.
Why Developers Should Care About Server Health
As a developer/SRE, you might think server monitoring belongs to the ops team. Here's why that's wrong:
- Your code runs on these servers – Performance issues often trace back to application inefficiencies
- Faster debugging – Monitoring data helps pinpoint exactly where things went sideways
- Better user experience – Stable servers mean happy users
- Sleep through the night – Automated alerts catch issues before they become catastrophes
- Infrastructure as code – Modern deployment practices mean developers increasingly configure their monitoring
- Root cause analysis – Correlating application logs with server metrics can reveal subtle bugs
- Resource optimization – Understanding server behavior helps you right-size your infrastructure
A developer who understands server health creates better, more efficient code. It's that simple.
Getting Started with Server Health Monitoring
The Core Metrics You Need to Track
| Metric | What It Tells You | Warning Signs | Typical Collection Method |
|---|---|---|---|
| CPU Usage | Processing power consumption | Sustained usage above 80% | Agent-based sampling |
| CPU Load Average | Processing queue depth | Values exceeding core count | System statistics |
| Memory Usage | RAM allocation and consumption | Steady increases without drops | Memory statistics |
| Swap Usage | Virtual memory utilization | Any significant swap activity | Memory statistics |
| Disk Space | Storage availability | Usage above 85% capacity | Filesystem checks |
| Disk I/O | Read/write operations and latency | Queue depths > 1, latency spikes | I/O statistics |
| Network I/O | Data transfer volumes | Unusual spikes or drops | Interface statistics |
| Network Connections | TCP/UDP socket count | Abnormal connection counts | Connection tracking |
| Process Count | Total running processes | Unexpected increases | Process table |
| Response Time | Server performance | Increases above baseline | Application metrics |
Start by tracking these fundamentals. They'll give you the clearest picture of your server's health. Each of these metrics provides a window into a different aspect of your server's operation.
For instance, high CPU usage combined with high load average suggests your server is struggling to keep up with processing demands. Similarly, increasing memory usage without corresponding drops might indicate a memory leak in your application.
How to Choose Your Monitoring Tools
Selecting the right monitoring tool depends on your infrastructure, team expertise, and budget. If you need a fully managed solution or prefer open-source flexibility, there’s an option for you.
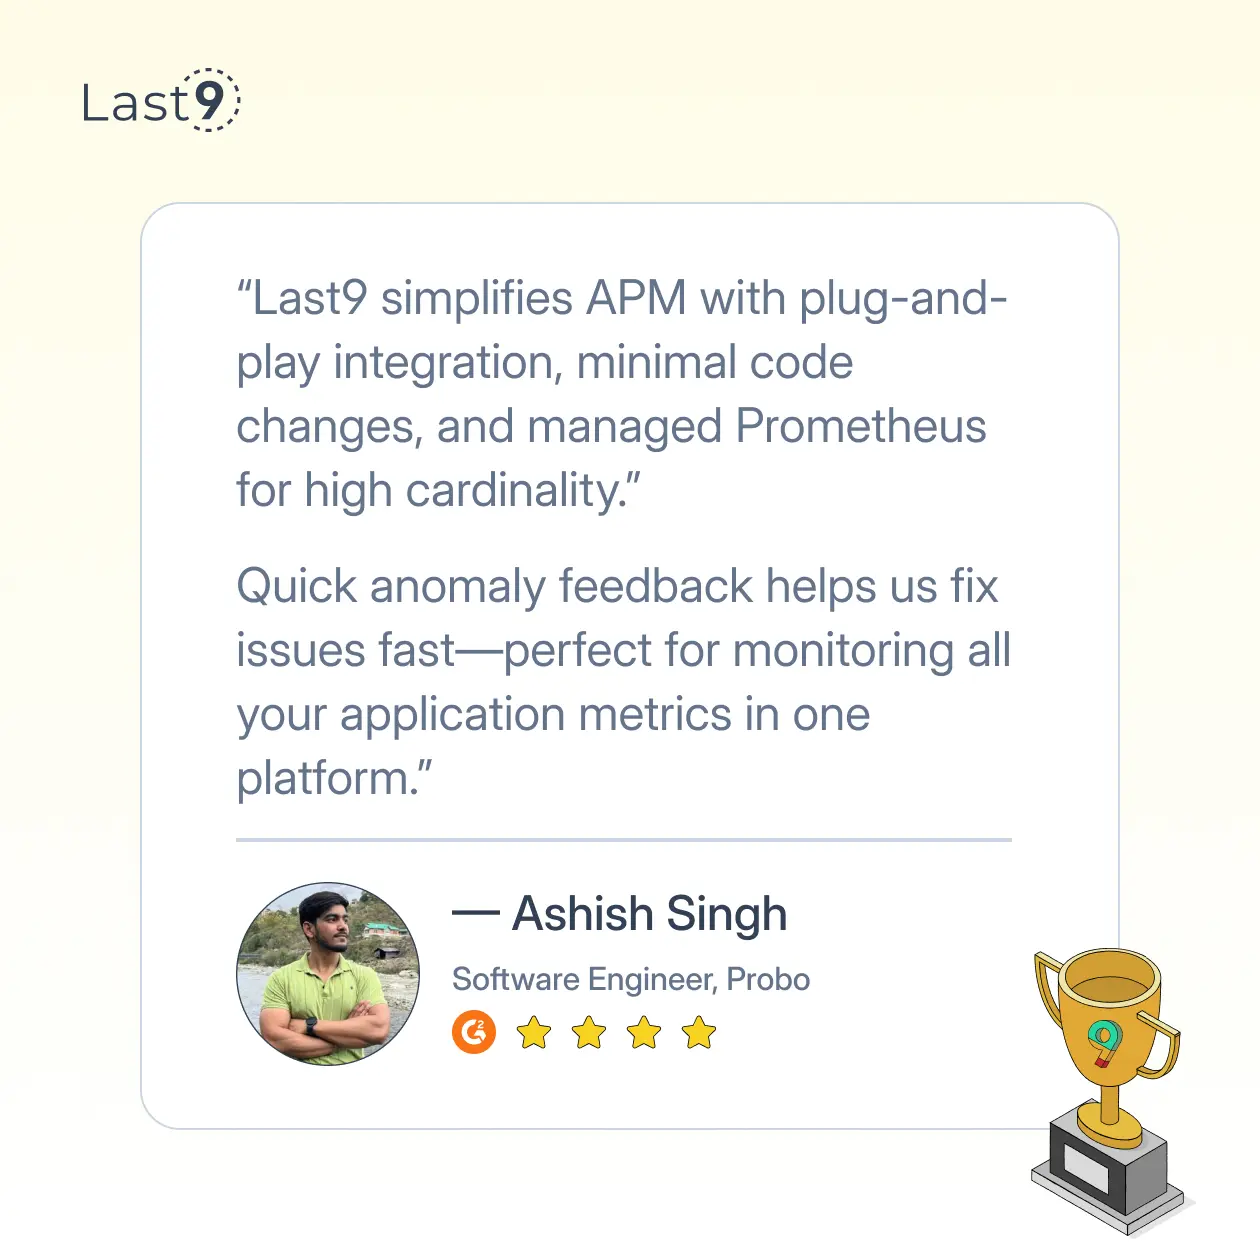
Last9: Observability Without the Overhead
If you’re looking for a cost-effective managed observability solution that scales without sacrificing performance, Last9 is worth considering.
- Trusted by industry leaders like CleverTap, and Replit, Last9 specializes in high-cardinality observability—handling vast amounts of telemetry data without breaking the bank.
- Proven at scale, it has monitored 11 of the 20 largest live-streaming events in history.
- Integrates with OpenTelemetry and Prometheus, allowing teams to correlate metrics, logs, and traces for real-time insights.
- Optimized for cost and performance, reducing noise and storage costs while maintaining high-fidelity observability.
If high-cardinality observability has been a challenge, Last9 offers a simpler, more efficient alternative.
Prometheus + Grafana
Ideal for teams comfortable with self-hosting and looking for flexibility.
- Strengths:
- Powerful query language (PromQL) for deep analysis
- Pull-based architecture ensures scalability
- Grafana integration provides customizable dashboards
- Strong community support
- Weaknesses:
- Requires manual setup and maintenance
- Steeper learning curve compared to managed solutions
Datadog
A fully hosted solution that simplifies monitoring across cloud-native environments.
- Strengths:
- Easy setup, works out of the box
- Extensive pre-built integrations with cloud services and third-party tools
- Unified monitoring with APM, infrastructure, and security analytics
- Weaknesses:
- Cost scales quickly, especially with high-cardinality data
- Some features locked behind higher pricing tiers
Nagios
A time-tested monitoring system with strong flexibility but a steep learning curve.
- Strengths:
- Highly customizable with support for plugins
- Well-established community with decades of use cases
- Reliable for traditional IT infrastructure monitoring
- Weaknesses:
- Dated UI and configuration complexity
- Not ideal for modern cloud-native environments
Zabbix
A feature-rich open-source platform for infrastructure and network monitoring.
- Strengths:
- Comprehensive monitoring for servers, VMs, and applications
- Scales well, supporting large infrastructures
- Built-in alerting and automation
- Weaknesses:
- Complex setup requiring database tuning
- Resource-intensive, especially at scale
What’s the Best Fit for You?
- If you need a fully managed observability solution with minimal setup → Try Last9
- For open-source flexibility and powerful querying → Use Prometheus + Grafana
- If ease of use and integrations matter most → Datadog is a strong choice
- For deep application performance monitoring → New Relic works well
- If you're managing legacy infrastructure → Nagios or Zabbix may suit your needs
Tool Selection Criteria
When choosing your monitoring stack, consider:
- Scale - How many servers will you monitor?
- Expertise - What's your team's technical comfort level?
- Integration - What other tools must it work with?
- Budget - Self-hosted or SaaS?
- Features - Basic metrics or advanced APM?
Remember that most teams end up with multiple monitoring tools that serve different purposes, so don't worry about finding one solution that does everything perfectly.
How to Set Up Your First Monitoring System
Step 1: Install Your Monitoring Agent
Most monitoring systems use agents—small programs that collect and report data from your server. For example, with Prometheus:
# Download Node Exporter for Linux servers
wget https://github.com/prometheus/node_exporter/releases/download/v1.3.1/node_exporter-1.3.1.linux-amd64.tar.gz

# Extract and install
tar xvfz node_exporter-1.3.1.linux-amd64.tar.gz
cd node_exporter-1.3.1.linux-amd64
./node_exporter
This code downloads the Node Exporter, which is a Prometheus exporter that collects and exposes system metrics.
The wget command fetches the compressed archive from GitHub. Then, we extract the archive using tar and navigate to the extracted directory.
Finally, we run the executable with ./node_exporter, which starts the agent listening on port 9100 by default.
For production environments, you'd want to set this up as a system service:
# Create a system user for node_exporter
sudo useradd --no-create-home --shell /bin/false node_exporter

# Copy the binary to a system directory
sudo cp node_exporter /usr/local/bin/
sudo chown node_exporter:node_exporter /usr/local/bin/node_exporter

# Create a systemd service file
sudo nano /etc/systemd/system/node_exporter.service
Now paste this service configuration:
[Unit]
Description=Node Exporter
Wants=network-online.target
After=network-online.target

[Service]
User=node_exporter
Group=node_exporter
Type=simple
ExecStart=/usr/local/bin/node_exporter

[Install]
WantedBy=multi-user.target
This service file tells systemd how to run Node Exporter. It specifies that the service should start after the network is online, run as the node_exporter user, and execute the binary we copied to /usr/local/bin. The [Install] section indicates that this service should be started when the system reaches multi-user mode.
Finally, enable and start the service:
sudo systemctl daemon-reload
sudo systemctl enable node_exporter
sudo systemctl start node_exporter
These commands reload systemd to recognize our new service, enable it to start on boot, and start it immediately.
Step 2: Configure Your Monitoring Server
Your central monitoring server needs to know where to collect data from:
# Example prometheus.yml configuration
global:
  scrape_interval: 15s
  evaluation_interval: 15s

scrape_configs:
  - job_name: 'node'
    static_configs:
      - targets: ['your-server-ip:9100']
This YAML configuration tells Prometheus to scrape metrics from your server every 15 seconds. The global section sets default values for how often to collect metrics (scrape_interval) and how often to evaluate rules (evaluation_interval).
The scrape_configs section defines what targets to monitor. Here, we've set up a job named 'node' that collects metrics from the Node Exporter running on your server at 'your-server-ip:9100'. In a real-world scenario, you would replace 'your-server-ip' with the actual IP address or hostname of your server.
For multiple servers, you would add more targets:
scrape_configs:
  - job_name: 'node'
    static_configs:
      - targets: ['server1:9100', 'server2:9100', 'server3:9100']
This configuration will monitor three servers simultaneously. As your infrastructure grows, you might want to use service discovery instead of static configuration:
scrape_configs:
  - job_name: 'node'
    consul_sd_configs:
      - server: 'localhost:8500'
        services: ['node-exporter']
This example uses Consul for service discovery, automatically finding and monitoring all servers registered with the 'node-exporter' service.
Step 3: Set Up Dashboards
Visualizing your data is crucial. In Grafana, you can import pre-built dashboards like the Node Exporter Full dashboard (ID: 1860) to instantly see your server metrics.
The process typically involves:
- Log into Grafana (default: http://localhost:3000)
- Add Prometheus as a data source:
- Go to Configuration > Data Sources > Add data source
- Select Prometheus
- Set the URL (typically http://localhost:9090)
- Click "Save & Test"
- Import a dashboard:
- Go to Create > Import
- Enter dashboard ID 1860 (Node Exporter Full)
- Select your Prometheus data source
- Click "Import"
You can also create custom dashboards. Here's a simple example of creating a panel using Grafana's PromQL query language:
100 - (avg by (instance) (irate(node_cpu_seconds_total{mode="idle"}[5m])) * 100)This query calculates the CPU usage percentage by measuring how much CPU time is NOT idle. It uses the irate function to calculate the per-second rate over the last 5 minutes, then multiplies by 100 to get a percentage.
Step 4: Configure Alerts
Alerts turn passive monitoring into active protection:
# Example Prometheus alert rule
groups:
- name: example
  rules:
  - alert: HighCPULoad
    expr: 100 - (avg by(instance) (rate(node_cpu_seconds_total{mode="idle"}[5m])) * 100) > 80
    for: 5m
    labels:
      severity: warning
    annotations:
      summary: High CPU load (instance {{ $labels.instance }})
      description: CPU load is > 80% for 5 minutes

  - alert: MemoryFillingUp
    expr: (node_memory_MemTotal_bytes - node_memory_MemAvailable_bytes) / node_memory_MemTotal_bytes * 100 > 90
    for: 5m
    labels:
      severity: warning
    annotations:
      summary: Memory filling up (instance {{ $labels.instance }})
      description: Memory usage is > 90% for 5 minutes
This YAML configuration defines two alert rules:
HighCPULoad: Triggers when CPU usage exceeds 80% for 5 minutes- The expression calculates the non-idle CPU percentage
- The
for: 5mensures the condition persists for 5 minutes before alerting - The
labelssection adds metadata used for routing the alert - The
annotationsprovide human-readable information about the alert
MemoryFillingUp: Triggers when memory usage exceeds 90% for 5 minutes- The expression calculates the percentage of used memory
- Similar to the CPU alert, it waits 5 minutes before firing
To receive these alerts, you'll need an alerting tool like Alertmanager:
# Example alertmanager.yml
global:
  smtp_smarthost: 'smtp.gmail.com:587'
  smtp_from: 'alertmanager@example.org'
  smtp_auth_username: 'gmail-username'
  smtp_auth_password: 'gmail-password'

route:
  group_by: ['alertname', 'instance']
  group_wait: 30s
  group_interval: 5m
  repeat_interval: 4h
  receiver: 'email-notifications'

receivers:
- name: 'email-notifications'
  email_configs:
  - to: 'team@example.org'
This configuration sets up email notifications for alerts. The global section configures the SMTP server for sending emails. The route section defines how alerts are grouped and when they're sent, while the receivers section specifies where to send the alerts.
For modern teams, you might prefer Slack notifications:
receivers:
- name: 'slack-notifications'
  slack_configs:
  - api_url: 'https://hooks.slack.com/services/T00000000/B00000000/XXXXXXXXXXXXXXXXXXXXXXXX'
    channel: '#monitoring-alerts'
    title: '{{ .GroupLabels.alertname }}'
    text: "{{ range .Alerts }}{{ .Annotations.description }}\n{{ end }}"
This configuration sends alerts to a Slack channel using a webhook URL. The title and text fields use Go templates to format the alert information.
Advanced Server Health Monitoring Strategies
Implement the USE Method
The USE method (Utilization, Saturation, Errors) gives you a framework for thorough monitoring:
- Utilization: Percentage of time the resource is busy
- Saturation: Amount of work queued
- Errors: Count of error events
Apply this to each resource (CPU, memory, disk, network) for complete coverage.
Here's how to implement USE monitoring for key resources:
CPU USE Metrics
# CPU Utilization (percentage of time CPU is busy)
expr: 100 - avg by(instance) (rate(node_cpu_seconds_total{mode="idle"}[5m]) * 100)

# CPU Saturation (load average compared to core count)
expr: node_load1 / count without(cpu, mode) (node_cpu_seconds_total{mode="idle"})

# CPU Errors (context switches and interrupts)
expr: rate(node_context_switches_total[5m])
expr: rate(node_intr_total[5m])
These expressions monitor:
- CPU utilization as the percentage of time the CPU is not idle
- CPU saturation by comparing the 1-minute load average to the number of CPU cores
- CPU errors by tracking the rate of context switches and interrupts
Memory USE Metrics
# Memory Utilization
expr: (node_memory_MemTotal_bytes - node_memory_MemAvailable_bytes) / node_memory_MemTotal_bytes * 100

# Memory Saturation (page swap activity)
expr: rate(node_vmstat_pgpgin[5m])
expr: rate(node_vmstat_pgpgout[5m])

# Memory Errors (allocation failures)
expr: rate(node_vmstat_pgmajfault[5m])
These expressions track:
- Memory utilization as the percentage of total memory in use
- Memory saturation by monitoring page-in and page-out rates
- Memory errors by counting major page faults
Application-Level Monitoring
Server metrics tell only half the story. Integrate application metrics like:
- Request rates and latencies
- Database query performance
- Cache hit/miss ratios
- Error rates by endpoint
These metrics bridge the gap between server performance and user experience.
For a Node.js application, you might use the Prometheus client library:
const express = require('express');
const promClient = require('prom-client');

// Create a Registry to register the metrics
const register = new promClient.Registry();
promClient.collectDefaultMetrics({ register });

// Create custom metrics
const httpRequestDurationMicroseconds = new promClient.Histogram({
  name: 'http_request_duration_seconds',
  help: 'Duration of HTTP requests in seconds',
  labelNames: ['method', 'route', 'status_code'],
  buckets: [0.1, 0.3, 0.5, 0.7, 1, 3, 5, 7, 10]
});
register.registerMetric(httpRequestDurationMicroseconds);

// Create counters for specific business metrics
const userSignups = new promClient.Counter({
  name: 'user_signups_total',
  help: 'Total number of user signups'
});
register.registerMetric(userSignups);

const app = express();

// Middleware to measure request duration
app.use((req, res, next) => {
  const end = httpRequestDurationMicroseconds.startTimer();
  res.on('finish', () => {
    end({ method: req.method, route: req.route?.path || req.path, status_code: res.statusCode });
  });
  next();
});

// Example route that increments business metric
app.post('/signup', (req, res) => {
  // Process signup...
  userSignups.inc();
  res.send('Welcome!');
});

// Expose metrics endpoint for Prometheus to scrape
app.get('/metrics', async (req, res) => {
  res.set('Content-Type', register.contentType);
  res.end(await register.metrics());
});

app.listen(3000, () => {
  console.log('Server running on port 3000');
});
This Node.js code sets up application-level monitoring using Prometheus. Here's what it does:
- Imports Express for the web server and the Prometheus client library
- Sets up a Registry to hold all metrics and enables default Node.js metrics
- Creates a custom Histogram metric to track HTTP request durations with labels for method, route, and status code
- Creates a Counter metric to track business events (user signups)
- Adds middleware to measure the duration of each request
- Creates a route that increments the signup counter when users register
- Exposes a
/metricsendpoint that Prometheus can scrape
With this code, you can track both technical metrics (response times) and business metrics (signup rates) from your application.
Log Aggregation and Analysis
Logs contain gold mines of information. Centralize them with tools like:
- ELK Stack (Elasticsearch, Logstash, Kibana)
- Last9
- Loki (pairs well with Grafana)
Then set up parsing to extract and alert on key patterns that indicate problems.
Here's a basic Filebeat configuration to ship logs to Elasticsearch:
# filebeat.yml
filebeat.inputs:
- type: log
  enabled: true
  paths:
    - /var/log/nginx/access.log
  fields:
    log_type: nginx_access
  fields_under_root: true
  json.keys_under_root: true
  json.add_error_key: true

- type: log
  enabled: true
  paths:
    - /var/log/nginx/error.log
  fields:
    log_type: nginx_error
  fields_under_root: true

output.elasticsearch:
  hosts: ["elasticsearch:9200"]
  indices:
    - index: "nginx-access-%{+yyyy.MM.dd}"
      when.equals:
        log_type: nginx_access
    - index: "nginx-error-%{+yyyy.MM.dd}"
      when.equals:
        log_type: nginx_error
This configuration:
- Defines two log inputs - Nginx access logs and error logs
- Tags each log with a
log_typefield for easier filtering - For access logs, assumes they're in JSON format and extracts the fields
- Sends the logs to Elasticsearch, using different indices based on the log type and date
For structured logging in your application, consider a library like Winston (Node.js):
const winston = require('winston');

// Define the format for logs
const logFormat = winston.format.combine(
  winston.format.timestamp(),
  winston.format.json()
);

// Create a logger
const logger = winston.createLogger({
  level: 'info',
  format: logFormat,
  defaultMeta: { service: 'user-service' },
  transports: [
    new winston.transports.File({ filename: 'error.log', level: 'error' }),
    new winston.transports.File({ filename: 'combined.log' })
  ]
});

// Add console output during development
if (process.env.NODE_ENV !== 'production') {
  logger.add(new winston.transports.Console({
    format: winston.format.simple()
  }));
}

// Usage examples
function doSomething() {
  logger.info('Processing user request', { userId: '123', action: 'login' });

  try {
    // Business logic...
    throw new Error('Something went wrong');
  } catch (error) {
    logger.error('Failed to process request', {
      userId: '123',
      errorMessage: error.message,
      errorStack: error.stack
    });
  }
}
This code sets up structured logging with Winston. Key elements:
- Uses a combination of timestamp and JSON formatting for logs
- Creates a logger with different transports for error logs and combined logs
- Adds console output during development
- Demonstrates how to log with context (userId, action) for both info and error logs
Structured logs make it much easier to search and analyze events later, especially when aggregated in a centralized logging system.
Troubleshooting Common Server Issues
High CPU Usage
When your CPU usage consistently runs hot:
- Check for inefficient application code loops or memory leaks
- Look for runaway processes or cron jobs
- Consider scaling horizontally if the load is legitimate
Use profiling tools specific to your language:
# For Node.js
node --prof app.js
The --prof flag enables the V8 profiler, which generates a log file. You can then use the --prof-process flag to convert this log into a readable format:
node --prof-process isolate-0x*-v8.log > processed.txtUse pidstat to track specific processes over time:
# Monitor process 1234 every 2 seconds
pidstat -p 1234 2
This command displays CPU, memory, and I/O statistics for the specified process every 2 seconds. It's useful for watching how a process behaves over time.
Use top or htop to identify resource-hungry processes:
# Sort processes by CPU usage
top -o %CPU
Memory Leaks
Gradual memory increases without corresponding drops often indicate leaks:
Set up swap monitoring to prevent crashes:
# Check swap usage
free -h

# Monitor swap activity
vmstat 1
The free -h command shows memory and swap usage in a human-readable format. The vmstat 1 command shows memory statistics updated every second, including swap-in (si) and swap-out (so) activity.
Implement proper cleanup in your application code:
// Bad - creates a memory leak
function badCode() {
  let data = [];
  setInterval(() => {
    data.push(generateLargeObject());
  }, 1000);
}

// Good - limits memory usage
function goodCode() {
  let data = [];
  setInterval(() => {
    data.push(generateLargeObject());
    if (data.length > 100) data.shift(); // Remove oldest entry
  }, 1000);
}
The badCode function continuously adds objects to an array without ever removing them, causing a memory leak. The goodCode function maintains a fixed-size array by removing the oldest entry when the array exceeds 100 items.
For system-wide memory analysis, use smem:
# Show processes sorted by memory usage
smem -k
The -k flag sorts processes by the "proportional set size" (PSS), which is a more accurate representation of a process's memory footprint in a modern system.
Use tools like heapdump for Node.js applications:
const heapdump = require('heapdump');

// Generate heap snapshot on signal
process.on('SIGUSR2', () => {
  heapdump.writeSnapshot('./heap-' + Date.now() + '.heapsnapshot');
});
This code creates a heap snapshot whenever the process receives the SIGUSR2 signal. You can trigger this with:
kill -USR2 <pid>Then load the snapshot file in Chrome DevTools for analysis.
Disk Space Issues
Running out of disk space can crash your entire system:
- Rotates logs daily
- Keeps 7 days of logs
- Compresses old logs (except the most recent)
- Creates new log files with specific permissions
- Reloads the application after rotation
Monitor inode usage (you can run out even with free space):
# Check inode usage
df -i
The df -i command shows inode usage for each filesystem. This is important because a filesystem can have plenty of free space but still be unable to create new files if it runs out of inodes.
Set up cleanup jobs for temporary files:
# Create a cron job to clean temp files older than 7 days
echo "0 2 * * * find /tmp -type f -atime +7 -delete" | crontab -
This cron job runs at 2 AM every day and deletes files in /tmp that haven't been accessed in the last 7 days.
Implement log rotation and compression:
# Example logrotate configuration
cat > /etc/logrotate.d/myapp << EOF
/var/log/myapp/*.log {
  daily
  rotate 7
  compress
  delaycompress
  missingok
  notifempty
  create 0640 myapp myapp
  postrotate
    systemctl reload myapp
  endscript
}
EOF
This configuration:
Use du and ncdu to find space hogs:
# Find large directories
du -h --max-depth=1 /path | sort -hr

# Interactive disk usage analyzer
ncdu /path
The du command shows disk usage for each directory, sorted by size (largest first). The ncdu command provides an interactive interface for exploring disk usage.
Network Bottlenecks
Network issues can be tricky to diagnose:
Look at packet loss rates and latency:
# Continuous ping to check latency and packet loss
ping -c 100 example.com

# More detailed network diagnostics
mtr -n example.com
The ping command measures round-trip time and packet loss. The mtr command combines ping and traceroute to show latency at each hop.
Monitor connection counts with netstat or ss:
# Count connections by state
netstat -ant | awk '{print $6}' | sort | uniq -c | sort -n

# More detailed connection view
ss -tunapl
These commands show connection statistics, helping you identify issues like connection buildup or excessive TIME_WAIT states.
Check for DNS resolution delays:
# Time DNS resolution
time dig example.com

# Check DNS settings
cat /etc/resolv.conf
The time command measures how long it takes to resolve a domain name. Slow DNS resolution can cause perceived performance issues.
Use iftop to identify bandwidth-heavy connections:
# Monitor traffic on eth0
iftop -i eth0
The iftop command shows real-time bandwidth usage by connection, helping you identify which hosts are consuming the most bandwidth.
How to Build a Monitoring Culture
Server health monitoring works best when it's part of your team's DNA:
- Make dashboards visible – Big screens showing real-time metrics create awareness
- Review metrics in retros – Learn from past incidents
- Celebrate improvements – Recognize when optimizations boost performance
- Share knowledge – Rotate on-call duties so everyone understands monitoring systems
- Automate documentation – Tools like Grafana Annotations can track deployments and changes
Set up a Monitoring Playbook
Create a standard playbook for responding to common alerts:
# High CPU Alert Response Playbook

## Initial Assessment
1. Verify the alert in Grafana dashboard
2. Check if multiple servers are affected
3. Correlate with recent deployments or changes

## Investigation Steps
1. Connect to the affected server
ssh user@affected-server
2. Check current CPU usagetop -o %CPU
3. If a specific process is consuming CPU:
- Is it expected behavior?
- Is it occurring at an expected time?
- Has the process been running longer than usual?

4. Check for unusual activity
last | head grep 'authentication failure' /var/log/auth.log
## Resolution Actions
- For application issues:
- Roll back recent deployment
- Restart the application
- Scale horizontally if legitimate load

- For system issues:
- Check for runaway cron jobs
- Look for signs of compromise
- Restart system services

## Post-Resolution
- Document findings in incident report
- Update dashboard with event annotation
- Add to next team retrospective agenda
This playbook provides a standardized approach to handling high CPU alerts, ensuring consistent investigation and resolution steps.
Wrapping Up
The best developers use monitoring data to continuously improve their code, their architecture, and ultimately, their users' experience.
Keep these principles in mind:
- Monitor what matters – Focus on metrics that affect user experience
- Alert on symptoms, not causes – Alert when users are impacted, not on low-level metrics
- Use historical data – Track trends to predict issues before they happen
- Correlate data sources – Combine server metrics, application logs, and user feedback
- Continuously improve – Refine your monitoring based on what you learn from incidents

