In this article, we discuss the nuances of federation in Prometheus, address its challenges, and consider alternatives.
What is Prometheus Federation?
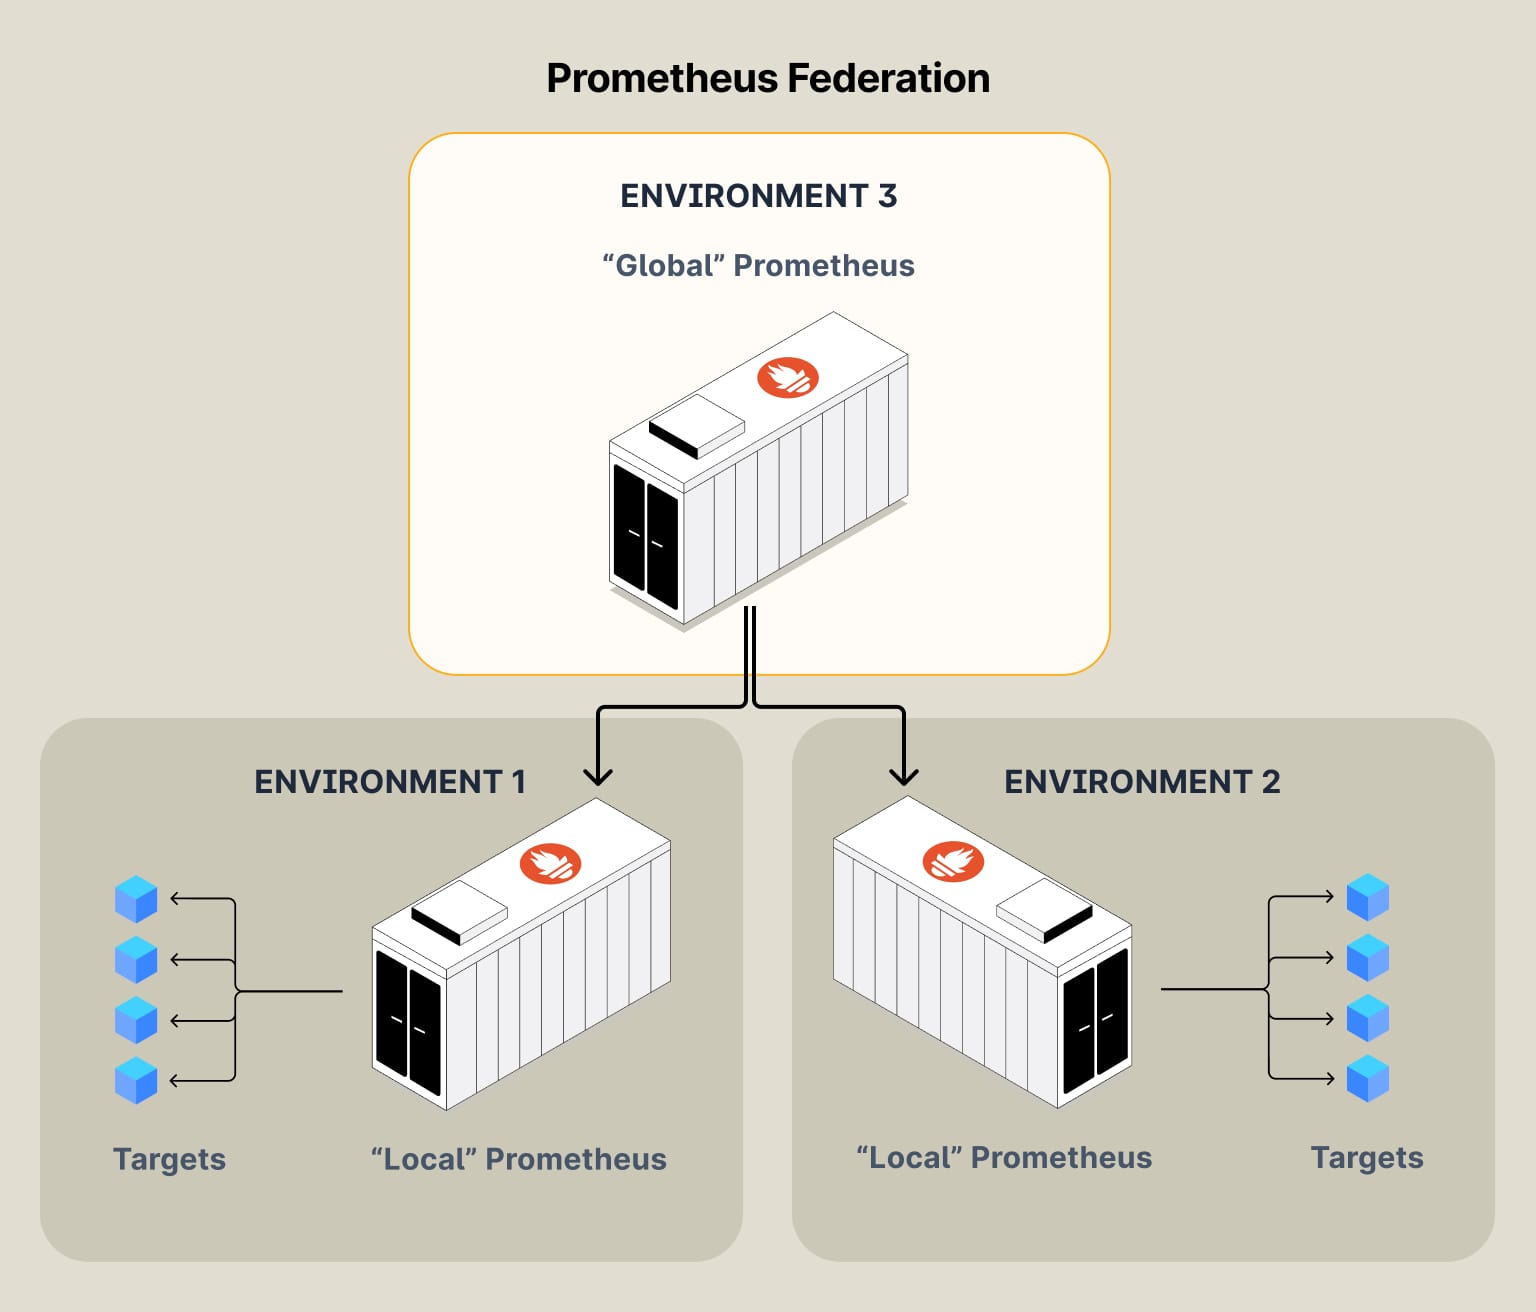
Federation in Prometheus is a method to scale and manage large-scale monitoring environments horizontally. It involves configuring multiple Prometheus servers to collect data at different levels or from different segments of your infrastructure and then aggregating them at a higher level for a global view.

Federation is needed to handle complex and large infrastructures efficiently, where a single Prometheus instance would be insufficient due to load or geographical distribution.
A federation strategy in Prometheus is typically required in environments that are either large-scale, geographically distributed, or have complex infrastructure setups.
This includes scenarios like:
- Multi-Datacenter Operations: Organizations operating across multiple data centers, needing aggregated views of their distributed systems.
- Large Enterprises: Large enterprises with extensive infrastructure, where a single Prometheus instance would be insufficient due to the sheer volume of data.
- High Availability Requirements: Systems requiring high availability, where monitoring must be robust against individual instances' failures.
- Complex Service Architectures: Environments with complex service architectures where specific cross-service metrics must be aggregated for a comprehensive overview.
- Multi-Cluster K8s Architectures: Each Kubernetes cluster has its own Prometheus instance (aka “leaf” node), which scrapes metrics from that specific cluster. Then, a higher-level, or "global," Prometheus instance is used to federate data from these “leaf” nodes.
Use cases for which Prometheus Federation is NOT the answer:
Complete duplication of metrics between two instances
Pulling large volumes of time series data through federation is not ideal because it can significantly strain the performance of the scraping and the scraped Prometheus servers. Federation is not designed to create a high-availability redundant monitoring setup. The typical HA setup approach involves running identical Prometheus servers in parallel, replicating configurations and targets.
“Global” alerting or visualization
Relying on a federated Prometheus for all alerting can be problematic due to its inherent data delay and potential loss. Since federation involves scraping data at intervals, there's usually a delay in reflecting the most recent state of metrics. This delay can lead to missed or delayed alerts. Additionally, the risk of data inconsistencies or races in a federated setup can affect the reliability of alerts. Alerting should ideally be as close to the data source as possible to ensure prompt and accurate responses to system changes.
"High Cardinality" metrics challenge
Federaration does not help with handling high cardinality metrics. Streaming Aggregation by Levitate is a better answer to tame high cardinality metrics.
How to configure federation in Prometheus
In this example, let's consider a central “Global” Prometheus server scraping metrics from 2 different Prometheus instances:
global:
  scrape_interval: 15s

scrape_configs:
  - job_name: 'global-view'
    honor_labels: true
    metrics_path: '/federate'
    params:
      'match[]':
        - '{job="app1-aggregate"}'
        - '{job="app2-aggregate"}'
    static_configs:
      - targets:
        - 'prom.domain1.com:9090'
        - 'prom.domain2.com:9090'
In the above configuration, the “global-view” server will scrape metrics from domain1.com and domain2.com Prometheus instances (using the /federate endpoint)
honor_labels is usually set in the federation configuration since we are aggregating data from multiple Prometheus instances and want to maintain the original labels from each source instance for accurate identification and distinction in the aggregated data.

Gotchas to be mindful.
Duplication of Metrics
Prometheus federation can potentially lead to data duplication on the central server, especially if the same metrics are scraped from multiple sources or the federation configuration overlaps. Unique external labels that are consistently used can help identify and differentiate metrics from different sources, reducing duplication.
Race Conditions
Race conditions in Prometheus federation can occur due to the timing of scrapes. Since federation involves scraping data from various Prometheus instances at set intervals, there's a possibility that some data may not be consistently captured if it changes state between these intervals. This inconsistency can lead to gaps or inaccuracies in the aggregated data, particularly in fast-changing metrics.
Large Writes = Scrape Timeouts and write error - broken pipe
Some potential failure scenarios in Prometheus federations include network issues leading to scraping failures and overload of the central Prometheus instance due to too much data being pulled. This causes the scrape timeout to exceed, you usually end up with a write error - broken pipe.
Prometheus Federation Alternatives
Thanos is an alternative to Prometheus Federation as it provides a more scalable and efficient way to handle large-scale Prometheus deployments. Thanos extends Prometheus by adding a global query view, efficient storage, and cross-cluster data aggregation.
Related Post - Prometheus Vs Thanos
It allows for storing Prometheus metrics in a centralized location, like an object store, which facilitates long-term data retention and analysis. This setup reduces the load on individual Prometheus instances and eliminates the need to pull large amounts of data across different Prometheus servers, as in federation.
Levitate - Managed Prometheus Remote Storage
Simplify scalability and maintenance issues with Levitate - Fully Managed, Highly Available Prometheus compatible monitoring solution, with built-in embedded Grafana and superior alerting capabilities.
In Conclusion & Related Reads:
Scaling Prometheus, mainly through federation, is a nuanced process essential for large-scale and distributed environments. The journey of scaling Prometheus is about balancing performance, reliability, and accuracy in monitoring, ensuring that as your infrastructure grows, your monitoring capabilities scale to maintain a robust and insightful observatory of your systems.
If you are dealing with Prometheus Scalability Challenges, here are some other articles we have written that you might be interested in
- How to Manage High Cardinality Metrics in Prometheus : Understanding high cardinality Prometheus metrics and proven ways to manage
- Downsampling & Aggregating Metrics in Prometheus: Comprehensive guide to downsampling metrics
- Reduce your monitoring cost by 50% : How Levitate can help you reduce your observability and monitoring costs.


