

Managing alerts in Prometheus can quickly turn into a mess if not configured properly. You end up with too many alerts firing at once, unclear severity levels, and no real sense of what’s actually broken.
Alertmanager helps solve this by handling alert routing, grouping, silencing, and deduplication. It acts as the middle layer between Prometheus and your notification channels.
In this guide, we’ll walk through setting up Alertmanager and writing a config that works well under production conditions.
What is Prometheus Alertmanager?
Alertmanager sits between your Prometheus server and your notification systems. It handles incoming alerts, filters out duplicates, groups related alerts, and sends them to the right place whether that’s Slack, PagerDuty, or just email.
Alertmanager gives you control over how alerts behave in production. You can set rules for silencing alerts during maintenance, throttle noisy alerts, and define fallback receivers.
Some of the key things it handles:
- Grouping alerts based on labels
- Rate-limiting notifications
- Silencing and inhibition rules
- Support for multiple receivers
- High-availability deployments through clustering

Prometheus RemoteWrite Exporter
How Alertmanager Fits Into the Prometheus Architecture
Alertmanager runs as a separate service alongside Prometheus, taking over once Prometheus has evaluated alerting rules and generated alerts. Prometheus sends these alerts to Alertmanager over HTTP, usually in batches.
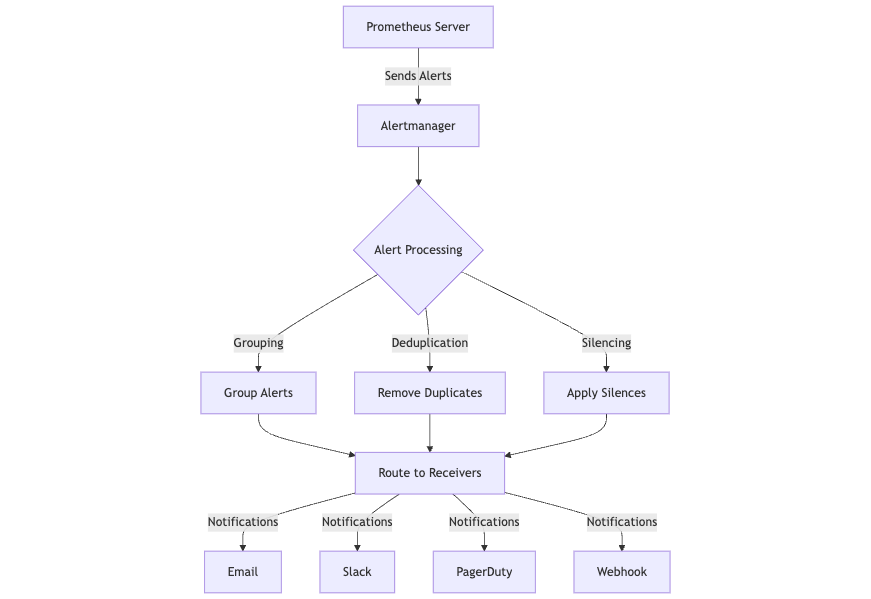
From there, Alertmanager handles the heavy lifting of managing those alerts:
- Deduplication: It filters out repeated alerts based on their labels, so you don’t get spammed by the same issue multiple times.
- Grouping: Related alerts—like multiple instances of the same alert across servers—are bundled together into a single notification.
- Routing: Using label-based rules, alerts are sent to the right team or communication channel, such as Slack, PagerDuty, or email.
- Silencing: You can mute alerts during planned maintenance or downtime by setting silencing rules using label matchers.
- Inhibition: This prevents low-priority alerts from firing if a related, higher-priority alert is already active, reducing alert noise during major incidents.
This clear separation of concerns lets Prometheus focus on metrics collection and alert generation, while Alertmanager manages everything downstream making alert delivery and noise management much easier to scale and maintain in production.
Alert Lifecycle
Every alert passes through distinct states in Alertmanager:
- Inactive: The alert condition hasn’t been met yet.
- Pending: The condition has been detected but hasn’t lasted long enough to trigger an alert.
- Firing: The alert is active, and notifications are being sent.
- Resolved: The condition cleared, and the alert is closed.
How Alert Grouping Works
Grouping is essential to avoid notification overload. For example:
Before grouping:
- alertname: HighCPU
instance: server1
severity: warning - alertname: HighCPU
instance: server2
severity: warning
After grouping:
- alertname: HighCPU
severity: warning
instances:- server1
- server2
This approach keeps your alert channels quieter and your team’s focus sharper.
Timing Parameters That Control Alert Delivery
Three key settings determine when and how grouped alerts are sent out:
- group_wait (default 30s): How long Alertmanager waits before sending the first alert, allowing related alerts to be grouped.
- group_interval (default 5m): The minimum time between notifications for ongoing alerts in the same group.
- repeat_interval (default 4h): How often Alertmanager resends an alert that’s still firing, reminding you it’s unresolved.
High Availability in Prometheus
Alertmanager supports clustering for reliability and scalability. Key features include:
- Peer-to-peer state sharing using a gossip protocol—no single leader node.
- Deduplication of alerts across all cluster nodes.
- Automatic discovery of peers, making it simple to add or remove instances.
- Built to continue working smoothly even if some nodes fail, which is critical for production-grade alerting.
Getting Started with Prometheus Alertmanager
Step 1: Installing Alertmanager
The easiest way to try Alertmanager quickly is with Docker. This runs Alertmanager in a container and maps the necessary port:
docker run \
  -p 9093:9093 \
  -v /path/to/alertmanager.yml:/etc/alertmanager/alertmanager.yml \
  prom/alertmanager
-p 9093:9093exposes Alertmanager’s web UI on your machine’s port 9093-v /path/to/alertmanager.yml:/etc/alertmanager/alertmanager.ymlmounts your config file inside the container so Alertmanager knows how to route alerts
If you are using Kubernetes, the recommended way is to deploy Alertmanager via Helm, which handles installation and upgrades smoothly:
helm repo add prometheus-community https://prometheus-community.github.io/helm-charts
helm install alertmanager prometheus-community/alertmanager
Helm installs Alertmanager with sensible defaults but allows you to customize configs through values files.
Step 2: Basic Configuration File (alertmanager.yml)
Alertmanager’s behavior is controlled by a YAML file. At minimum, you’ll define:
- Global settings like timeouts and API URLs for notification services
- Routing rules that decide how alerts are grouped and where they get sent
- Receivers which are endpoints like Slack, PagerDuty, or email
Here’s an example that sends alerts to a Slack channel:
global:
  resolve_timeout: 5m
  slack_api_url: 'https://hooks.slack.com/services/XXXXXX/YYYYYYY/ZZZZZZ'

route:
  group_wait: 30s        # Wait 30 seconds to group alerts before sending
  group_interval: 5m     # Minimum time between alert notifications
  repeat_interval: 4h    # How often to resend alerts if unresolved
  receiver: 'slack-notifications'  # Default receiver

receivers:
  - name: 'slack-notifications'
    slack_configs:
      - channel: '#alerts'
        title: "{{ range .Alerts }}{{ .Annotations.summary }}\n{{ end }}"
Why its important?
group_waitlets Alertmanager wait a bit so related alerts can arrive and be bundled, reducing noisegroup_intervalcontrols how often you get updates if alerts keep firingrepeat_intervalreminds you about long-lasting issues without spamming
Make sure to replace the Slack API URL and channel with your real values.
Step 3: Integrate Alertmanager with Your Tools
Grafana can query Alertmanager’s API to show alert statuses alongside your dashboards:
apiVersion: 1
datasources:
  - name: Alertmanager
    type: alertmanager
    url: http://localhost:9093
    access: proxy
    jsonData:
      implementation: prometheus
PagerDuty integration lets you route critical alerts to on-call responders automatically:
receivers:
  - name: 'pagerduty'
    pagerduty_configs:
      - service_key: '<your-pagerduty-service-key>'
        routing_key: '<your-pagerduty-routing-key>'
        description: '{{ template "pagerduty.default.description" . }}'
Webhooks are flexible if you want Alertmanager to send alerts to your custom systems:
receivers:
  - name: 'webhook'
    webhook_configs:
      - url: 'http://example.org/webhook'
        send_resolved: true
Step 4: Verify Alertmanager Is Running
Once Alertmanager is installed and configured:
- Open your browser at
http://localhost:9093(or your cluster IP in Kubernetes) - You should see the Alertmanager UI, which displays received alerts and their statuses
- Test your configuration by triggering an alert in Prometheus and verifying it appears here and notifications go out
Alert Routing and Inhibition in Prometheus Alertmanager
How Alert Routing Works
Alertmanager uses a routing tree to decide where alerts go. Think of it as a flowchart that matches alert labels to specific teams and notification channels. Here’s a simple example:
root:
  ├── team: frontend
  │   ├── severity: critical → pagerduty
  │   └── severity: warning → slack
  └── team: backend
      ├── severity: critical → opsgenie
      └── severity: warning → email
Routing decisions rely on:
- Label matchers: Alerts are matched based on key-value pairs like
team: frontendorseverity: critical. - Continue flag: Determines if routing should proceed down the tree or stop after a match.
- Route order: Routes are evaluated in sequence, top to bottom.
- Match groups: Alerts with matching labels are grouped together for notifications.
Inhibition Rules: Reduce Alert Noise
Inhibition lets you suppress less critical alerts when a related, more severe alert is already firing. This keeps your notifications focused on what really matters.
For example:
Incoming alerts:
- Alert: Instance Down (Severity: Critical)
- Alert: Service Unavailable (Severity: Warning)
- Alert: High Latency (Severity: Warning)
After inhibition, only the critical alert fires:
- Alert: Instance Down (Severity: Critical)
(Other warnings suppressed because the critical alert is active)
This prevents a flood of alerts for symptoms that are secondary to a bigger problem.
Integration Models for Alertmanager
Alertmanager can work in several modes depending on how you want to integrate it with other systems:
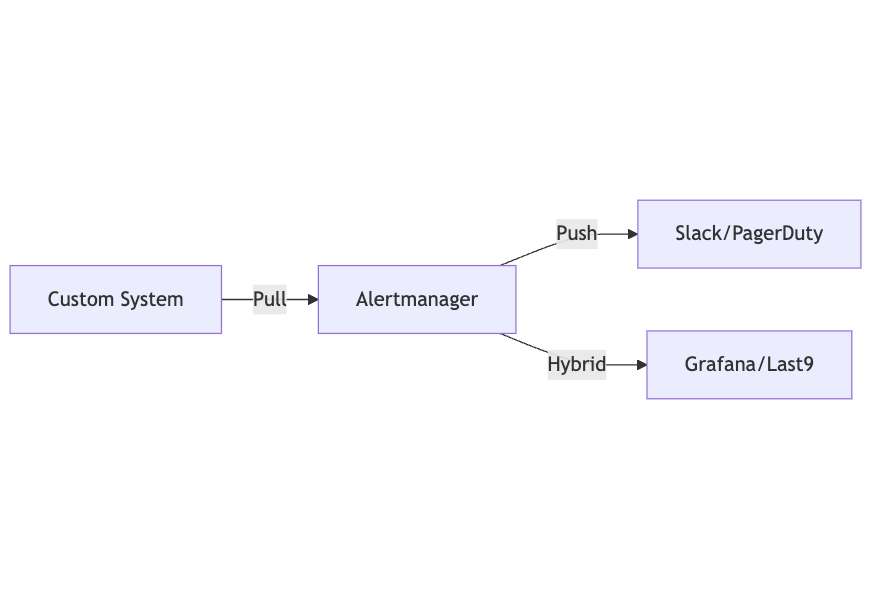
- Push Model: Alertmanager actively pushes alerts to receivers like Slack, PagerDuty, or webhooks.
- Pull Model: External systems query Alertmanager via its API to get alerts, useful for custom dashboards or tools.
- Hybrid Model: Combines both push and pull—for example, Grafana or Last9 can pull alerts for display while Alertmanager pushes critical notifications.
Troubleshooting Common Issues
1. Alerts Not Triggering
- Check Alert Conditions: Ensure that the alert conditions defined in your Prometheus rules are correct. Validate that the metrics are being scraped properly.
- Inspect Prometheus Logs: Look at the Prometheus server logs for any errors related to rule evaluation. Errors here can prevent alerts from firing.
2. Duplicate Alerts
- Review Deduplication Settings: Ensure that alerts are correctly labeled to allow for deduplication. Use consistent labels across your alerting rules to prevent duplicate notifications.
- Check Alert Grouping Configuration: Verify that the alert grouping parameters (like
group_by) are configured properly to group similar alerts.
Fix and test Prometheus alerts faster — right from your IDE, with AI and Last9 MCP.


3. Alerts Going Unnoticed
- Verify Receiver Configuration: Check that the receivers (e.g., Slack, PagerDuty) are correctly configured and reachable. Ensure that there are no network issues preventing notifications.
- Monitor Alertmanager Logs: Review Alertmanager logs for any errors or warnings that may indicate issues with notification delivery.
4. Excessive Alert Notifications
- Adjust Timing Parameters: Tune
group_interval,repeat_interval, andgroup_waitsettings to reduce the frequency of notifications while ensuring critical alerts are still highlighted. - Use Silence and Inhibition: Implement silencing for known issues during maintenance windows and use inhibition to suppress less critical alerts when higher severity alerts are active.
5. Configuration Errors
- Validate Configuration Files: Use the
alertmanager --config.fileflag to validate your configuration file syntax before starting Alertmanager. Look for errors in the configuration that may prevent it from running. - Check Template Errors: If alerts are not sending as expected, check for syntax errors in your Go templates. Use the templating documentation to troubleshoot issues.
6. Alertmanager Downtime
- Implement High Availability: Set up a high-availability configuration for Alertmanager to prevent downtime from a single instance failure. Use clustering to ensure alerts are processed reliably.
- Monitor Health: Set up monitoring for the Alertmanager instance itself, using Prometheus to scrape its health metrics.
Best Practices for Alert Management
1. Define Clear Alert Criteria
- Avoid Alert Fatigue: Clearly define the conditions that warrant an alert. Focus on metrics that directly correlate with system performance and user experience. Avoid alerting on transient issues or noise.
- Use Severity Levels: Categorize alerts into severity levels (e.g., critical, warning, info) to prioritize response and attention. Critical alerts should trigger immediate action while warning alerts can be monitored.
2. Align Alerts with Business Objectives
- SLO and SLA Considerations: Align alerts with Service Level Objectives (SLOs) and Service Level Agreements (SLAs) to ensure they reflect the business impact. Use these objectives to determine acceptable thresholds for alerting.
3. Regular Review and Tuning
- Audit Alerts Periodically: Regularly review your alerting rules to ensure they remain relevant. Remove or adjust alerts that no longer apply, and refine thresholds based on historical incident data.
- Learn from Incidents: After an incident, analyze the alerts that triggered and how they contributed to the issue. Use this feedback to improve alert definitions and responses.
4. Implement Grouping and Inhibition
- Use Alert Grouping: Configure alert grouping to reduce the number of notifications during an incident. This helps in presenting alerts in a consolidated manner, reducing noise for the on-call team.
- Apply Inhibition Rules: Implement inhibition rules to suppress alerts that are less critical when a more severe alert is active. This prevents unnecessary alerts that could distract from resolving critical issues.
5. Utilize Templates for Notifications
- Customize Alert Messages: Use Go templating to create informative and actionable alert messages. Include relevant context, such as affected services, links to documentation, and potential remediation steps.
6. Monitor Alert Manager Health
- Watch for Alertmanager Metrics: Keep an eye on Alertmanager's internal metrics to ensure it is functioning correctly. Monitor for errors, dropped alerts, and latency in alert processing.
- Set Up Health Checks: Use health checks to ensure Alertmanager is reachable and responsive. This helps prevent silent failures that may lead to missed alerts.
7. Security Best Practices
- Implement Authentication and Authorization: Use authentication mechanisms (e.g., basic auth, API tokens) to secure Alertmanager endpoints. Implement role-based access control to restrict permissions.
- Use TLS Encryption: Secure communications between Alertmanager and its clients or integrations using TLS encryption to protect sensitive data.
Next Steps
- Review the official documentation for updates
- Join the Prometheus community on GitHub
- Explore advanced integrations with other monitoring tools
- Consider contributing to the open-source project
This comprehensive guide should help you implement and maintain a robust alerting system using Prometheus Alertmanager.
FAQs
What is Prometheus?
Prometheus is an open-source monitoring and alerting toolkit designed for reliability and scalability. It collects and stores metrics as time series data, providing a powerful query language (PromQL) to retrieve and analyze this data. Prometheus is particularly well-suited for monitoring dynamic cloud environments and microservices.
What is Alertmanager?
Alertmanager is a component of the Prometheus ecosystem that manages alerts generated by Prometheus. It handles alert processing, deduplication, grouping, and routing notifications to various receivers, such as email, Slack, or PagerDuty, ensuring that teams are notified of critical issues without being overwhelmed by alerts.
What is the difference between Grafana and Prometheus alerts?
Prometheus is primarily a metrics collection and monitoring system, while Grafana is a visualization tool that can display those metrics. Prometheus can trigger alerts based on defined conditions, which are then managed by Alertmanager. Grafana, on the other hand, provides visualization of metrics and can also set up alerts based on the metrics it displays, but it does not collect or store metrics itself.
How do I install Alertmanager in Prometheus?
You can install Alertmanager using Docker or Helm in Kubernetes. For Docker, use the following command:
docker run -p 9093:9093 -v /path/to/alertmanager.yml:/etc/alertmanager/alertmanager.yml prom/alertmanagerFor Kubernetes, add the Helm chart repository and install it:
helm repo add prometheus-community https://prometheus-community.github.io/helm-charts
helm install alertmanager prometheus-community/alertmanager
How do I set up alerting rules in Prometheus Alertmanager?
To set up alerting rules in Prometheus Alertmanager, define your alerting rules in a YAML file (typically prometheus.yml). Specify the conditions under which alerts should trigger and the actions to take when an alert is fired. Then, configure Alertmanager to handle those alerts and send notifications based on your setup.

