

Getting telemetry out of a distributed system isn’t the hard part. Getting it out cleanly, without noise, drop-offs, or odd performance side-effects - that’s where things get interesting. Before you worry about processors or storage costs, you need a clear plan for where the OTel Collector should run.
Most teams narrow this down to two options: a sidecar that sits next to each service, or a node-level agent that handles data for everything running on the node. Both patterns are solid. The difference is evident in how they behave under load, the level of control required, and the degree of tight coupling you want between the Collector and the application.
In this blog, we talk about how each model works in practice, what to expect when you deploy it, and the trade-offs you should factor in before making a call. The goal is simple: help you pick a setup that gives you stable telemetry without stressing your system or your team.
OpenTelemetry: The Foundation of Observability
Before choosing a deployment pattern, it helps to understand what OpenTelemetry brings to your setup and how it supports the way you already work.
What is OpenTelemetry?
OpenTelemetry gives you a standard way to create traces, metrics, and logs across your services. You get APIs, SDKs, and auto-instrumentation for most languages, which means you don’t have to juggle different formats or naming styles across teams or frameworks.
As your system grows, you’ll notice that having data in one consistent shape makes your life easier - queries behave the same across services, attributes follow the same pattern, and you spend less time sorting through mismatched telemetry. OpenTelemetry makes that possible without tying you to any particular vendor or backend. It’s the transport layer, not the storage layer.
The OpenTelemetry Collector: Your Core Data Path
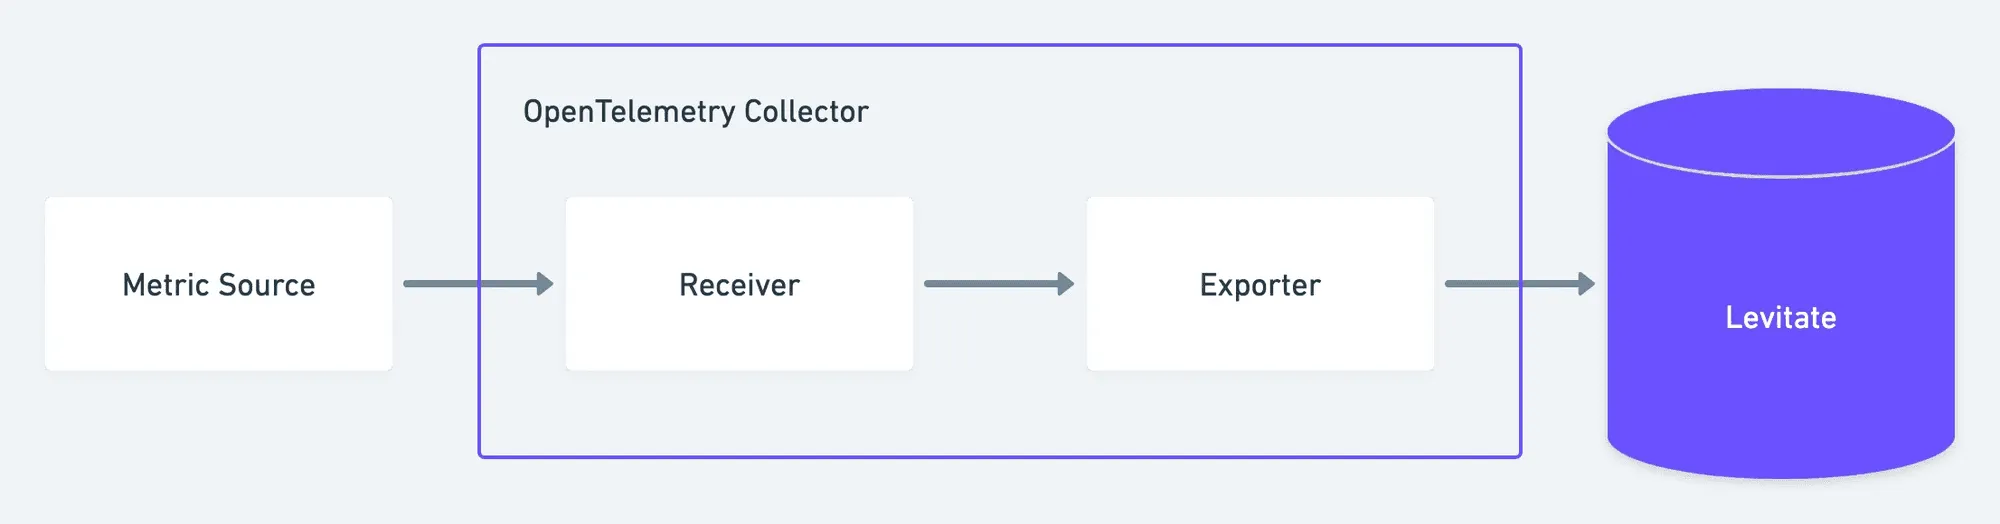
The OpenTelemetry Collector is often the main piece in the pipeline. It sits between your applications and your backend and helps you manage the flow of telemetry without pushing extra work onto your services.
Here’s what it handles for you:
Receive data
It accepts many protocols - OTLP, Jaeger, Zipkin, Prometheus, and others. This lets you connect both new and older systems without rewrites.
Process data
You can adjust or enrich the data before it leaves the node. That includes dropping fields you don’t need, adding attributes for context, batching, sampling, or converting formats. These steps help you keep data useful and manageable.
Export data
The Collector can send the same stream of data to multiple backends - Prometheus, Jaeger, cloud platforms, or any system that supports OTLP. This gives you flexibility in how you route and store telemetry, and it lets you test changes without touching application code.
The main benefit for you is separation: your services stay focused on their actual work, while the Collector handles telemetry movement and transformation. This gives you flexibility in how you evolve your observability stack without constant instrumentation changes.
For a closer look at how trace data comes together, our guide on spans and events breaks down the structure cleanly.
Architectural Patterns for OpenTelemetry Deployment
Once you understand the components involved, the next step is deciding how telemetry should move through your system. This is where the deployment pattern comes in. Your choice determines how data leaves each service, how much work the Collector handles locally, and how the overall pipeline behaves under load.
The Fundamental Decision: Sidecar vs. Agent
In most production setups, you’ll decide between running the Collector as a sidecar or as a node-level agent. Both receive and forward telemetry for you, but the way they operate inside the platform is very different.
Here’s the core difference:
- A sidecar runs next to the application pod, giving you a dedicated Collector instance for that service.
- A node agent runs once per node, sharing a single Collector instance across all workloads on that node.
This choice influences several technical aspects you’ll deal with later:
- Resource usage: per-pod isolation vs. shared CPU and memory
- Failure boundaries: one Collector per service vs. one Collector per node
- Configuration scope: service-specific configs vs. shared defaults
- Update behavior: rolling out changes per pod vs. per node
- Network paths: local loopback vs. cross-container or host-network paths
- Load patterns: predictable per-service traffic vs. node-level burst handling
None of these are “better” or “worse” on their own - they simply shape how your telemetry pipeline behaves once real traffic hits it.
The OpenTelemetry Sidecar Pattern
The sidecar model is common in container setups because it fits naturally into how Pods group containers together.
What is a Sidecar?
In an OpenTelemetry setup, a sidecar is a separate container placed next to your application container inside the same Pod (or equivalent unit in non-Kubernetes environments). Both containers share the same network namespace, so your application can send telemetry to the sidecar over localhost.
The sidecar handles the local collection, basic processing, and forwarding of telemetry to a central Collector or directly to your backend.
For example:
If your service emits metrics and traces, you point it to localhost:4317 (or whichever OTLP endpoint you expose). The sidecar Collector receives the data, processes it, and forwards it to Prometheus, Jaeger, or any backend you choose.
Advantages of the Sidecar Model
Strong process isolation
The sidecar runs independently of your main service. If one of them restarts or crashes, the other usually continues without direct impact. This also reduces the chance of telemetry failures spilling into application behavior.
Cleaner application code
Your application doesn’t need to worry about exporters, batching, or retry logic. It just sends data to a local endpoint. This keeps telemetry responsibilities out of your business logic.
Language-agnostic setup
Since the sidecar receives data over standard protocols, it works with services written in any language. This helps in environments where teams use different stacks.
Configurable per-service behavior
The sidecar can have its own resource limits, processors, and exporters. You can tune telemetry pipelines per service without affecting the entire node.
Consistent environment for every service
Every Pod gets the same telemetry pipeline. You avoid subtle differences in telemetry handling across teams or frameworks.
Disadvantages of the Sidecar Model
Higher resource usage
Each Pod runs its own Collector instance. Across a large cluster, this adds up. CPU and memory overhead become noticeable when you have hundreds or thousands of Pods.
More deployment work
Each Pod needs a sidecar attached to it. Tools like mutating admission controllers or service meshes help automate this, but you still manage more moving pieces.
Lifecycle coupling
When the Pod restarts, the application and the sidecar restart together. If your service restarts often, you’ll see short gaps in telemetry while the sidecar comes back up.
Limited to the local application
A sidecar focuses only on the telemetry produced inside its Pod. It cannot collect host-level metrics or logs from other processes running on the same node.
More components to watch
You gain isolation, but you also multiply the number of Collectors running in the cluster. This increases the number of processes you need to observe and troubleshoot.
When to Choose a Sidecar
A sidecar setup fits well when:
- You run Kubernetes and want a telemetry pipeline tied directly to each service.
- You work with many microservices and want predictable isolation between them.
- You run a polyglot environment where different teams use different languages.
- You want minimal telemetry logic in your application code and prefer to shift that responsibility to a co-located Collector.
This pattern works best when you value isolation and per-service control, and you’re comfortable with the additional resource overhead.
See how auto-instrumentation behaves across different runtimes in our detailed guide.
The OpenTelemetry Agent Pattern
The agent model places a single Collector instance at the host or node level. Instead of attaching a Collector to every service, you run one per machine, and every workload on that machine sends telemetry to it.
What is an Agent?
In OpenTelemetry terms, an agent is a Collector running as a host-level service.
On Kubernetes, this usually means a DaemonSet: one Collector per node.
Applications on that node send their telemetry to a fixed host address (for example, otel-agent:4317 or localhost:4317 with host networking enabled.
The agent receives data from all Pods on that node, processes it, and forwards it to upstream Collectors or directly to your backend.
Advantages of the Agent Model
Lower overall resource usage
A single Collector handles telemetry for many services. If your nodes run dozens of Pods, this reduces CPU and memory overhead compared to running one sidecar per Pod.
Centralized processing at the node level
Since all telemetry from the node flows through one Collector, batching, sampling, filtering, and attribute updates happen in one place. This gives you predictable network usage and reduces duplication of work.
Wider visibility
A node-level agent can access host metrics, container stats, system logs, and other data that a Pod-level sidecar can’t reach. This helps when you want application and host telemetry in the same pipeline.
Simpler operational footprint
You manage one Collector per node, not one per application. That means fewer deployments, fewer configuration files, and fewer components to track when tuning the pipeline.
Independent lifecycle
The agent stays up even if applications on the node restart. Host-level telemetry and OS metrics continue to flow without interruption.
Disadvantages of the Agent Model
Possible bottlenecks
A single Collector now handles all workloads on the node. If resource limits are too low or traffic spikes unexpectedly, the agent can fall behind on processing or drop data.
Lower isolation
If the agent crashes or becomes unresponsive, every application on that node loses its telemetry path. This creates a single point of failure for that node’s data.
Competes for host resources
Even though the agent saves CPU overall, it still shares the node with all applications. If it consumes more memory or CPU than expected, it affects every workload on the host.
Less fine-grained control
Any processor or filter you apply affects all applications sending data to that agent. Per-service customization is harder unless you route data to separate pipelines upstream.
Broader security surface
A host-level Collector often has higher privileges and a wider view of the node. It needs careful hardening to avoid exposing sensitive host information.
When to Choose an Agent
An agent model fits well when:
- You run workloads on VMs or bare metal, where host-level monitoring is already part of your setup.
- Your Pods per node are low to moderate, and a single Collector can comfortably handle the load.
- You need host metrics and logs in addition to application telemetry.
- Resource efficiency matters, and you want to avoid running hundreds of sidecars.
- You prefer fewer Collector instances to manage, especially in clusters with simple routing requirements.
Take a look at how tracing captures full request journeys in our OpenTelemetry tracing guide.
OpenTelemetry Collector Deployment Modes
Once you decide between sidecar and agent patterns, the next thing you’ll work through is how the Collectors themselves are arranged. OpenTelemetry lets you run Collectors in different roles, and most production setups use more than one mode to build a full telemetry pipeline.
The Different Collector Modes
OpenTelemetry Collectors usually run in two core modes. You can run one or both, depending on how much processing you want to push closer to the application.
1. Agent Mode (Node-Level Collector)
In this mode, you run a Collector on each node or host.
Applications on that node send telemetry to it directly.
You’ve already seen how this works: the agent receives data locally, handles light processing-such as batching, retries, and simple filtering-and then forwards the data upstream.
Agent mode gives you:
- predictable local collection
- low network cost between the app and the Collector
- the ability to add quick processing steps without involving the central layer
But agent mode isn’t meant to do heavy work. You keep the pipeline lightweight so the node-level Collector stays responsive.
2. Gateway Mode (Central Collector Layer)
A gateway Collector runs as a shared service, not tied to any specific node.
Agents (or sometimes applications) forward telemetry to this central layer.
This is where you usually place the heavier processing. The gateway sits upstream, has more resources, and can scale horizontally.
Typical tasks handled at the gateway level include:
- Aggregation - combining data from many nodes or services
- Global enrichment - adding attributes that belong to your org or environment
- Sampling - head-based or tail-based sampling that requires a cluster-level view
- Format conversion - reshaping data before exporting
- Fan-out - sending the same telemetry to multiple backends
- Load distribution - spreading the export load across backend instances
Because this layer is central and scalable, you can apply more CPU-heavy or memory-intensive processors without affecting application performance.
Most real-world deployments pair both modes:
Agents handle local collection, and gateway Collectors handle heavier processing.
This setup keeps your node-level Collectors light while giving you space to run advanced processors, routing rules, and multi-backend exports at scale.
If you’re mapping out the full pipeline, this guide on choosing the right OpenTelemetry backend helps you compare the options clearly.
A Few Considerations for Implementation
When you pick between sidecars, agents, or a layered setup with gateways, the choice usually comes down to the operational realities of your environment. Each model affects performance, cost, stability, and the amount of work you need to put into managing the pipeline.
Resource Management and Overhead
Sidecars
A sidecar adds CPU and memory to every Pod. In environments with many small services, this overhead grows quickly. Even if each sidecar is lightweight, the combined footprint across a full cluster can be large.
Agents
A single agent handles telemetry for every workload on the node, which keeps overall resource usage lower. The trade-off is that the agent must be sized for peak telemetry volume on that node. If it’s under-provisioned, it becomes a source of backpressure.
Gateway Collectors
Gateways need enough CPU and memory to handle the combined data coming from many agents. The more processors you enable-sampling, enrichment, routing-the more resources the gateway layer needs. Proper sizing is key if you want to avoid dropped data or delays in forwarding.
Network Latency and Bandwidth
Sidecars
Your application sends telemetry to the sidecar over localhost, which keeps latency minimal. But each sidecar then opens its own connection to the gateway or backend. In large clusters, this results in many outbound connections.
Agents
Applications still use localhost, but the node-level agent batches and compresses data before sending it upstream. This reduces connection count and often lowers bandwidth usage across the network.
Collector-to-Backend Traffic
The distance between Collectors and the backend matters. Higher network latency or lower throughput demands more aggressive batching, compression, or queueing in the Collector config to keep data flowing reliably.
Security Implications
Sidecars
Sidecars run in a narrow scope. They interact only with the application container and the upstream Collector or backend. This smaller security footprint makes them easier to harden.
Agents
An agent typically interacts with multiple workloads and may access host-level resources. This requires more careful security controls-restricted permissions, locked-down host paths, and consistent patching.
Network Security
Any communication across nodes or out of the cluster should use TLS. mTLS, API keys, restricted network policies, and strict routing rules help prevent unauthorized access or telemetry leaks.
Operational Complexity and Management
Sidecars
Managing a sidecar for every service increases the size of your manifests. It also gives you many Collectors to watch, patch, and configure. Most teams automate injection through admission controllers or service meshes to make this practical.
Agents
Managing one agent per node is far simpler. Configuration updates touch fewer instances, and rollout patterns are easier to control. This keeps operational effort lower, especially in large clusters.
Gateway Collectors
Gateways need to run as a resilient service. They must be monitored closely, scaled horizontally, and configured with proper queues or buffers. A backlog or crash at the gateway affects telemetry across the system.
Scalability and Resilience
Sidecars
Sidecars scale automatically with your application replicas. If you deploy ten more Pods, you get ten more Collectors, each handling its local workload. Failures remain isolated-one misbehaving sidecar doesn’t affect others.
Agents
Scaling happens by adding nodes, not Pods. If an agent fails, every service on that node loses its telemetry path. The load must be balanced across nodes carefully to avoid overwhelming an agent.
Gateway Collectors
Gateways work best as a cluster behind a load balancer. They should scale horizontally and use persistent queues (local storage or external systems like Kafka) to protect against backend slowdowns. This keeps your telemetry durable even when upstream systems are struggling.
Hybrid Approaches: Sidecars and Agents
You don’t have to choose one pattern and stick to it forever. In many real systems, a mix of sidecars, node agents, and gateway Collectors gives you better control over performance and a cleaner separation of responsibilities. A hybrid model lets you place the right amount of processing at each layer without overloading any single component.
Can You Use Both?
Yes - and in many cases, it’s the most stable setup. The idea is simple: keep the per-service pieces lightweight, shift shared work to the node, and handle the heavy processing in a central tier.
A sidecar sits next to your application and receives telemetry over localhost. Its job is intentionally small: take what the application emits, batch it, and pass it to the node agent. Because it’s co-located, you get predictable performance and a stable handoff even when network conditions vary.
Node agents take over once data leaves the sidecar. They receive telemetry from all Pods on the node and can also scrape host metrics or system logs. This is where broader context gets added - host attributes, container metadata, or basic filtering before forwarding.
The gateway tier is where you push the expensive work. This layer scales independently, often as a deployment behind a load balancer, and handles sampling, enrichment, routing, aggregation, and exporting to multiple backends.
Design a Hybrid Observability Architecture
A typical flow looks like this:
- Application container generates telemetry, either through SDKs or auto-instrumentation.
- A sidecar in the same Pod receives the data over
localhost. It applies minimal processing, mainly batching or simple retries, and forwards data to the node agent. - The node agent runs as a DaemonSet, collecting data from all sidecars on that node. It also gathers host-level metrics, system logs, or container stats. This is the first layer where you can add shared attributes or drop fields you don’t need.
- Gateway Collectors sit at the center and receive data from every node. This is the layer where you apply CPU-heavy operations: advanced sampling, enrichment, format conversion, or fan-out to multiple backends.
- Backends store and visualize the processed data, whether that’s Prometheus, Jaeger, Loki, or a commercial platform.
Why This Tiered Model Works Well
The strength of a hybrid architecture comes from how responsibilities are distributed.
Sidecars give each application a clean “local exit” for telemetry without affecting the application’s code or network path. Node agents reduce network noise by aggregating data and handling shared tasks once per machine instead of once per Pod. And gateway Collectors let you scale the heavy processing layer independently of the applications or nodes.
In practice, this setup gives you isolation at the edge, efficiency at the node, and control in the center - without overloading any single part of the system.
If you’re pairing traces and metrics with logs, this guide on how OpenTelemetry handles logging adds the missing piece.
How to Make the Right Decision
When you compare sidecars, agents, and multi-tier models, the choice becomes easier once you break it down into the conditions you operate under. A structured approach helps you see which pattern fits your environment instead of forcing a one-size-fits-all answer.
Below is a decision framework you can walk through step by step.
1. Understand Your Deployment Environment
Your platform often points you toward a default model.
- Kubernetes supports sidecars naturally because Pods already package containers together.
- VMs or bare metal tend to favor node agents since host-level collection comes almost for free.
If you run a mix, expect to combine patterns.
2. Evaluate Application Density on Each Node
How many services run per node affects the economics.
A high-density node (many small Pods) multiplies sidecar overhead.
A low-density node can afford it, and sidecars give you cleaner isolation.
Ask yourself:
Do I have hundreds of replicas per node or just a handful?
3. Budget Resources for Telemetry Infrastructure
You need to decide where the CPU and memory should be spent.
- Sidecars spread the cost across Pods.
- Agents centralize cost at the node.
- Gateways require dedicated resources proportional to global traffic.
It’s not just cost - it’s predictability.
Sidecars give per-service guarantees. Agents give aggregate efficiency.
4. Decide How Much Isolation You Want
Isolation acts as a control boundary.
If a single Collector should never affect multiple services, sidecars give you that safety.
If you’re comfortable with shared components, the agent path is simpler and cheaper.
5. Determine Whether You Need Host-Level Data
If your observability goals include OS metrics, container runtime data, disk I/O, or kernel events, node agents fit naturally.
Sidecars won’t have access to those signals.
6. Estimate How Much Central Processing You Need
Some workloads require heavy processing before export:
- advanced sampling
- global enrichment
- attribute normalization
- multi-backend fan-out
If these matter, you’ll likely need a gateway tier regardless of sidecar vs. agent.
7. Match the Architecture to Team Skills
It’s not only about the system; it’s about who runs it.
Sidecars require more operational tooling or automation.
Agents are easier to manage but give you less per-service control.
If your team is strong with Kubernetes automation, sidecars feel natural.
If you prefer fewer moving parts, agents reduce the surface area.
8. Consider Security Boundaries
A sidecar holds minimal privileges, interacts with only one application, and has a tightly scoped role.
An agent touches more surfaces:
- multiple services
- host resources
- outbound traffic to gateways
This expands the hardening work.
Your security model may tilt the decision more than your infrastructure model.
9. Account for Scaling Behavior
Your telemetry pipeline must keep up with application scale.
- Sidecars scale automatically as Pods scale.
- Agents stay fixed per node, so you size them for peak traffic.
If your system scales rapidly or unpredictably, sidecars give you capacity that matches workload shape automatically.
Once you walk through these questions, you get a clear view of which model supports your environment:
- Sidecars work when isolation and per-service control matter.
- Agents fit when resource efficiency and simplicity matter.
- Gateways become essential when you need strong central processing.
- Hybrid approaches make sense when your workload spans multiple environments or requirements.
This structure helps you map your operational reality to a deployment model that stays stable under load, is easy to manage, and is aligned with the data you want to collect.
Final Thoughts
The choice between sidecars, agents, or a multi-tier Collector setup depends on how your workloads behave and where you want the control boundaries to sit. Each pattern solves a specific problem, and most production environments end up combining them to match application density, resource budgets, and processing needs.
Once the pipeline shape is clear, the backend becomes the next decision point. This is where Last9 fits naturally. We work with any Collector layout and handle the data as it arrives-no custom exporters, no format conversions, and no sampling rules.
Here’s what you get when the telemetry reaches us:
- Native OTLP ingestion from sidecars, node agents, or gateway Collectors
- Consistent sampling behavior, even when Collectors are spread across layers
- High-cardinality support without forcing you to drop labels or attributes
- Reliable ingestion under load, with backpressure handling and queueing
- Unified access to metrics, logs, and traces without extra routing rules
You design the Collector architecture that fits your environment.
We make sure the data remains accurate, complete, and fast to query once it gets here.
Start for free today or connect with us for a detailed walkthrough!
FAQs
Did the Instrumentation resource install?
If you’re using the OpenTelemetry Operator, the quickest way to confirm is to check whether the Instrumentation object is actually active.
Run kubectl get instrumentation -A - your resource should show up with a ready status.
If it does, kubectl describe instrumentation <name> will show whether the operator picked it up and what runtimes it plans to inject.
A good final check is to look at one of your Pods. If injection worked, you’ll see the expected OTEL_* environment variables or runtime flags. If not, the operator webhook logs usually make it clear why.
Is the auto-instrumentation annotation correct?
Most issues come from a small annotation typo or placing it on the wrong object. Make sure the annotation sits on the Pod template inside your Deployment.
Typical ones look like:
instrumentation.opentelemetry.io/inject-java: "true"instrumentation.opentelemetry.io/inject-python: "true"instrumentation.opentelemetry.io/inject-nodejs: "true"
If you’re targeting specific containers, double-check that the names match exactly with the ones in the Pod spec.
Was the auto-instrumentation endpoint configured correctly?
Your application needs to know where the Collector is. If you’re using a sidecar, that usually means:
OTEL_EXPORTER_OTLP_ENDPOINT=http://localhost:4317(gRPC), orhttp://localhost:4318(HTTP)
A quick Pod exec to print environment variables is enough to verify this. If the app is pointing to the wrong port, you’ll see connection-refused errors or silent drop-offs.
What are the steps for installing the OTel Collector as a sidecar in ECS Fargate to monitor applications?
On Fargate, you set this up in the Task Definition:
- Add a second container running the OTel Collector.
- Expose OTLP ports inside the task so the app can reach the sidecar over
localhost. - Mount a Collector config (or pass it through environment variables) that defines receivers, processors, and exporters.
- Update the application to send OTLP data to the sidecar endpoint.
- Deploy and read the Collector logs to confirm data is arriving.
Fargate treats the sidecar the same way it treats any extra container - the difference is just the config wiring.
Was the auto-instrumentation endpoint configured correctly?
If the app still isn’t sending data, confirm that the OTEL_EXPORTER_OTLP_* settings match the transport your Collector is listening on. A mismatch between HTTP and gRPC is a common source of confusion.
How does using an OpenTelemetry sidecar improve application observability?
A sidecar gives your application a stable, local drop-off point for telemetry. No network hops, no guessing which Collector instance to hit, and no exporter logic built into your app.
You usually get:
- fewer dropped spans during restarts
- consistent batching and retries
- simpler application configuration
- isolation from issues in upstream Collectors
This setup is especially useful when you want predictable behavior across many services.
How do I set up an OpenTelemetry sidecar for monitoring microservices in Kubernetes?
You attach a Collector container next to your application inside the same Pod.
- Add the Collector as a second container
- Enable the OTLP receiver
- Keep the config light (batching + forwarding)
- Point your app to
localhost:4317or:4318 - Roll out and confirm the sidecar logs show incoming telemetry
Most teams let the gateway layer handle heavier processing.
How do I set up OpenTelemetry as a sidecar for distributed tracing in Kubernetes?
The steps are the same, but make sure your Collector config enables the traces receiver and exporter. Your application’s tracer should point to the sidecar’s OTLP port, and the sidecar forwards the spans upstream to your tracing backend or gateway Collector.
How do I deploy OpenTelemetry as a sidecar to collect application metrics and traces?
The Collector sidecar can receive both signals through the same OTLP receiver.
As long as your app emits metrics and traces using OTLP, the sidecar will forward them to whichever backend or gateway you configure.
How do you use OpenTelemetry as a sidecar to enhance application observability?
By giving each service its own local Collector, you get consistent behavior across Pods and avoid depending on a network path for telemetry. The sidecar handles retries, batching, and forwarding, while your app stays focused on business logic.
How do I deploy OpenTelemetry as a sidecar in a Kubernetes environment?
Define a Pod or Deployment with:
- Your application container
- the OTel Collector sidecar
- a small config with an OTLP receiver and an exporter
Point your app to the sidecar’s local endpoint, roll out, and confirm traffic is flowing. That’s all you need for a functioning sidecar pattern.
If you want, I can turn this into a cleaner, formatted FAQ block ready for Ghost or include links to relevant Last9 docs for internal linking.

