

TL;DR:
- Semantic conventions give telemetry a shared vocabulary — consistent attribute names, units, and structure — so data from different services can be queried and compared without guesswork.
- By standardising keys like
http.route,db.system, orservice.name, they reduce instrumentation drift and make traces, metrics, and logs easier to analyse across teams and environments. - Following these conventions early helps avoid subtle inconsistencies that show up later in dashboards, alerts, or PromQL filters.
Introduction
It’s 2 AM. Your API is timing out. Logs show a slow query. Metrics flag a spike in DB connections. Traces reveal a 5-second delay on a database call.
But then the questions start:
- Which database?
- Does the query match the delay?
- Why doesn’t this align with the connection pool metrics?
Each tool uses different labels, db.name, database, sometimes nothing at all. Without a shared schema, connecting the dots is slow and frustrating.
The Problem: Everything Has Different Names
You’ve confirmed it’s a database issue. But each tool describes it differently:
In your tracing tool:
span.name: "database_call"operation: "query"target: "db-server-1"In your metrics dashboard:
metric: "postgres_connections_active"instance: "primary_db"In your logs:
message: "Slow query detected on users_db"host: "db.internal"So now you’re stuck asking:
- Is
db-server-1the same asprimary_db? - Is
users_dbhosted ondb.internal? - Are all of these pointing to the same failing instance?
You can’t say for sure. And that’s the problem.
Without consistent naming, your tools won’t talk to each other. You end up doing the mapping in your head, cross-referencing hostnames, database names, and labels that never quite match up. It’s time-consuming, frustrating, and completely avoidable.
The Solution: Opentelemetry Semantic Conventions
The fix is simple: use the same names across all your tools.
That’s what OpenTelemetry semantic conventions solve. They give you a standard set of attributes, so your traces, metrics, and logs all describe things the same way.
Instead of one tool saying db-server-1, another saying primary_db, and a third saying users_db, everything uses the same fields:
{ "db.system": "postgresql", "db.name": "users_db", "db.operation": "SELECT", "net.peer.name": "db.internal"}Now when you see db.name = "users_db" in your trace, you know you can find the same database in your metrics and logs. No more context-switching.
New to OpenTelemetry? Our What is OpenTelemetry guide covers the basics of how it captures and connects telemetry data.
Types of OpenTelemetry Semantic Conventions
OpenTelemetry defines semantic conventions across four areas. These help keep your telemetry consistent, so traces, logs, and metrics all carry the same context.
1. Trace conventions
Span names and attributes follow a standard format. Example:
{ "name": "postgresql query", "attributes": { "db.system": "postgresql", "db.name": "users_db", "db.operation": "SELECT", "db.statement": "SELECT * FROM users WHERE id = ?", "net.peer.name": "db.internal", "net.peer.port": 5432 }}This gives you clear, structured spans that actually describe what happened.
2. Metric conventions
Metric names and labels follow the same structure. Example:
{ "name": "db.client.connections.usage", "attributes": { "db.system": "postgresql", "db.name": "users_db", "state": "active" }}So you don’t end up with ten different names for the same metric across services.
3. Log conventions
Logs use the same attribute keys as traces and metrics. Example:
{ "message": "Query timeout exceeded", "attributes": { "db.system": "postgresql", "db.name": "users_db", "db.operation": "SELECT" }}Structured logs like this make it easier to filter, search, and link logs back to traces.
4. Resource conventions
These describe who emitted the telemetry—what service, what version, what environment.
{ "service.name": "user-service", "service.version": "1.2.3", "deployment.environment": "production"}They’re attached to every trace, log, and metric, so you always know the source.
The OpenTelemetry community recently marked database semantic conventions as stable, which means OTel-compatible tools like Last9 can now reliably use them for correlation across traces, metrics, and logs.
To understand how to get started with auto and manual instrumentation in OpenTelemetry and when to use each, check out our OpenTelemetry instrumentation guide.
Quick start: Add consistent attributes
To make it easier to correlate traces, logs, and metrics, start by applying OpenTelemetry semantic conventions across all three.
1. Add attributes to your database spans:
span.set_attributes({ "db.system": "postgresql", # Database type "db.name": "users_db", # Database name "db.operation": "SELECT" # The operation being run})2. Add the same attributes to your logs:
from opentelemetry.trace import get_current_spanimport loggingimport json
span = get_current_span()attrs = span.attributes
log = {    "event": "query_timeout",    "db.system": attrs.get("db.system"),    "db.name": attrs.get("db.name"),    "db.operation": attrs.get("db.operation")}
logging.info(json.dumps(log))
3. Use semantic labels in your metrics:
from prometheus_client import Gauge
active_connections = Gauge(    "postgres_active_connections",    "Active connections to Postgres",    ["db.system", "db.name"])
active_connections.labels(    db_system="postgresql",    db_name="users_db").set(95)
Now, when these attributes show up in your traces, logs, and metrics, any OpenTelemetry-compatible tool like Last9 or Grafana can correlate them automatically.
What Changes?
Before:
- Trace:
"database_call"takes 5 seconds - Metrics:
postgres_active_connections = 95 - Logs:
"Timeout on users_db"
None of the tools aligns by default. You spend hours matching IDs and assuming what’s connected.
After:
All signals share the same attributes:
db.system = "postgresql"db.name = "users_db"- Trace shows a slow query on
users_db - Metrics confirm pool saturation
- Logs show timeouts on the same DB
You identify the issue in minutes, not hours.
Now, let’s understand how you can instrument a Python app with OpenTelemetry and push it to Last9.
Instrument a Python App with OpenTelemetry and Send Telemetry to Last9
OpenTelemetry gives you telemetry data, traces, metrics, and logs. But to stitch those signals together and make sense of them, you need an observability backend that understands OpenTelemetry’s semantic conventions.
Last9 supports these conventions without any extra setup. So when your spans have attributes like db.system, db.name, and db.operation, our platform automatically correlates them, no custom mapping required.
We’ll set up a Flask app using Postgres and SQLAlchemy, instrument it with OpenTelemetry, and export traces to Last9 over OTLP/HTTP.
1. Install Dependencies
pip install flask sqlalchemy psycopg2-binarypip install opentelemetry-api \ opentelemetry-sdk \ opentelemetry-instrumentation \ opentelemetry-instrumentation-flask \ opentelemetry-instrumentation-sqlalchemy \ opentelemetry-exporter-otlpThis installs Flask and SQLAlchemy for building the app, plus the OpenTelemetry SDK, instrumentations for Flask and SQLAlchemy, and the OTLP exporter to send traces to Last9.
2. Create the Application
from flask import Flask, request, jsonifyfrom sqlalchemy import create_engine, Column, Stringfrom sqlalchemy.orm import sessionmaker, declarative_baseimport uuid
app = Flask(__name__)engine = create_engine('postgresql://username:admin@localhost:5432/db_name')Session = sessionmaker(bind=engine)Base = declarative_base()
class User(Base):    __tablename__ = 'users'    user_id = Column(String, primary_key=True)    first_name = Column(String)    last_name = Column(String)    email = Column(String)
This sets up a basic Flask app, connects to a Postgres database using SQLAlchemy, and defines a simple User model.
Add a few routes to interact with the database:
@app.route('/users')def get_users():    session = Session()    users = session.query(User).all()    return jsonify([{        'user_id': u.user_id,        'first_name': u.first_name,        'last_name': u.last_name,        'email': u.email    } for u in users])
@app.route('/add', methods=['POST'])def add_user():    data = request.json    session = Session()    user = User(        user_id=str(uuid.uuid4()),        first_name=data['first_name'],        last_name=data['last_name'],        email=data['email']    )    session.add(user)    session.commit()    return {'status': 'added'}
@app.route('/remove', methods=['POST'])def remove_user():    data = request.json    session = Session()    session.query(User).filter_by(user_id=data['user_id']).delete()    session.commit()    return {'status': 'deleted'}
if __name__ == '__main__':    app.run(port=5000)
These routes let you list, add, and delete users, triggering SQL queries that we’ll trace using OpenTelemetry.
3. Add OpenTelemetry Instrumentation
from opentelemetry import tracefrom opentelemetry.instrumentation.flask import FlaskInstrumentorfrom opentelemetry.instrumentation.sqlalchemy import SQLAlchemyInstrumentorfrom opentelemetry.sdk.trace import TracerProviderfrom opentelemetry.sdk.resources import Resourcefrom opentelemetry.exporter.otlp.proto.http.trace_exporter import OTLPSpanExporterfrom opentelemetry.sdk.trace.export import BatchSpanProcessor
from app import app, engine
Import everything needed for tracing and exporting, including the Flask app and SQLAlchemy engine.
resource = Resource.create({ "service.name": "user-crud-flask", "deployment.environment": "production", "db.system": "postgresql"})This sets up OpenTelemetry semantic attributes. These help Last9 correlate data across logs, metrics, and traces using common fields like db.system, service.name, etc.
trace.set_tracer_provider(TracerProvider(resource=resource))span_processor = BatchSpanProcessor(OTLPSpanExporter( endpoint="https://otlp.auth.<your-cluster>.last9.io/v1/traces", headers={"Authorization": "Bearer <your-token>"},))trace.get_tracer_provider().add_span_processor(span_processor)Configures the tracer to export spans to Last9 via OTLP/HTTP. Replace the endpoint and token with your actual Last9 credentials.
FlaskInstrumentor().instrument_app(app)SQLAlchemyInstrumentor().instrument(engine=engine)Enables automatic tracing for Flask and SQLAlchemy. Every HTTP request and DB query will now generate spans.
4. Run the App with Instrumentation
python -m otel_setupThis runs the app with tracing enabled. Any request you make will emit telemetry to Last9.
5. Generate Some Requests
curl http://localhost:5000/users
curl -X POST http://localhost:5000/add -H "Content-Type: application/json" \     -d '{"first_name":"Alice","last_name":"Smith","email":"alice@example.com"}'
These requests trigger HTTP and SQL operations that will show up as spans with attributes like db.operation, db.name, and http.route.
6. Visualize in Last9
Traces
In the Last9 UI, go to the Traces tab and search for your service name (user-crud-flask). You’ll see spans with semantic fields like:
db.system = postgresqldb.name = db_namedb.operation = SELECT
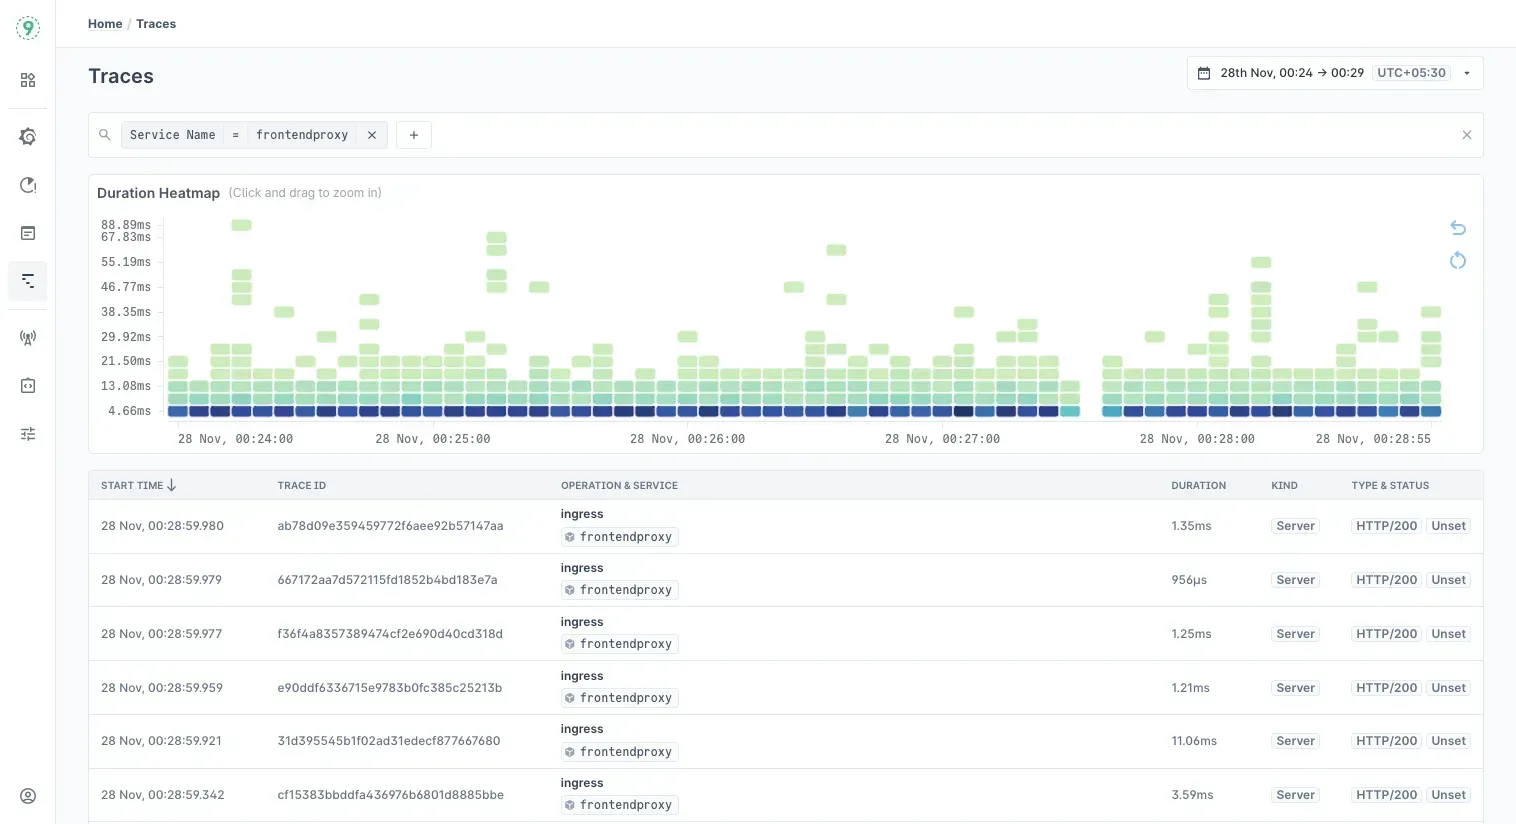
Use filters to drill into slow queries, endpoints with high latency, or failed DB calls.
You can explore traces in Last9 via the native UI, embedded Grafana Tempo, or raw SQL using ClickHouse.
Metrics
If you’re exporting metrics via OTLP, Last9 automatically processes them using OpenTelemetry semantic tags like db.operation, db.name, and service.name.
You’ll see breakdowns for common database metrics, such as query durations, active connections, and error rates, without needing to write PromQL or set up custom dashboards.
Metrics are correlated with traces and logs using shared attributes, so you can investigate issues across signals in one place. Just click into a span or log entry to explore related metric data.
Logs (via Logs Explorer and Grafana Loki)
Last9 gives you two ways to work with logs—both integrated into the same control plane:
- The Logs Explorer, built into the Last9 UI
- An embedded Grafana Loki interface, for teams already comfortable with LogQL
Both let you filter logs using OpenTelemetry semantic attributes like service.name, db.system, and db.operation, so logs, metrics, and traces all speak the same language.
Logs Explorer
The Logs Explorer is built for quick investigation:
- Filter logs by service, severity, database name, operation type, and more
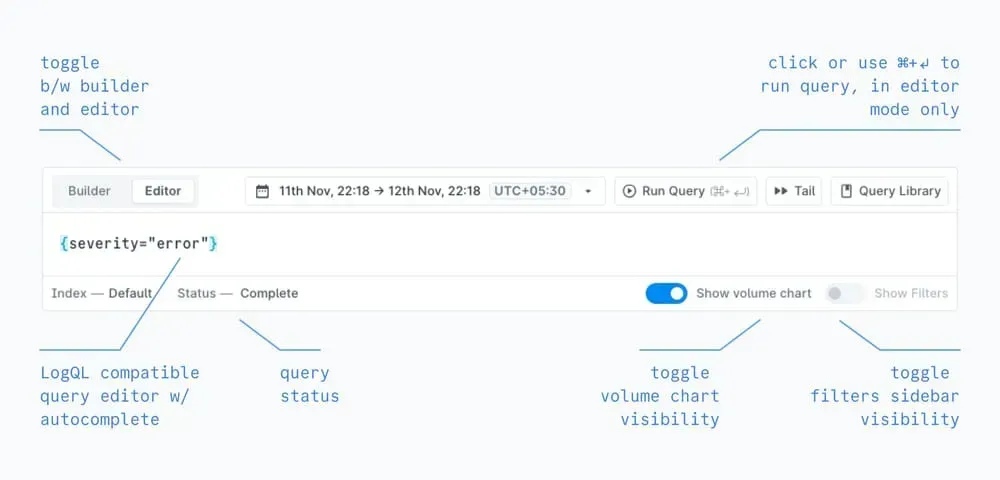
- Use Builder mode to create filters visually, no query language needed
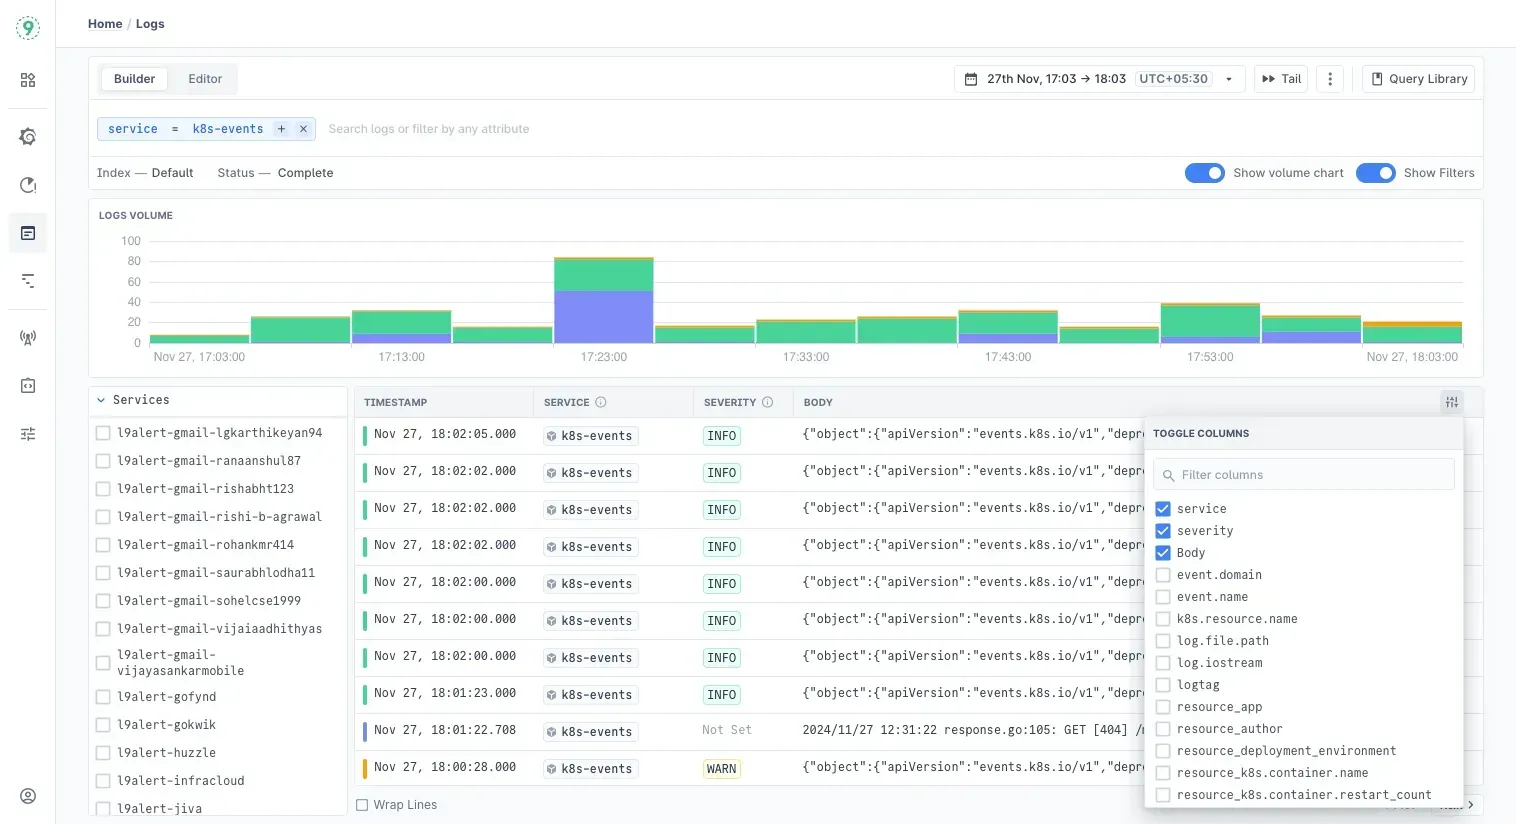
- Switch to Editor mode if you want to write LogQL queries directly
- Click on a log line to view full metadata and jump to related traces or metrics
- Live tail logs or drill into a specific time window with one click
Prefer Grafana?
If you’re more comfortable with LogQL, Last9 has an embedded Grafana Loki instance built in:
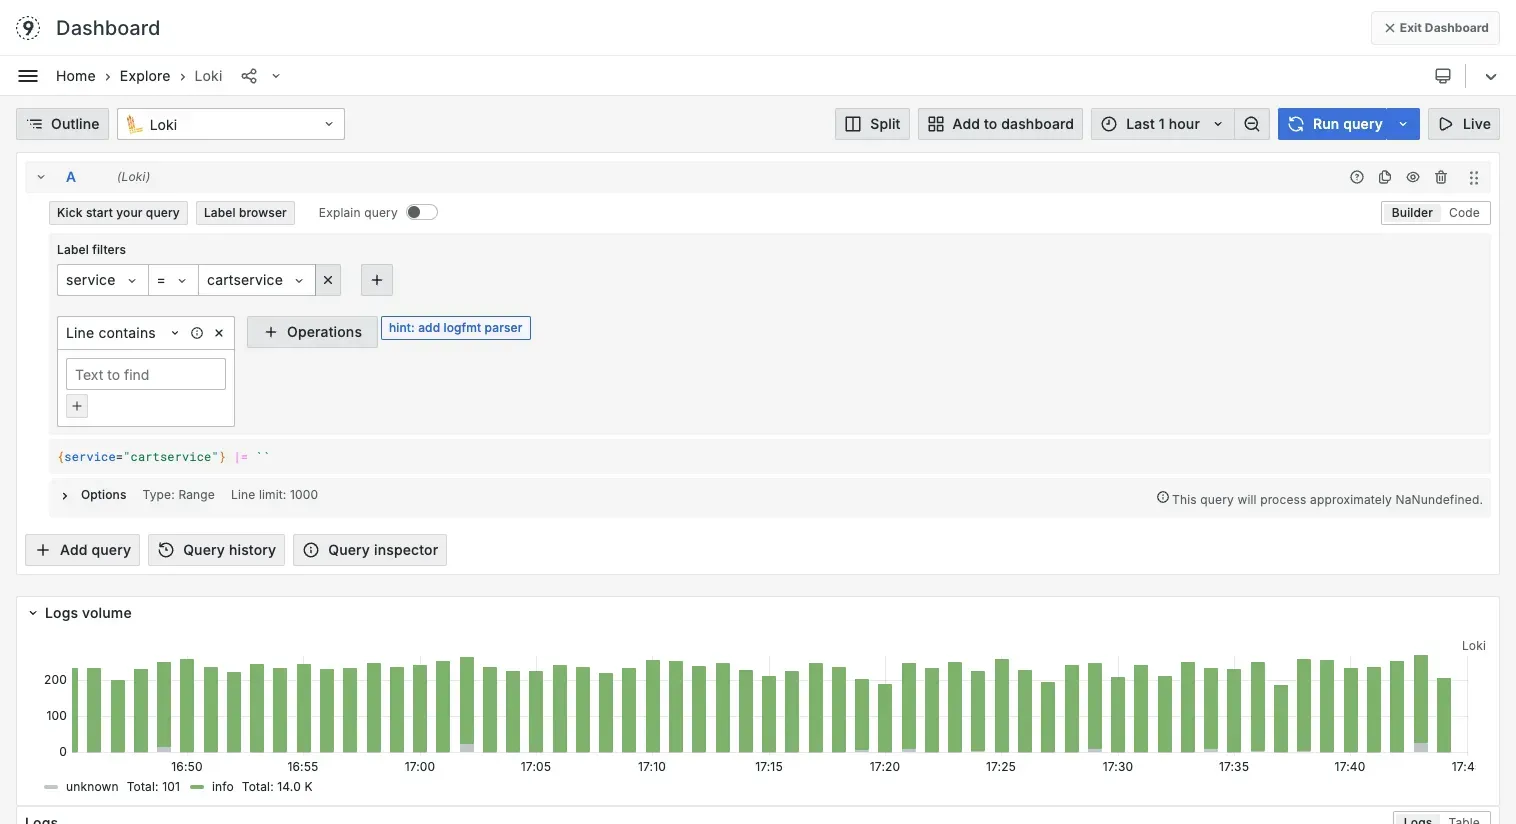
- Use the familiar Explore view
- Write queries or use the visual builder to generate them
- Build dashboards or save queries just like you would in your existing Grafana setup
Example:
{ "timestamp": "2025-07-08T14:03:00Z", "level": "ERROR", "message": "Query timeout on users_db", "service.name": "user-crud-flask", "db.system": "postgresql", "db.name": "db_name", "db.operation": "SELECT"}With a consistent log structure, you can now run focused queries like:
- Timeouts in your service
{service_name="user-crud-flask"} |= "Query timeout" - Slow SELECT queries
{db_operation="SELECT", db_system="postgresql"} |= "slow" - All logs from a specific DB
{db_name="db_name"}
Best Practices and Common Pitfalls
If you’re using OpenTelemetry to track database activity, getting the conventions right makes a big difference. Clean, consistent telemetry helps connect traces, logs, and metrics without extra work later.
1. Be intentional with instrumentation
- Use auto-instrumentation when it’s available
Most OpenTelemetry libraries already add the right attributes. Check if your database client is supported before writing custom code. - Don’t trace everything
Tracing every query adds noise and increases storage costs. Stick to important ones, slow queries, high-traffic paths, or anything critical to your app.
2. Keep attributes consistent
- Use values exactly as defined in the spec
For example, usepostgresql—notpostgres. A small mismatch can break filters and make correlation unreliable. - Avoid mixing custom and standard fields
Don’t send bothsql_queryanddb.statement. Choose the standard one. Mixing fields creates confusion and breaks queries.
3. Handle dynamic and sensitive data carefully
- Sanitize
db.statement
SQL statements might include sensitive info like user IDs or emails. If needed, strip values before exporting. - Replace user input with placeholders
Turninguser_id=123intouser_id=?helps reduce high-cardinality issues in metrics and logs.
4. Set the right resource attributes
- Always include
service.nameanddeployment.environment
These fields are essential for filtering and grouping telemetry across services. Don’t skip them. - Avoid leaving values empty or generic
Defaults likeunknown_serviceorproduction-defaultmake it harder to find and organize data later.
If you’re spending more on observability than you’re getting back, Last9 helps cut that by at least 30%—without sacrificing visibility. Book sometime with us!

