

Observability has come a long way from the days of juggling a mix of proprietary tools and dealing with vendor lock-in.
Today, the OpenTelemetry Protocol (OTLP) is leading the charge with its unified, vendor-neutral approach. If you’re looking to make sense of how OTLP fits into the modern observability landscape, you’re in the right place.
Let’s break down what makes OTLP important and how it can simplify your monitoring and tracing efforts.
What is OTLP?
OTLP is the standardized protocol for transmitting telemetry data in OpenTelemetry. It defines how traces, metrics, and logs are serialized and transported from your applications to backends or other components in your observability pipeline.
The key features that make OTLP stand out are:
- Language agnostic: OTLP can be implemented in any programming language, ensuring broad compatibility.
- Efficient binary serialization: This minimizes overhead in data transmission.
- Support for both gRPC and HTTP/protobuf transports: flexibility in implementation.
- Extensibility to accommodate: future telemetry types
- Vendor Neutral: Avoiding lock-in to any specific observability platform.
Also read: Collecting Kubernetes Logs with the OpenTelemetry Filelog Receiver!
Why should you care?
In my experience, adopting OTLP has several tangible benefits:
- Simplified instrumentation: With a standardized protocol, you can instrument your code once and send data to multiple backends or change backends when you need to.
- Future-proofing: As the observability landscape evolves, OTLP’s extensibility ensures your instrumentation remains relevant.
- Improved interoperability: OTLP makes it easier to integrate different observability tools and services.
- Cost-effective: The ability to switch between vendors without re-instrumenting can lead to significant cost savings.
The OTLP Data Model
At its core, OTLP defines a structured data model for telemetry data. Let’s break it down:
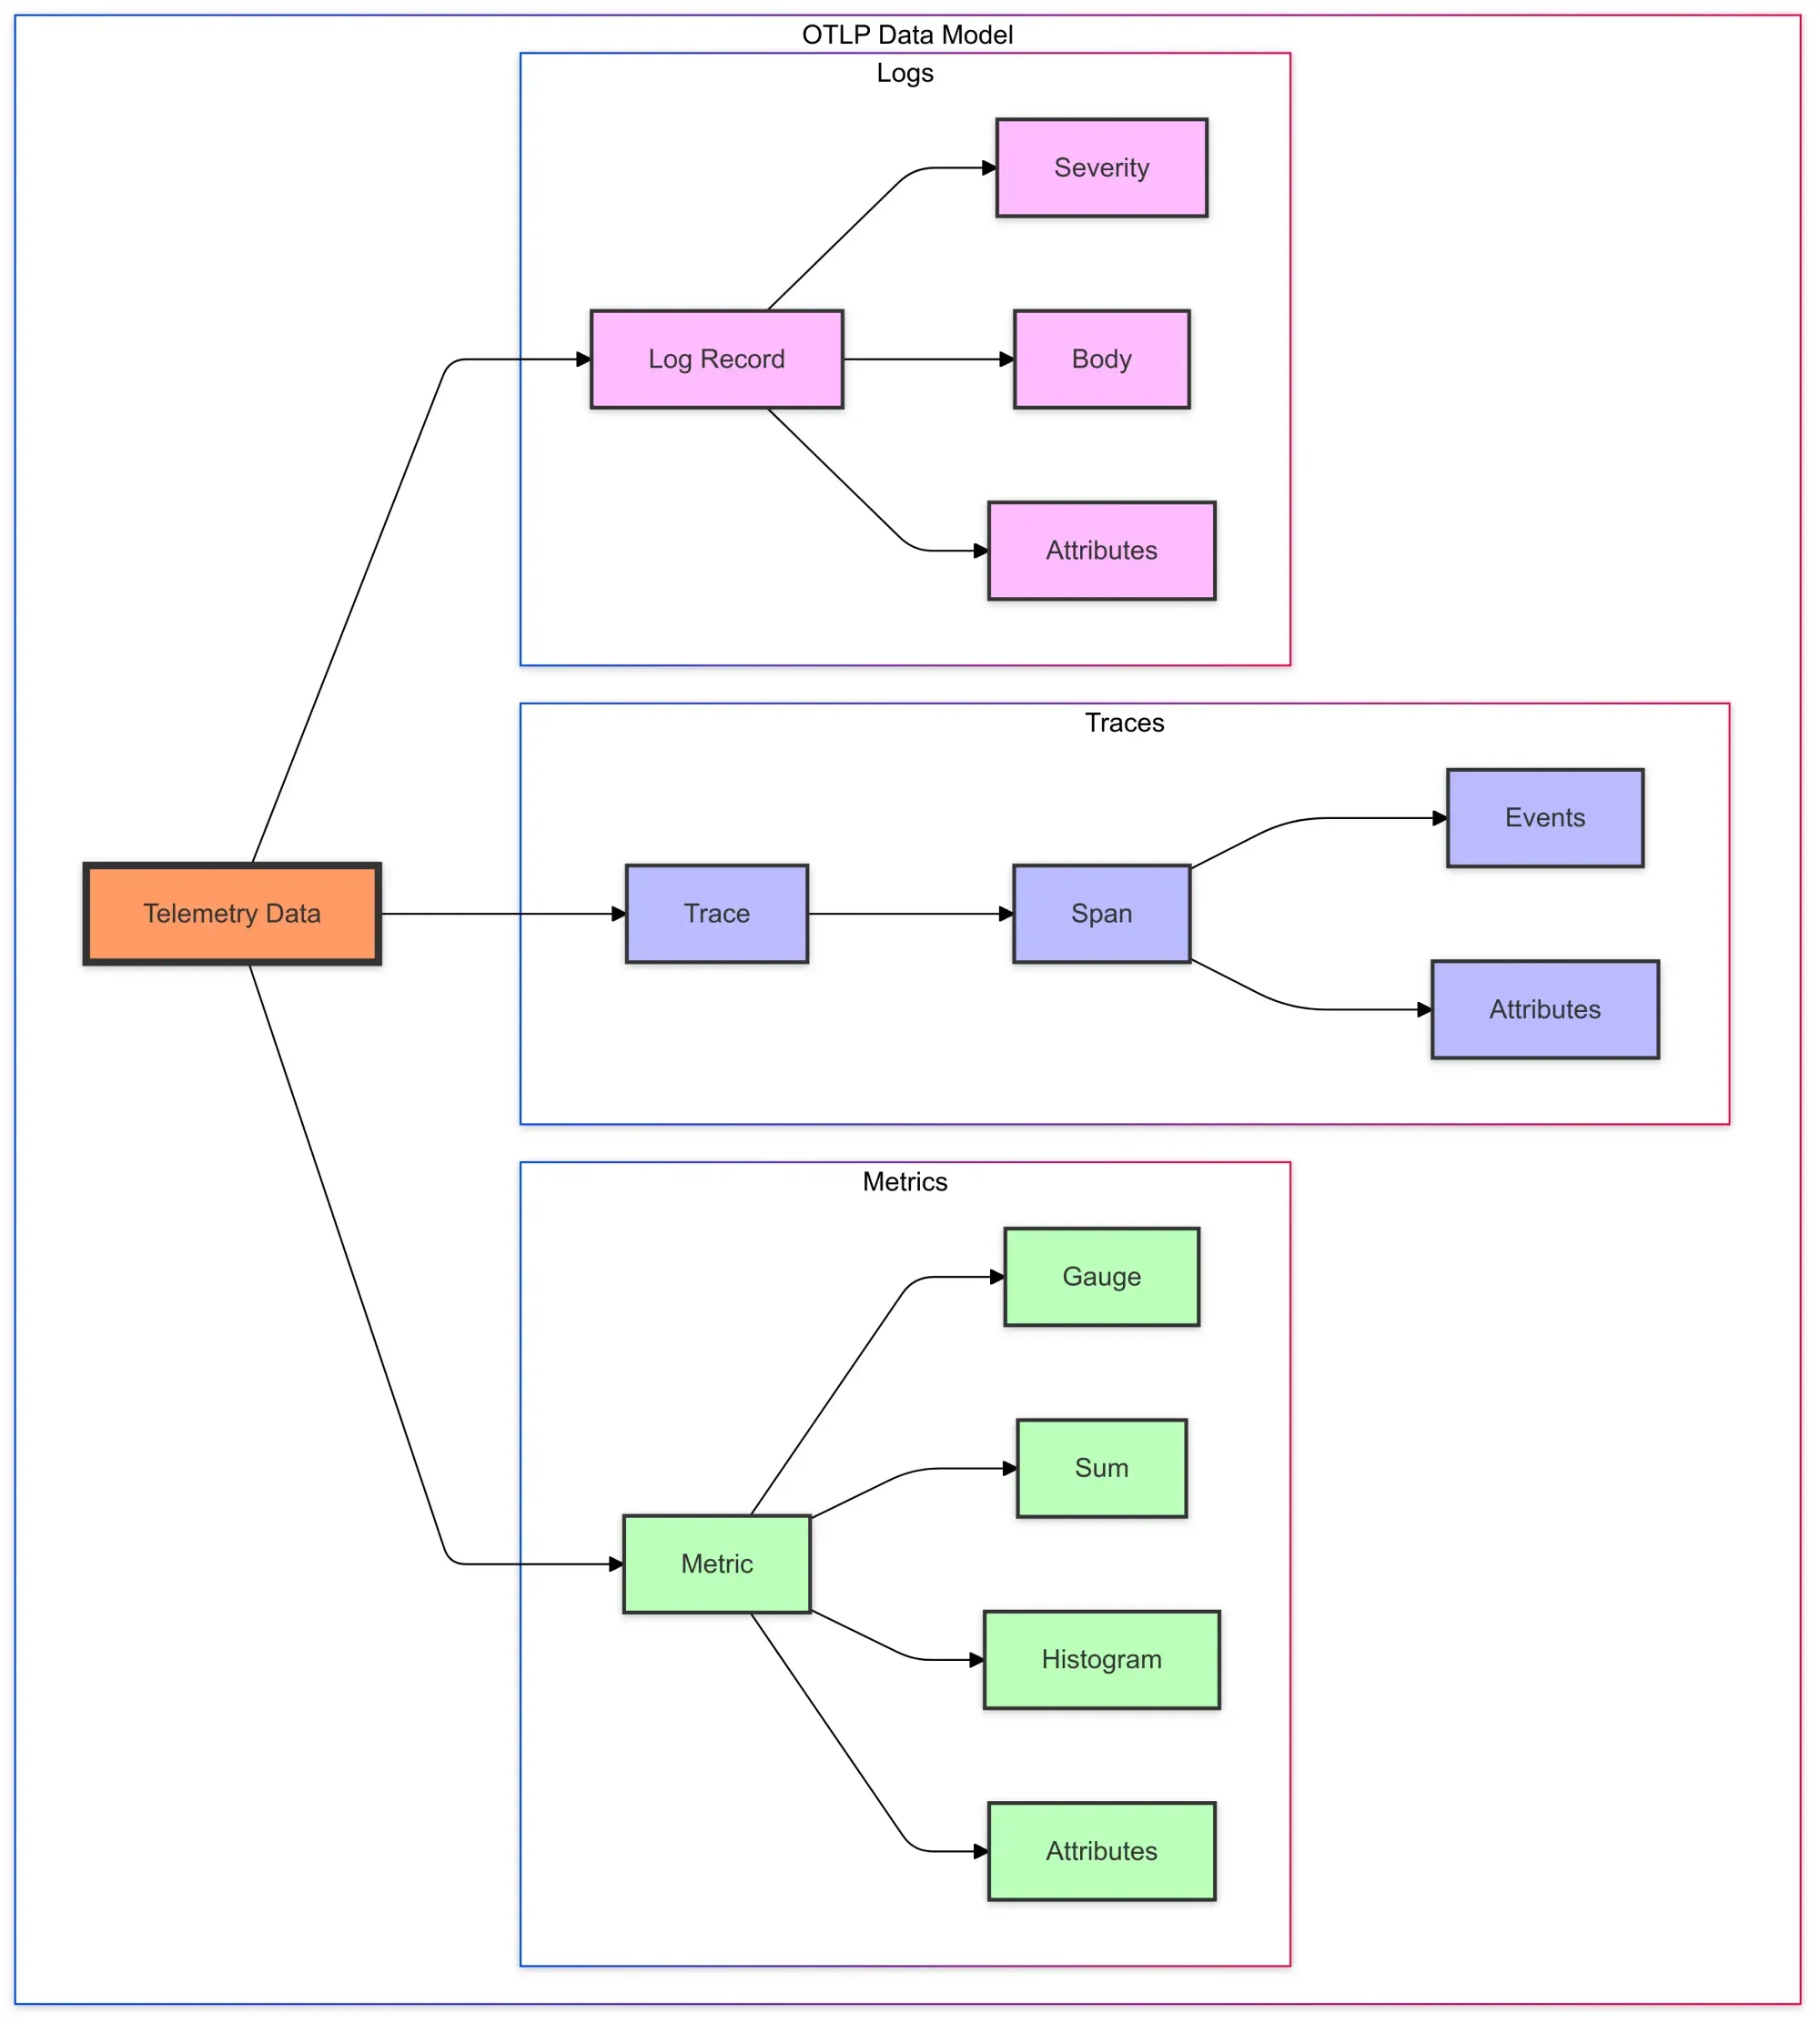
Traces
Traces in OTLP are designed to capture the flow of a request through a distributed system. Each trace is composed of one or more spans, which represent individual operations or units of work.
Here’s a simplified view of the span structure:
message Span { string trace_id = 1; string span_id = 2; string parent_span_id = 3; string name = 4; SpanKind kind = 5; uint64 start_time_unix_nano = 6; uint64 end_time_unix_nano = 7; repeated KeyValue attributes = 8; repeated Event events = 9; repeated Link links = 10; Status status = 11;}- attributes are key-value pairs for additional context
- events represent time-stamped events within the span
- links allow associating spans from different traces
Key concepts in OTLP traces:
- Span Context: This includes the trace ID, span ID, and trace flags. It’s used to correlate spans across service boundaries. trace_id and span_id are unique identifiers parent_span_id allows for building the trace tree
- Span Kind: Indicates the role of the span (e.g., SERVER, CLIENT, PRODUCER, CONSUMER). SpanKind
- Attributes: Key-value pairs that provide additional context about the span. attributes
- Events: Time-stamped annotations within a span, useful for capturing points of interest. events
- Links: References to related spans that don’t form a parent-child relationship. links
Here’s an example of how you might create a span in Python:
from opentelemetry import tracefrom opentelemetry.sdk.trace import TracerProviderfrom opentelemetry.sdk.trace.export import BatchSpanProcessorfrom opentelemetry.exporter.otlp.proto.grpc.trace_exporter import OTLPSpanExporter
# Create a tracer providertracer_provider = TracerProvider()
# Set up OTLP exporter with gRPC endpointotlp_exporter = OTLPSpanExporter(endpoint="localhost:4317")
# Set up batch span processorspan_processor = BatchSpanProcessor(otlp_exporter)tracer_provider.add_span_processor(span_processor)
# Register the tracer provider globallytrace.set_tracer_provider(tracer_provider)
# Get tracer for this moduletracer = trace.get_tracer(__name__)
with tracer.start_as_current_span("my_span") as span: span.set_attribute("http.method", "GET") span.add_event("started processing") # Your business logic here span.add_event("finished processing")Metrics
OTLP metrics are designed to capture quantitative data about the behavior and performance of your system. There are several types of metrics supported:
- Gauge: A single value that can go up or down
- Sum: A cumulative value that can only increase
- Histogram: A distribution of values
Here’s a simplified metric structure:
message Metric { string name = 1; string description = 2; string unit = 3; oneof data { Gauge gauge = 4; Sum sum = 5; Histogram histogram = 6; }}Here’s an example of creating a counter metric in Python:
from opentelemetry import metricsfrom opentelemetry.sdk.metrics import MeterProviderfrom opentelemetry.sdk.metrics.export import PeriodicExportingMetricReaderfrom opentelemetry.exporter.otlp.proto.grpc.metric_exporter import OTLPMetricExporter
metric_exporter = OTLPMetricExporter(endpoint="localhost:4317")reader = PeriodicExportingMetricReader(metric_exporter)provider = MeterProvider(metric_readers=[reader])metrics.set_meter_provider(provider)
meter = metrics.get_meter(__name__)counter = meter.create_counter("requests", description="Total requests")
def process_request():    # Your request processing logic here    counter.add(1)
Logs
OTLP logs are designed to capture discrete events and messages from your application. They can be correlated with traces and metrics to provide a complete picture of your system’s behavior.
message LogRecord { uint64 time_unix_nano = 1; uint32 severity_number = 2; string severity_text = 3; string body = 4; repeated KeyValue attributes = 5; uint32 dropped_attributes_count = 6; uint64 flags = 7; string trace_id = 8; string span_id = 9;}Note how logs can be associated with traces and spans, enabling powerful correlation capabilities.
Key components of an OTLP log record:
- Timestamp: When the log was created.
- Severity: The importance or urgency of the log.
- Body: The main content of the log message.
- Attributes: Additional structured data about the log event.
- Trace and Span IDs: For correlating logs with trace data.
Here’s an example of logging in Python with OpenTelemetry:
import loggingfrom opentelemetry.instrumentation.logging import LoggingInstrumentor
# Set up the OpenTelemetry logging instrumentationLoggingInstrumentor().instrument(set_logging_format=True)
# Create a loggerlogger = logging.getLogger(__name__)
# Log a messagelogger.info("Processing started", extra={"customer_id": "12345"})
By using these OTLP data types and formats consistently across your services, you can build a comprehensive and correlated view of your system’s behavior and performance.
OTLP vs. Other Telemetry Protocols: A Quick Comparison
| Feature | OTLP | OpenTracing | OpenCensus |
|---|---|---|---|
| Vendor Neutrality | Yes | Yes | Yes |
| Data Types | Supports traces, metrics, logs | Primarily traces | Traces, metrics, logs |
| Transport | gRPC, HTTP/protobuf | gRPC, HTTP | gRPC, HTTP |
| Extensibility | High, supports future telemetry types | Limited | High, supports both metrics and traces |
| Adoption | Growing, CNCF backed | Widely adopted but being superseded by OTLP | Less adoption than OTLP |
| Integration | Easy with various observability backends | Requires integration with backends | Native integration with many platforms |
| Community Support | Strong, with continuous development | Community-driven, though transitioning | Strong, now part of OpenTelemetry |


Transport Options: gRPC vs HTTP/protobuf
OTLP supports two transport options: gRPC and HTTP/protobuf. Let’s compare them:
gRPC
import (    "google.golang.org/grpc"    collectorprotov1 "go.opentelemetry.io/proto/otlp/collector/trace/v1")
func sendTracesViaGRPC() error {    conn, err := grpc.Dial("localhost:4317", grpc.WithInsecure())    if err != nil {        return err    }    defer conn.Close()
    client := collectorprotov1.NewTraceServiceClient(conn)
    // Create and send ExportTraceServiceRequest    // ...}
HTTP/protobuf
import (    "bytes"    "net/http"    collectorprotov1 "go.opentelemetry.io/proto/otlp/collector/trace/v1"    "google.golang.org/protobuf/proto")
func sendTracesViaHTTP() error {    // Create a request object    req := &collectorprotov1.ExportTraceServiceRequest{        // Populate with trace data    }
    // Marshal the request into a protobuf message    data, err := proto.Marshal(req)    if err != nil {        return err    }
    // Send the request to the OTLP endpoint via HTTP    resp, err := http.Post("http://localhost:4318/v1/traces", "application/x-protobuf", bytes.NewReader(data))    if err != nil {        return err    }    defer resp.Body.Close()
    // Handle the response (you can add handling logic here)    // ...
    return nil}
In my experience, gRPC is generally more efficient and supports streaming, while HTTP/protobuf is easier to implement in environments with existing HTTP infrastructure.
Implementing OTLP in Your Project
Implementing OTLP in your project involves several steps. Here’s a general guide based on my experience:
- Choose your SDK: OpenTelemetry provides SDKs for various languages. Choose the one that matches your project’s primary language.
- Install dependencies: Add the OpenTelemetry SDK and OTLP exporter to your project. For example, in a Python project:
pip install opentelemetry-api opentelemetry-sdk opentelemetry-exporter-otlp- Initialize the SDK: Set up the OpenTelemetry SDK in your application’s entry point. This typically involves creating a trace provider, metric provider, and configuring exporters.
- Instrument your code: Add calls to the OpenTelemetry API throughout your code to create spans, record metrics, and emit logs.
- Configure the OTLP exporter: Set up the OTLP exporter to send your telemetry data to your chosen backend. This could be the OpenTelemetry Collector or a vendor-specific endpoint.
A tutorial for instrumenting your Go application with open telemetry that you can follow.
Best Practices for OTLP Implementation
- Use Batching: Group multiple telemetry items into a single request to reduce network overhead.
- Implement Retry Logic: Network issues happen. Implement exponential backoff for failed requests.
- Compress Data: Enable compression to reduce bandwidth usage, especially for large payloads.
- Use TLS: Always secure your OTLP connections in production environments.
- Monitor OTLP Endpoints: Keep an eye on the health and performance of your OTLP receivers.
- Use Semantic Conventions: Adhere to OpenTelemetry’s semantic conventions when naming and tagging your telemetry data. This ensures consistency and improves interoperability.
- Correlate Data Types: Use trace IDs and span IDs consistently across traces, metrics, and logs to enable powerful correlation capabilities.
Common Pitfalls and Troubleshooting
In my journey with OTLP, I’ve encountered several common issues. Here’s how to avoid or resolve them:
- Version Mismatch: Ensure your OTLP client and server versions are compatible. Mismatches can lead to subtle data loss or formatting issues.
Solution: Always check the compatibility matrix when upgrading components of your observability pipeline.
- Payload Size Limits: Be aware of any size limits on your OTLP receiver and adjust batching accordingly.
Solution: Monitor the size of your OTLP payloads and adjust batch sizes if you’re hitting limits. Some receivers allow you to configure these limits.
- Serialization Errors: Double-check that all required fields are populated in your OTLP messages.
Solution: Use the OpenTelemetry SDK’s built-in validation where available, and add your own checks for critical fields.
- Network Issues: OTLP traffic may be blocked by firewalls or network policies.
Solution: Use tools like tcpdump or Wireshark to diagnose connectivity problems. Ensure your network allows traffic on the OTLP ports (typically 4317 for gRPC and 4318 for HTTP).
- Resource Exhaustion: High-volume telemetry can be resource-intensive
Solution: Monitor CPU and memory usage of OTLP clients and servers. Implement sampling or filtering if resource usage becomes problematic.
- Data Loss During Service Restarts: Ensure in-memory buffers are flushed before your service shuts down.
Solution: Implement proper shutdown hooks that flush telemetry data before exit.
OTLP in the OpenTelemetry Ecosystem
While we’ve focused on OTLP itself, it’s important to understand its role in the broader OpenTelemetry ecosystem. OTLP is the glue that binds together various components:
- Instrumentation Libraries: These generate telemetry data in your applications. While they don’t directly use OTLP, they produce data that are compatible with OTLP’s data model.
- OpenTelemetry SDKs: The SDKs provide the runtime implementation for telemetry collection. They offer OTLP exporters that serialize the collected data into OTLP format.
- OpenTelemetry Collector: This is a vendor-agnostic way to receive, process, and export telemetry data. It can receive data in OTLP format and export it in OTLP or other formats.
- Backends: Many observability backends now support ingesting data directly in OTLP format, simplifying the telemetry pipeline.
Here’s a typical flow of data using OTLP:
[Your Application] (with OTel SDK) -> OTLP -> [OpenTelemetry Collector] -> OTLP -> [Observability Backend]The power of OTLP lies in its ability to standardize this entire pipeline. By using OTLP, you can:
- Switch between different collectors or backends without changing your application code.
- Use a single protocol for all types of telemetry data (traces, metrics, and logs).
- Utilize the growing ecosystem of tools and services that support OTLP.
In my experience, this flexibility has been invaluable. For instance, we were able to switch from a commercial observability platform to a self-hosted solution with minimal changes to instrumentation, thanks to OTLP!
FAQs
Q: What is OpenTelemetry Protocol (OTLP)?
A: OTLP is a standardized protocol used to transmit telemetry data, including traces, metrics, and logs, from your applications to observability backends. It’s designed to be vendor-neutral and language-agnostic.
Q: How does OTLP simplify observability?
A: OTLP allows you to instrument your code once and send data to multiple backends, making it easier to switch vendors or integrate different tools. Its flexibility and future-proofing capabilities also ensure your monitoring setup remains relevant as technologies evolve.
Q: What are the main components of OTLP?
A: OTLP includes traces, metrics, and logs. Traces capture the flow of requests through a system, metrics provide quantitative performance data, and logs record discrete events and messages.
Q: What transport options does OTLP support?
A: OTLP supports gRPC and HTTP/protobuf. gRPC is generally more efficient and supports streaming, while HTTP/protobuf is easier to implement in existing HTTP environments.
Q: How can I implement OTLP in my project?
A: Start by choosing the appropriate OpenTelemetry SDK for your programming language. Install the necessary dependencies, initialize the SDK, instrument your code, and configure the OTLP exporter to send data to your chosen backend.
Q: What are some best practices for using OTLP?
A: Use batching to reduce network overhead, implement retry logic for failed requests, compress data to save bandwidth, secure connections with TLS, monitor OTLP endpoints, and use semantic conventions for consistency.
Q: What are common pitfalls with OTLP and how can I avoid them?
A: Common issues include version mismatches, payload size limits, serialization errors, network issues, and resource exhaustion. To avoid these, ensure compatibility between components, monitor payload sizes, use proper validation, check network configurations, and manage resources effectively.
Q: How does OTLP fit into the OpenTelemetry ecosystem?
A: OTLP serves as the protocol for transmitting telemetry data across the OpenTelemetry ecosystem. It integrates with instrumentation libraries, SDKs, the OpenTelemetry Collector, and observability backends, facilitating a standardized and flexible observability pipeline.
Q: Where can I find more information about OTLP?
A: You can explore the official OpenTelemetry Protocol Specification, check out the OpenTelemetry Cheat Sheet, and visit the CNCF OpenTelemetry Project for more details on OpenTelemetry and its components.
Further Reading
To deepen your understanding of OTLP and its ecosystem, here are some valuable resources:
- OpenTelemetry Protocol Specification: The official specification for OTLP.
- OpenTelemetry Cheat Sheet: A comprehensive collection of OpenTelemetry examples, configurations, and best practices for various scenarios, involving Kubernetes.
- CNCF OpenTelemetry Project: Overview of the OpenTelemetry project within the Cloud Native Computing Foundation.
- OpenTelemetry Collector: Deep dive into the OpenTelemetry Collector, which heavily utilizes OTLP.
- W3C Trace Context Specification: Understanding this spec can provide valuable context on distributed tracing, which OTLP implements.

