In modern distributed systems, it's crucial to understand what's happening inside your applications to maintain performance and reliability.
OpenTelemetry events help with this by capturing timestamped data whenever something important occurs. Unlike logs, which provide a broader overview, or metrics, which summarize data, events focus on specific actions.
They are essential for observability, providing the context needed to identify issues, understand workflows, and improve system performance.
In this blog, we'll talk about OpenTelemetry events, highlight the key differences between logs and events, and more.
What are OpenTelemetry Events?
Events are discrete, time-stamped occurrences that signify specific actions or state changes within an application. They provide granular insights into the application's behavior, capturing details such as user interactions, system state transitions, or significant processing milestones.
Each event typically includes attributes like timestamps, event types, and metadata that offer context about the occurrence.
Example:
In an e-commerce application, an event might be recorded when a user places an order:
- Timestamp: When the order was placed.
- Event Type: Order Placed
- Attributes:
- user_id: Unique identifier of the user.
- order_id: Unique identifier of the order.
- total_amount: Total value of the order.
- payment_status: Status of the payment (e.g., pending, completed).

Metrics, Events, Logs and Traces
Logs in OpenTelemetry
Logs are records that capture detailed information about the application's state and behavior over time. They can be structured or unstructured and often include error messages, warnings, or informational entries that are vital for debugging and understanding application flow.
Logs are typically timestamped and may contain various attributes to provide context.
Example:
Continuing with the e-commerce scenario, a log entry might be generated when an error occurs during payment processing:
- Timestamp: When the error occurred.
- Log Level: ERROR
- Message: Failed to process payment for order #12345
- Attributes:
- order_id: 12345
- user_id: 67890
- error_code: PAYMENT_FAILURE
- error_message: Insufficient funds

What is Opentelemetry? An Explain It Like I'm 5
Key Differences Between Events and Logs
Structure
- Events: Often structured with predefined attributes, providing specific context about a particular occurrence.
- Logs: Can be either structured or unstructured, offering a broader narrative of the application's operations.
Temporal Aspects
- Events: Are instantaneous, capturing a specific moment in time.
- Logs: May represent a duration, such as the time taken to execute a function, or capture the state over a period.
Granularity
- Events: Provide fine-grained insights, often used to understand specific actions within a trace.
- Logs: Offer a higher-level overview, useful for understanding broader application behavior and diagnosing issues.
Query and Analysis Capabilities
- Events: Typically analyzed within the context of traces, aiding in pinpointing specific issues in a workflow.
- Logs: Are searchable and can be aggregated to identify patterns, trends, or anomalies over time.

Ingest OpenTelemetry metrics with Prometheus natively
Use Cases for Events and Logs
Events
- Tracking user interactions, such as button clicks or form submissions.
- Monitoring state changes, like a service starting or stopping.
- Recording significant milestones in processing, such as completing a transaction.
Logs
- Debugging errors and exceptions within the application.
- Auditing system access and usage patterns.
- Monitoring performance metrics, like response times or resource utilization.
For Comprehensive Observability
Utilizing both events and logs in tandem provides a holistic view of an application's performance.
Events offer detailed insights into specific actions, while logs provide context and narrative around those actions. This combination enables more effective debugging, performance monitoring, and system auditing.
What is the Event Data Model in OpenTelemetry
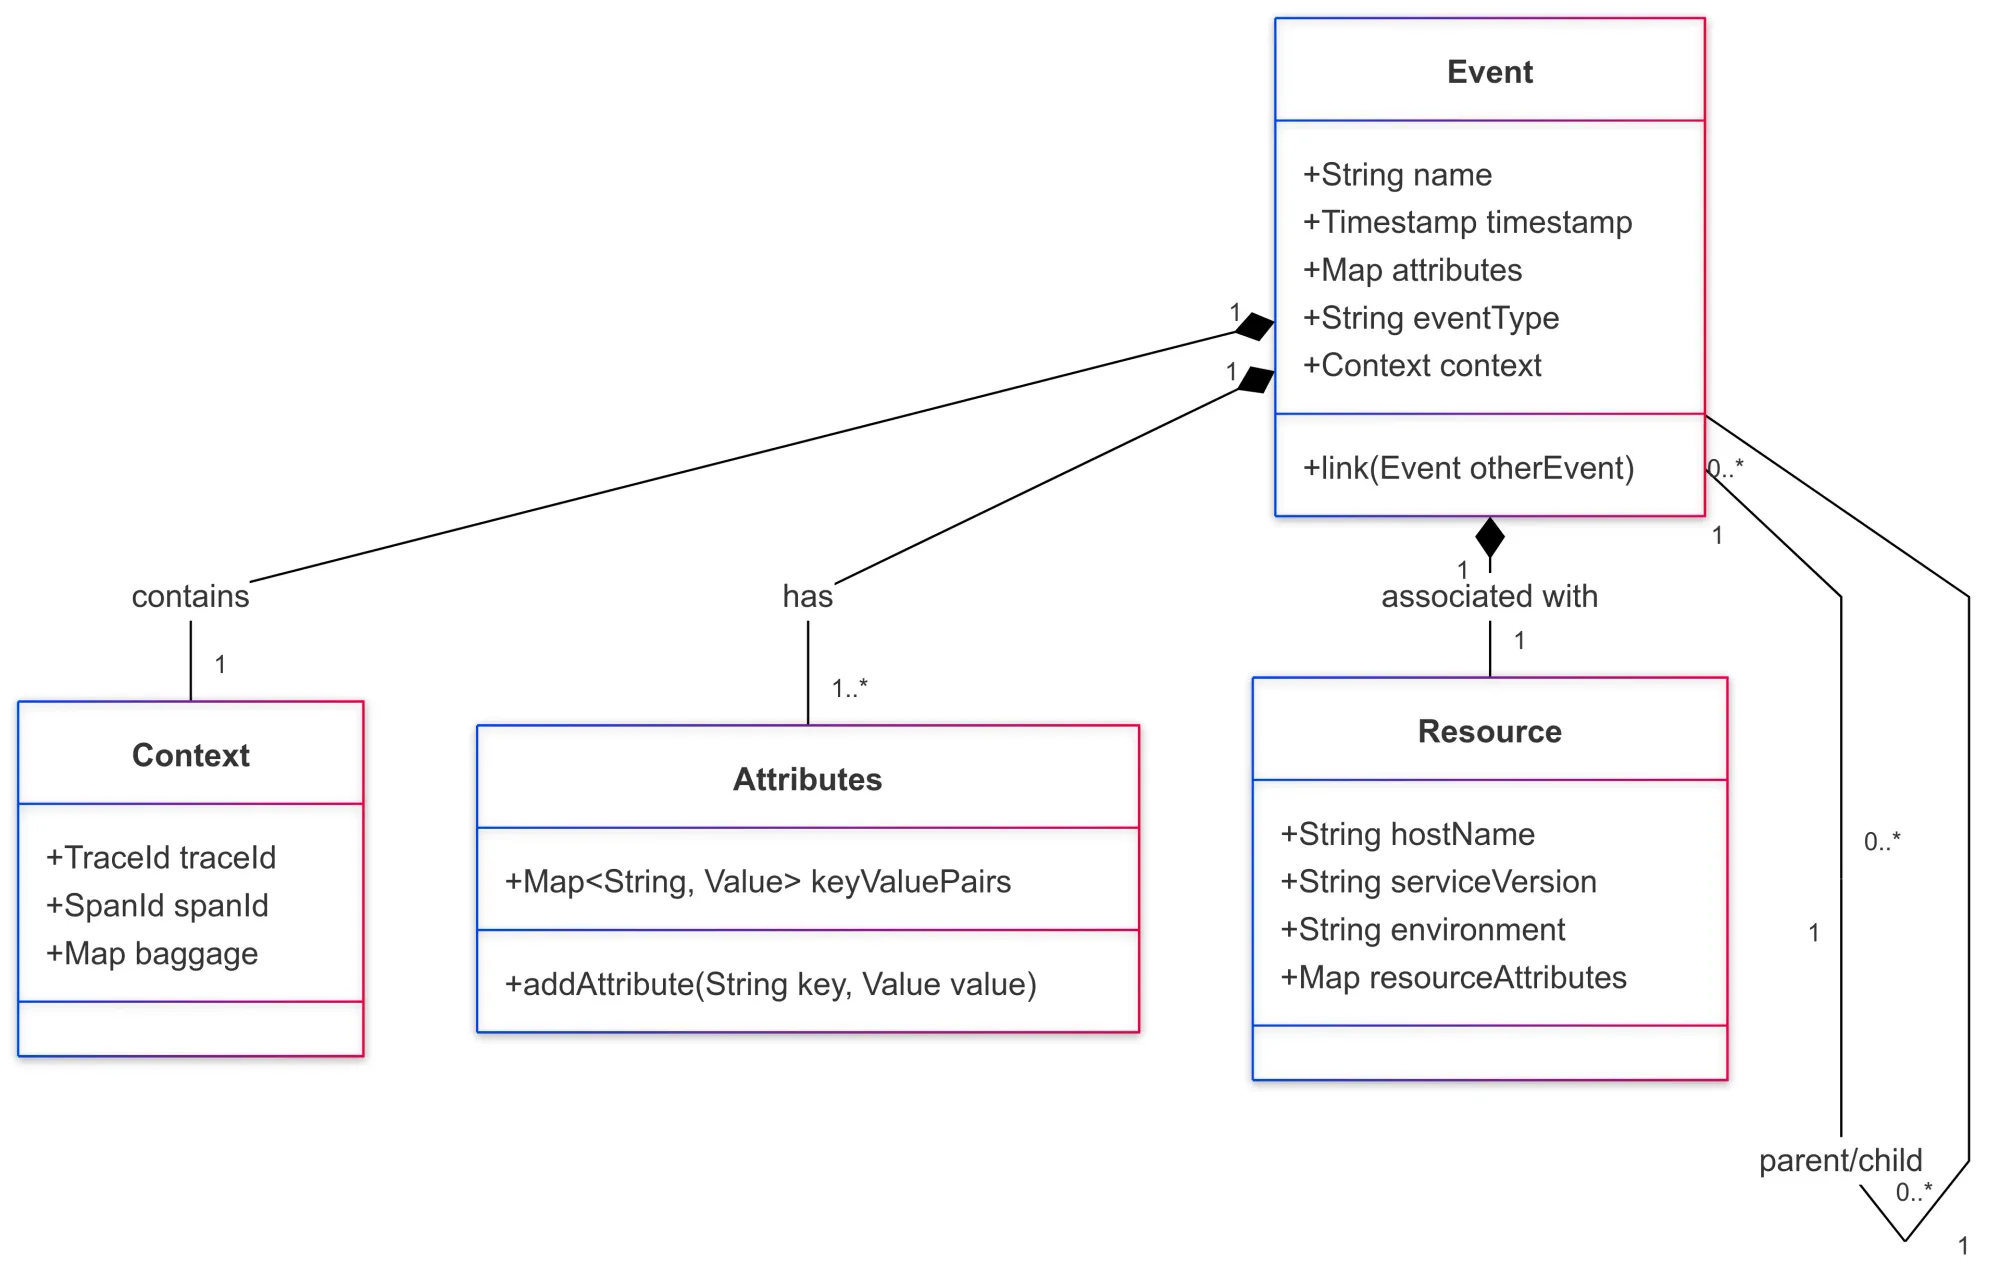
The Event Data Model in OpenTelemetry is a structured approach to capturing and organizing event data.
Events are designed to represent significant moments or state changes in your system, and their data model ensures these are stored in a consistent and queryable manner.
Here's how the Event Data Model in OpenTelemetry is structured:

1. Core Components of an Event
Each event consists of several core attributes, providing detailed context about what happened, when it happened, and any relevant metadata.
- Name: A descriptive identifier for the event, such as
user_logged_inororder_processed. This name should be meaningful and easily understandable. - Timestamp: The exact time when the event occurred. This is typically recorded with high precision to enable accurate correlation with other telemetry data.
- Attributes: A set of key-value pairs that provide additional context about the event. Attributes can include metadata like user IDs, transaction IDs, or service-specific details.
- Event Type: Defines the nature of the event, such as INFO, ERROR, or DEBUG. This helps categorize events for easier analysis and filtering.

What is the OpenTelemetry Collector and How Does It Work?
2. Event Hierarchies and Relationships
Events can be linked hierarchically to represent complex workflows or processes. For instance:
- A parent event might represent a high-level action (e.g.,
Checkout Process Started). - Child events can represent granular steps in the process (e.g.,
Payment Initiated,Payment Successful).
This structure allows for tracing event chains to understand dependencies and pinpoint issues.
3. Contextual Information
Events in OpenTelemetry include context propagation data, enabling seamless correlation across distributed systems. Contextual information ensures that:
- Events are associated with specific traces or spans for a complete picture of system behavior.
- Developers can track events across service boundaries.
4. Attributes vs. Metadata
While attributes provide immediate details about the event, metadata might include additional information about the environment where the event occurred, such as:
- Host details: IP address, hostname.
- Application data: Version, deployment environment (e.g., staging, production).
- Resource identifiers: Cloud provider, region, or cluster ID.

Advanced OpenTelemetry: Sampling, Filtering, and Enrichment
5. Storage and Query Optimization
OpenTelemetry encourages storing events in structured formats to support efficient querying. Examples include JSON or protocol buffers, enabling developers to easily filter, search, and analyze events based on attributes or timestamps.
EventLoggerProvider and Its Role in OpenTelemetry
The EventLoggerProvider is a core component in OpenTelemetry, acting as the central mechanism for creating and managing event loggers.
It plays a pivotal role in capturing and recording events within an application, ensuring a consistent and structured approach to event logging.
Here’s a detailed breakdown of its functionality and significance:
1. What is the EventLoggerProvider?
The EventLoggerProvider is the entry point for creating EventLogger instances in OpenTelemetry.
An EventLogger is responsible for generating and recording events associated with specific actions or state changes in an application. The EventLoggerProvider ensures:
- A standardized way to create and manage loggers.
- Centralized control over how events are captured and processed.
2. Role of EventLoggerProvider in Observability
- Centralized Event Management: The EventLoggerProvider acts as the hub for all event-logging activities, ensuring that events from different parts of an application are captured consistently.
- Traceability Across Services: Events logged through an EventLoggerProvider are inherently tied to the broader OpenTelemetry context, including traces and spans. This makes it easier to correlate events across distributed systems.
- Customization and Configuration: The provider allows developers to configure how events are processed, stored, and exported. For instance, you can set specific exporters to send events to a preferred backend or analytics platform.
- Facilitates Structured Logging: Using the EventLoggerProvider ensures that all events follow a structured format, including attributes, timestamps, and other metadata.

OpenTelemetry Protocol (OTLP): A Deep Dive into Observability
Key Features of EventLoggerProvider
1. Context Propagation
Automatically integrates with the OpenTelemetry context to include trace IDs, span IDs, and other contextual metadata in events.
2. Thread-Safe Design
The provider is designed to be thread-safe, enabling concurrent logging from multiple threads or services without conflict.
3. Integration with Exporters
Works seamlessly with exporters to send logged events to storage or observability platforms such as Elasticsearch, Prometheus, or custom backends.
Example:
Here’s a quick example of how the EventLoggerProvider is used in an application:
from opentelemetry.sdk.logs import EventLoggerProvider
from opentelemetry.sdk.logs.export import ConsoleLogExporter, SimpleLogRecordProcessor

# Create an instance of EventLoggerProvider
provider = EventLoggerProvider()

# Add a processor and exporter
processor = SimpleLogRecordProcessor(ConsoleLogExporter())
provider.add_log_record_processor(processor)

# Get an EventLogger from the provider
event_logger = provider.get_logger(name="order-service")

# Log an event
event_logger.emit(
    event="order_placed",
    attributes={
        "order_id": "12345",
        "user_id": "67890",
        "amount": 99.99,
        "payment_status": "completed"
    }
)
Benefits of Using EventLoggerProvider
1. Scalability
Handles events efficiently across high-traffic applications, ensuring minimal overhead.
2. Flexibility
Supports custom processors and exporters, allowing teams to tailor event handling to their specific requirements.
3. Improved Debugging
Consistent logging of events with rich metadata enables developers to quickly identify and troubleshoot issues.
Best Practices for Optimizing OpenTelemetry Events and Logs
- Consistent Instrumentation: Make sure events and logs are consistently captured across all services for cohesive insights.
- Structured Logging: Use structured logs whenever possible to make it easier to query and analyze the data.
- Contextual Information: Add relevant context to both events and logs, like user IDs or transaction IDs, to help correlate different data points effectively.

Conclusion
OpenTelemetry events provide valuable insights into your system, and when combined with logs, they offer a complete view that enhances debugging, monitoring, and auditing.
With OpenTelemetry’s tools like the EventLoggerProvider, you can efficiently capture and analyze events to better understand your application's performance.
If you're already using OpenTelemetry, switching to Last9 is easy. Last9 simplifies observability by bringing together metrics, logs, and traces in one platform.

It integrates well with OpenTelemetry, offering teams a clear view of their systems and simplifying troubleshooting, alert management, and performance monitoring, especially for distributed systems and microservices.
Schedule a demo to learn more!
FAQs
1. What are OpenTelemetry events?
OpenTelemetry events are timestamped occurrences that signify specific actions or state changes within an application. These events provide granular insights into system behavior, capturing details like user interactions, system state transitions, or processing milestones.
2. How do events differ from logs in OpenTelemetry?
While both logs and events capture information about an application, they differ in scope and granularity:
- Events are more focused, capturing specific actions or state changes with detailed context.
- Logs provide a broader overview of an application's operations and are typically used for debugging, error tracking, and understanding application flow over time.
3. What data is included in an OpenTelemetry event?
An OpenTelemetry event typically includes the following:
- Name: A descriptive identifier for the event (e.g.,
user_logged_in). - Timestamp: The exact time the event occurred.
- Attributes: Key-value pairs that provide additional context (e.g.,
user_id,transaction_id). - Event Type: Categorizes the event (e.g.,
INFO,ERROR).
4. How are events captured in OpenTelemetry?
OpenTelemetry provides APIs and SDKs that enable developers to instrument applications and capture events. Developers can use the EventLoggerProvider to create event loggers, log events, and integrate with observability platforms.
5. What are event hierarchies and why are they important?
Event hierarchies represent relationships between events. For example, a parent event like Checkout Process Started can have child events like Payment Initiated or Payment Successful. This hierarchy allows tracing event chains, which helps understand complex workflows and pinpoint issues in distributed systems.
6. What is the EventLoggerProvider in OpenTelemetry?
The EventLoggerProvider is a core component that creates and manages event loggers. It ensures consistent event logging across applications and integrates seamlessly with OpenTelemetry context, including traces and spans, to provide a complete picture of system behavior.
7. Can I customize how events are processed and exported?
Yes, OpenTelemetry allows customization through processors and exporters. You can use custom processors to handle events in specific ways and configure exporters to send events to various storage or observability platforms (e.g., Elasticsearch, Prometheus).
8. Are OpenTelemetry events thread-safe?
Yes, the EventLoggerProvider is designed to be thread-safe, allowing concurrent logging from multiple threads or services without conflicts.
9. What are the use cases for OpenTelemetry events?
OpenTelemetry events are useful for:
- Tracking user interactions, such as login or button clicks.
- Monitoring state changes, like a service starting or stopping.
- Recording significant milestones in processing, such as transaction completions.
10. Can I correlate events across distributed systems?
Yes, OpenTelemetry enables context propagation across distributed systems. Events are tied to traces and spans, ensuring that you can track events across service boundaries and correlate them with other telemetry data.


