

OpenTelemetry and Prometheus are two critical projects in the monitoring and observability world. Prometheus supports metrics monitoring, and OpenTelemetry also allows metrics besides logs and traces.
The semantic convention for metrics in OpenTelemetry(OTLP metrics) does not align with Prometheus' native metrics naming convention.
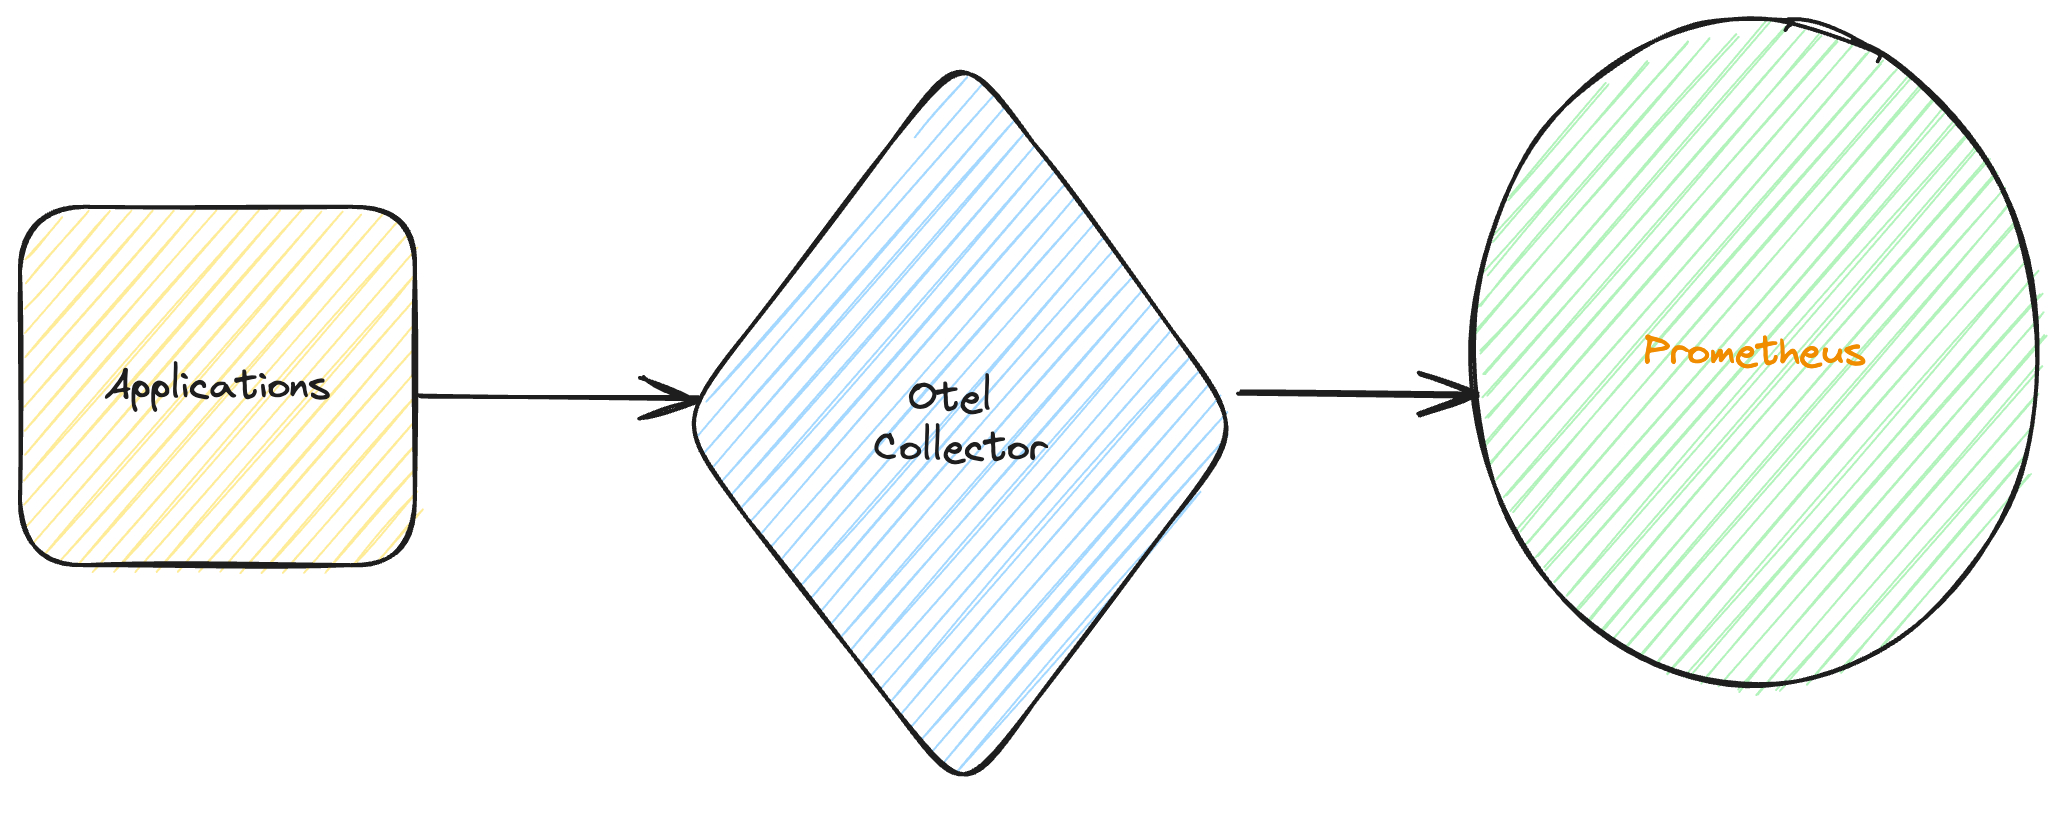
To address this disparity, there is a module in otel-collector-contrib that offers centralized functions that facilitate the conversion of OpenTelemetry metrics into metrics compliant with Prometheus.
This package translates and maps metric names, units, and labels between the OpenTelemetry and Prometheus conventions. This translation allows sending OTLP metrics to Prometheus using an OpenTelemetry collector. But the native support for ingesting OTLP metrics was absent in Prometheus.
Native support for OpenTelemetry metrics in Prometheus
Recently a pull request by Goutham - Prometheus maintainer and Product Manager at Grafana Labs, was merged in the Prometheus codebase, which adds support for ingesting OpenTelmetry metrics using a new OTLP-compatible ingestion endpoint.
"🚀 Prometheus is integrating OpenTelemetry natively, starting with the next release. 🎉 The initial pull request has been merged, paving the way for a combined pull-based model and OTLP metrics, so no matter how you generate your metrics, we get you covered. 📈" said Prometheus maintainer Julien Pivotto.
A new feature flag otlp-write-receiver has been added, enabling the feature for natively ingesting OpenTelemetry metrics.
The OpenTelemetry metrics can be sent on /otlp/v1/metrics the endpoint and ingested natively.
This change is still experimental, and before the final release, a lot of documentation updates will also happen; I will update this post with the changes and add the final Prometheus release version in which this change will be present!
There is already a discussion in Cortex issue tracker of reusing this capability.
Check out the HackerNews discussion on this post.
I had given a talk at Conf42 Devops 2024 on "The complete handbook to OpenTelemetry Metrics" where I discussed about Prometheus and OpenTelemetry Metrics in more details.
Check the video below:
Related: Learn PromQL
Once you're ingesting OpenTelemetry metrics into Prometheus, you'll want to query them effectively. These guides will help:
- PromQL for Beginners - Getting started with Prometheus Query Language
- PromQL Cheat Sheet - Quick reference for common queries
- Prometheus Query Examples - Real-world query patterns

