

A modern observability system is essential for maintaining and improving system performance, especially for teams practicing SRE (Site Reliability Engineering). This guide breaks down the key components—data collection to actionable insights—ensuring your observability strategy is robust and effective.
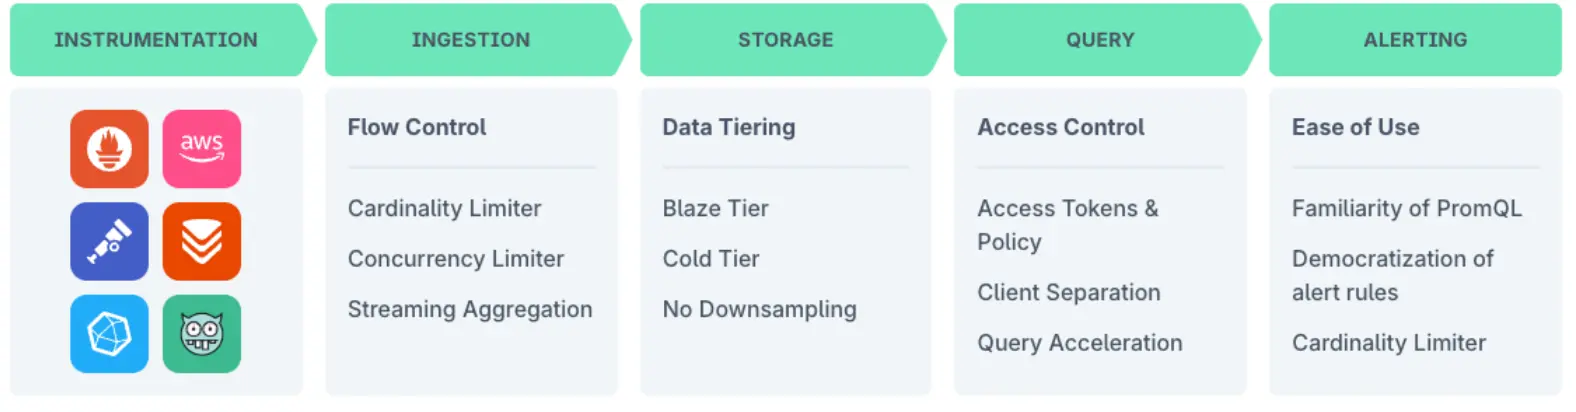
1. Instrumentation
Instrumentation is the foundation of any observability system and is crucial for understanding the behavior of complex systems like those built on microservices architecture.
It involves adding code to your application to collect telemetry data, providing visibility into system behavior. The below image shows various logos, indicating multiple instrumentation options:
- OpenTelemetry (the de facto standard for vendor-neutral instrumentation)
- AWS-specific tools (for cloud-native observability)
- Prometheus client libraries (popular for metrics collection)
- Vendor-specific agents (offering tailored solutions)
Key considerations for instrumentation:
- Compatibility with your tech stack
- Overhead on application performance
- Granularity of data collected
- Ease of implementation and maintenance
2. Ingestion
After data collection, the next critical step in a modern observability system is data ingestion. The ingestion layer goes beyond the capabilities of traditional monitoring and effectively handles the influx of telemetry data from diverse data sources, including applications, infrastructure, and cloud environments, optimizing it for storage and analysis.
To efficiently handle the influx of data, modern monitoring tools often employ advanced ingestion techniques such as batching, buffering, and compression.
Key features of the ingestion layer include:
Flow Control
- Cardinality Limiter: Prevents an explosion of unique time series, safeguarding storage and query system efficiency.
- Concurrency Limiter: Automates the management of data ingestion rates, ensuring optimal system performance.
- Streaming Aggregation: Combines similar data points to reduce overall data volume while retaining important information.
These mechanisms ensure the system can handle high volumes of data without losing critical information or becoming overwhelmed.
3. Storage
After ingestion, observability data needs to be stored efficiently for later analysis. Understanding the intricate dependencies between different components of your system is crucial for effective data storage and retrieval.
A well-structured storage strategy ensures that data is readily accessible, facilitating efficient incident response and historical analysis while being designed for efficiency to enable quick access to historical telemetry data.
To achieve this, observability platforms often employ efficient storage designs.
Key aspects include:
Data Tiering
- Blaze Tier: Likely refers to a hot storage tier for recent, frequently accessed data.
- Cold Tier: Ideal for older data –accessed less frequently, optimizing storage costs.
No Downsampling
This suggests the system retains full-resolution data, providing a more accurate historical analysis. An effective storage strategy balances performance, cost, and data retention needs.
4. Query
The query layer is where data becomes accessible for analysis and visualization, allowing users to interact with the stored data and extract meaningful information, which is crucial for effective observability. It allows users to interact with the stored data, extracting meaningful information.
Important features include:
- Access Tokens & Policy: Ensures that only authorized users can query sensitive data through access tokens and policies.
- Client Separation: Isolates data and queries from different clients to maintain security and privacy.
- Query Acceleration: Optimizes query performance for faster analysis of large datasets, enhancing the overall end-to-end observability experience.
5. Applications Built on Top
The real power of an observability system comes from the applications and use cases built on top of this data pipeline.
Let's discuss some common applications:
5.1 Monitoring Dashboards
- Visualize key metrics and trends
- Provide real-time system status overviews
- Customizable for different roles (e.g., developers, operations, business) to improve user experience
5.2 Alerting Systems
- Detect anomalies and trigger notifications
- Use PromQL (Prometheus Query Language) for defining alert conditions
- Democratize alert creation across teams
- Implement cardinality limiting to prevent alert storms
5.3 Log Analytics
- Centralize logs from various sources to enhance workflows
- Enable full-text search and structured querying
- Correlate logs with metrics and traces for root cause analysis and efficient troubleshooting
5.4 Distributed Tracing
- Visualize request flows across microservices and distributed systems
- Combine anomaly detection with distributed tracing to spot irregularities
- Identify performance bottlenecks
- Debug complex, distributed transactions
5.5 Capacity Planning Tools
- Analyze resource usage trends
- Forecast future infrastructure needs
- Optimize cloud spending
5.6 Automated Remediation
- Create runbooks for common issues
- Trigger automated responses to specific alerts
- Reduce mean time to recovery (MTTR)
5.7 Business Intelligence
- Correlate technical metrics with business KPIs
- Provide insights for non-technical stakeholders
- Drive data-informed business decisions
Conclusion
A modern observability system is a sophisticated pipeline that transforms raw telemetry data into actionable insights. It involves collecting, processing, and analyzing metrics, logs, and traces.
This data-driven approach empowers teams to troubleshoot issues, gain real-time insights, and improve overall system performance.
To learn more about addressing performance issues and optimizing your observability strategy, check out Last9.

