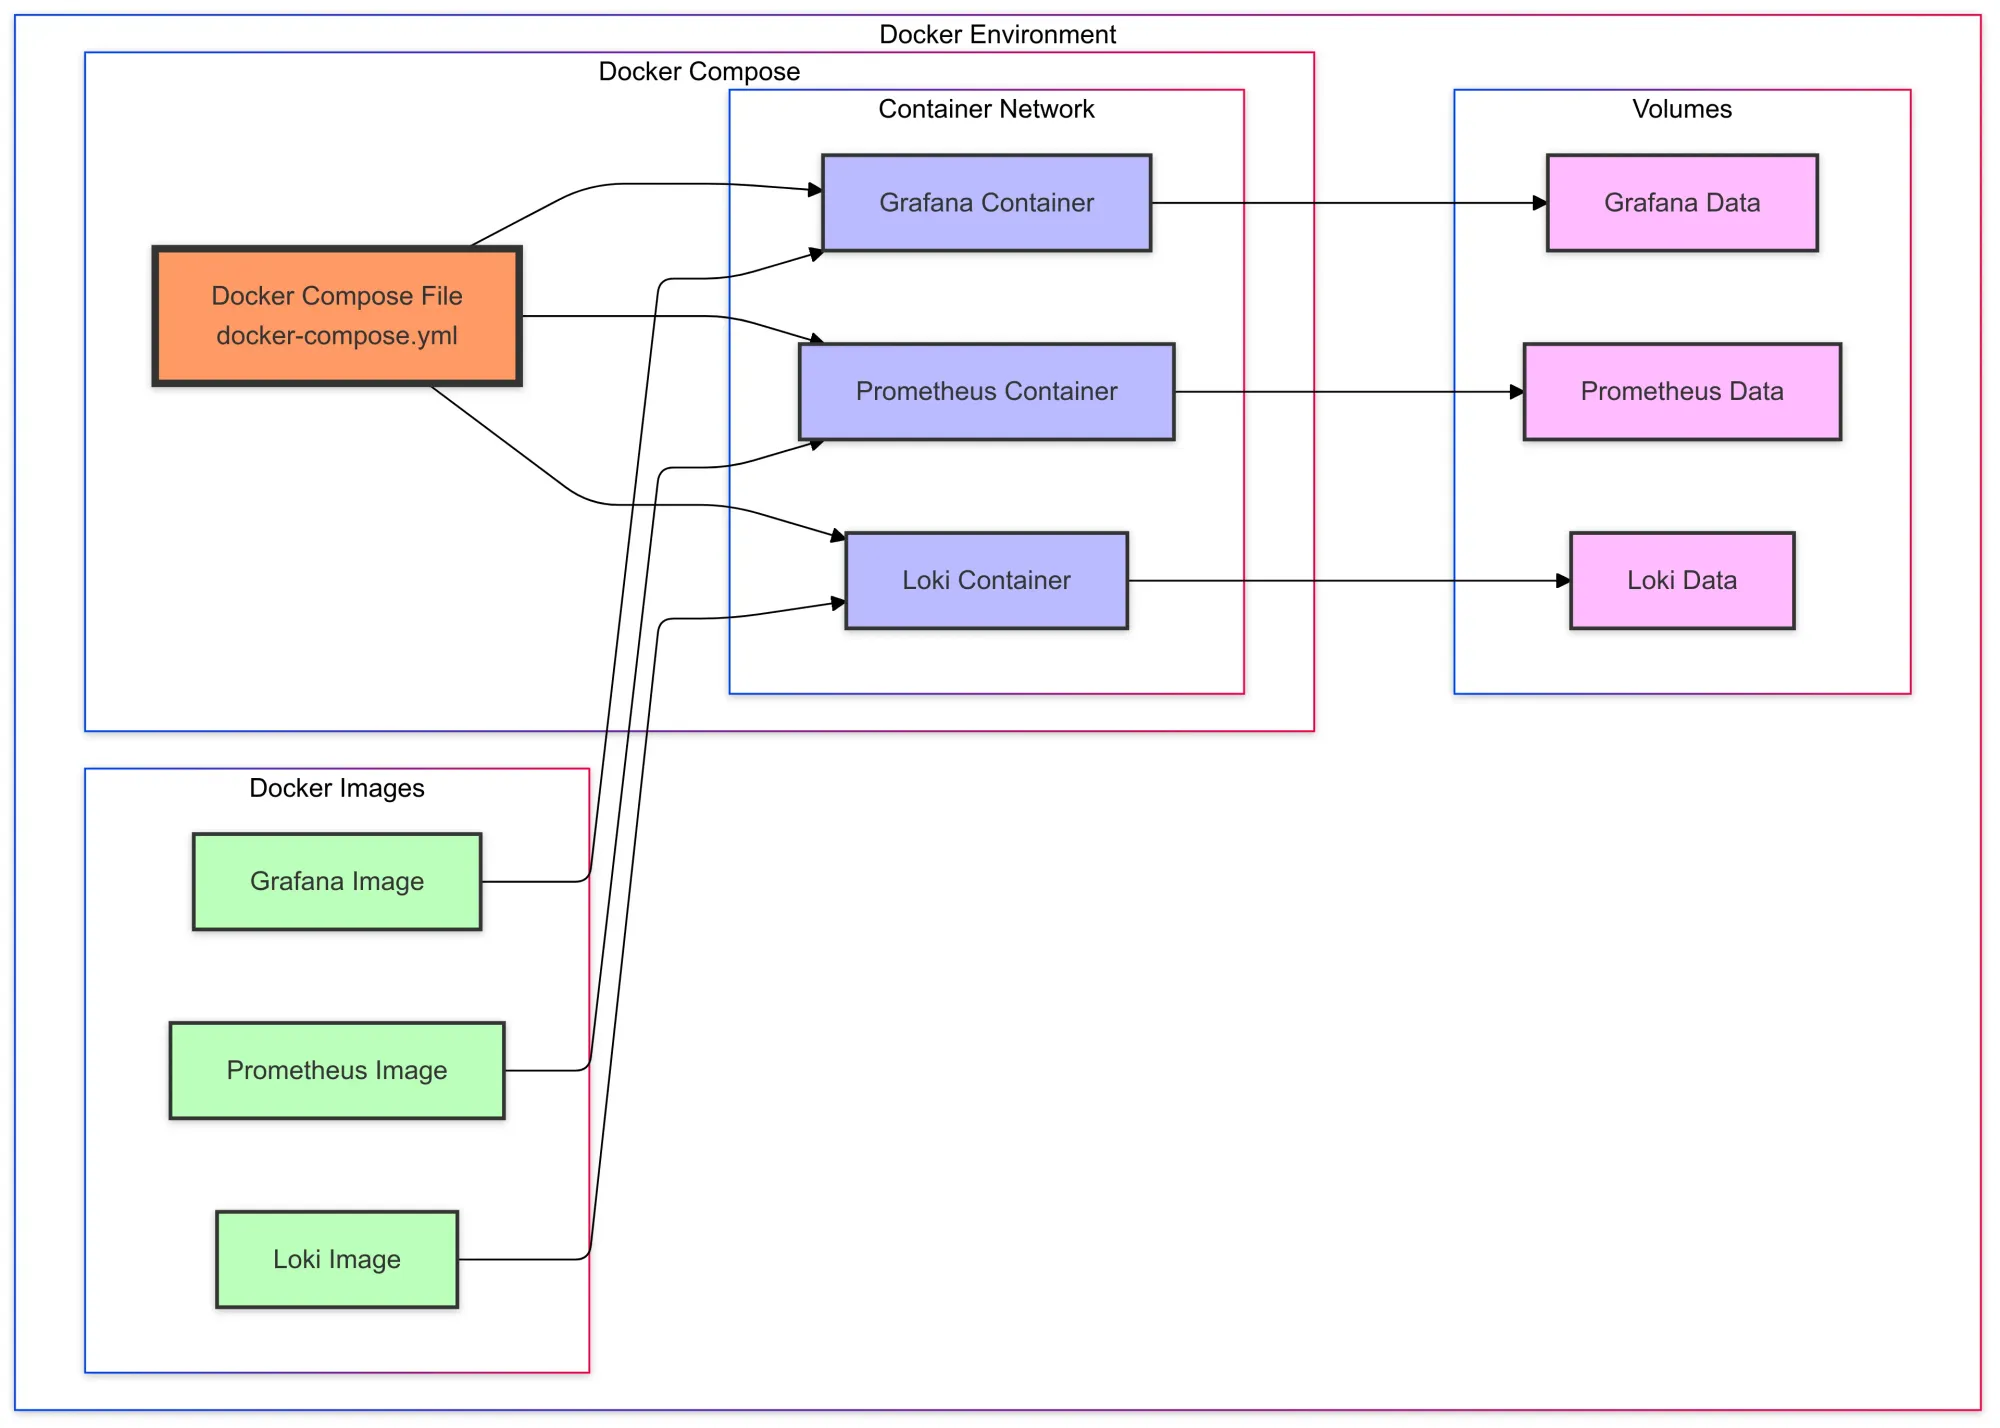
Grafana and Docker work together to monitor and visualize data. Docker makes deployment easy, and Grafana takes it to the next level with powerful, real-time dashboards.
However, understanding the theory behind these tools working together is just as important as knowing the practical steps.
This guide will explore both the theoretical framework and practical setup to ensure you’re getting the most out of Grafana in Docker.
The Advantages of Running Grafana in a Containerized Environment
The Dockerization of Grafana is more than just a convenience—it's an architectural choice that provides numerous benefits:
- Isolation: Docker containers provide process isolation, meaning Grafana runs independently from other applications on your system. This prevents dependency conflicts and version mismatches.
You can configure Grafana with a specific version without worrying about altering the host environment or other software.
- Portability: One of the most powerful aspects of Docker is its ability to package an application with all its dependencies. With Docker, Grafana’s setup can be replicated across environments (development, staging, production) without the risk of configuration drift.
This ensures that every instance of Grafana behaves the same, regardless of where it is deployed.

Datadog vs Grafana
- Scalability: Docker containers are lightweight and easy to scale. When your monitoring needs grow, you can quickly spin up additional Grafana instances, run them behind a load balancer, and handle more traffic seamlessly.
Docker orchestration tools like Kubernetes can automate scaling based on load, making your Grafana deployment robust and flexible.
Key Docker Concepts in the Context of Grafana
Understanding the Docker components that interact with Grafana is crucial:

- Docker Image: This is a static specification for a container. The official Grafana Docker image provides all the necessary components to run Grafana in a containerized environment.
- Container: A running instance of a Docker image. When you deploy Grafana, you're essentially creating a container from the Grafana image. Containers are lightweight and include everything Grafana needs to run: from the application itself to all libraries and settings.
- Docker Compose: When you need to deploy more than one container (for example, pairing Grafana with Prometheus or Loki), Docker Compose helps you define and manage multi-container setups. Configuring all services and their interactions efficiently with a single YAML file.

Docker Monitoring
Step-by-Step Setup: Installing Grafana in Docker
Step 1: Docker Image for Grafana
The Grafana Docker image is optimized for use in containers. It contains the necessary Grafana application and all required dependencies in a compact format.
You can pull the image from Docker Hub:
docker pull grafana/grafanaThis ensures you're always using the most up-to-date version of Grafana, with all security patches and improvements.
Step 2: Starting Grafana in Docker
Now that the Grafana image is pulled, you can run it as a container:
docker run -d --name=grafana -p 3000:3000 grafana/grafanaThe -p flag binds port 3000 on your host machine to port 3000 in the container, which is the default Grafana port.
Step 3: Using Docker Compose to Scale
When your system starts growing, you'll need more than just Grafana. You’ll likely want a data source, such as Prometheus or InfluxDB, to send data to Grafana for visualization. Docker Compose helps manage multiple containers as a single unit, simplifying the deployment process.
Here’s an example of a docker-compose.yml file that deploys both Grafana and Prometheus:
version: "3.8"
services:
  grafana:
    image: grafana/grafana
    environment:
      - GF_SECURITY_ADMIN_PASSWORD=supersecret
    ports:
      - "3000:3000"
    volumes:
      - grafana_data:/var/lib/grafana
  prometheus:
    image: prom/prometheus
    volumes:
      - prometheus_data:/prometheus
    ports:
      - "9090:9090"
volumes:
  grafana_data:
  prometheus_data:
With this configuration, you can bring up both containers simultaneously using:
docker-compose up -dGrafana and Prometheus will be set up and running in isolated containers, making it easy to manage them individually or together.

Prometheus and Grafana
Optimizing Grafana Performance in Docker
Docker Resource Allocation
Running Grafana in Docker has numerous advantages, but to ensure optimal performance, you need to understand how to allocate resources effectively:
- Memory and CPU Management: Containers, by default, don’t impose any strict limits on resources. However, you can configure Docker to allocate specific amounts of CPU and memory to the Grafana container.
This prevents the container from consuming all available resources, which could slow down the system or other containers.
grafana:
  image: grafana/grafana
  mem_limit: 2g
  cpus: 1.0
Setting these values ensures that Grafana stays efficient while having access to sufficient resources for high-performance monitoring.
Persistent Data Storage
One of Docker’s most significant advantages is the ability to handle volumes for persistent storage. For Grafana, this means that your dashboards, settings, and data won’t disappear if the container restarts. Here’s how you ensure data persistence:
volumes:
  - grafana_data:/var/lib/grafana
Without this setup, Grafana’s configuration and dashboard data would be stored within the container, and it would be lost every time the container is removed.
Security Considerations
While Grafana is secure out of the box, Docker adds an extra layer of complexity. Make sure to:
- Use Environment Variables for sensitive data like passwords and API keys.
- Configure SSL using a reverse proxy like Nginx to encrypt traffic between clients and Grafana.
- Limit External Access to the Grafana dashboard by configuring firewall rules or using a private network.
Extending Grafana with Advanced Integrations
Grafana + Loki for Log Aggregation
Grafana shines when paired with other observability tools. Loki, Grafana’s log aggregation tool, can be deployed alongside Grafana to allow you to visualize logs next to your metrics.
Here’s a basic docker-compose.yml file to deploy both Loki and Prometheus:
loki:
  image: grafana/loki
  ports:
    - "3100:3100"
This setup enables you to send logs from your services to Loki, which Grafana can then pull and visualize.
Prometheus + Grafana for Comprehensive Monitoring
Prometheus is a popular time-series database often paired with Grafana. Prometheus collects data from your systems and exposes it for Grafana to visualize. You can collect Docker container metrics using cAdvisor, a tool that exposes detailed information about running containers.
Example setup for cAdvisor with Prometheus:
docker run -d \
  --name=cadvisor \
  -p 8080:8080 \
  --volume=/var/run/docker.sock:/var/run/docker.sock \
  gcr.io/cadvisor/cadvisor
Kubernetes Monitoring
Best Practices for Grafana in Docker
- Health Checks: Add health checks to your Docker setup to ensure that Grafana remains accessible.
- Backups: Regularly back up your Grafana configurations, especially for critical production environments.
- Use Multi-Stage Builds: When using custom Grafana images, consider multi-stage builds to keep the image size minimal.
Troubleshooting Common Issues
1. Container Won't Start
If Grafana fails to start, the first thing to do is check the Docker logs for potential errors:
docker logs grafanaLook for errors like port conflicts, missing environment variables, or corrupt volumes. If you see an bind: address already in use error, ensure that the port Grafana is trying to bind to is not already occupied by another service.
2. Data Not Updating
If your data isn't updating, it’s usually related to issues with your data sources. Check the following:
- Data Source Configuration: Ensure the Prometheus or any other data source is correctly configured in Grafana. This includes checking the URL, authentication (if any), and query settings.
- Prometheus Scraping: Make sure that Prometheus is scraping the right endpoints. You can check if Prometheus is correctly scraping data by visiting
http://<prometheus-server>:9090/targetsto see the list of active targets. - Network Connectivity: If Grafana and Prometheus are running in different containers, verify that the network settings allow them to communicate. You can test this by running
pingorcurlinside the Grafana container to check connectivity.
3. Grafana Dashboard Displays Blank/Empty
If your Grafana dashboard is showing up blank, the issue might be with:
- Permissions: Ensure that the Grafana container has sufficient permissions to access the data source. Check both Grafana and Prometheus user roles.
- Query Errors: Sometimes, the queries in the dashboards might not be configured correctly. Check the Query Inspector in Grafana to debug queries.
- Data Source Connectivity: If Grafana cannot connect to Prometheus or the data source, verify the settings in the
Data Sourcessection of Grafana.

Docker Alternatives
4. Dashboard Not Loading or Loading Slowly
When dashboards take too long to load, it’s typically because of:
- Heavy Queries: Running complex queries can strain the system. Try optimizing the queries in your Grafana dashboards by reducing the number of data points or simplifying the queries.
- Grafana Performance: Ensure that the Grafana container has enough allocated resources (CPU and RAM). You can adjust Docker’s resource limits or scale your Grafana instance with additional replicas if necessary.
- Storage Overload: If the underlying storage is slow or overloaded, it can affect Grafana’s performance. Ensure that you are using a fast and reliable disk or volume for persistent storage.
5. Grafana Container Restarting Frequently
If Grafana is repeatedly restarting, it could be caused by:
- Configuration Errors: Double-check environment variables and mounted volumes to ensure they are set correctly. Misconfigurations, especially with authentication or data sources, can cause Grafana to crash.
- Disk Space: Insufficient disk space or storage for Grafana's logs or data can cause it to crash and restart. Check disk space on the host system and clean up unnecessary files if needed.
- Memory Limits: If your Grafana container is running out of memory, it may restart automatically. You can increase the allocated memory in your Docker configuration or container settings.

Docker logs
6. Can't Access Grafana Web Interface
If you're unable to access grafana's web interface (default: http://localhost:3000), try the following:
- Port Binding: Ensure that the correct ports are being exposed. Use the
-pflag (e.g.,-p 3000:3000) when running the container to bind the container’s port to a port on the host. - Firewall/Network Configuration: Ensure there are no firewall rules blocking access to the port. If you're running Grafana in a cloud environment or behind a reverse proxy, make sure the proper firewall settings are configured to allow inbound traffic to the port.
7. Unable to Load Dashboards or Panels
This is often caused by:
- Dashboard JSON Files: If you're importing dashboards from a file, ensure that the JSON file format is correct. Errors in the JSON structure can prevent the dashboard from loading.
- Broken Links: If the panels or dashboard links are broken, verify that the references in the dashboard file are correct and that all necessary data sources are set up properly.
- Version Compatibility: If you're upgrading Grafana, some dashboards or plugins might be incompatible with the newer version. Check the release notes for breaking changes.

Conclusion
Grafana and Docker form a powerful combination that streamlines the process of monitoring and visualizing your data.
Docker’s portability, scalability, and isolation capabilities complement Grafana’s advanced visualization and dashboard features, making it easier to set up, manage, and scale your monitoring infrastructure.
With Docker’s containerized approach, you can quickly deploy and scale Grafana in any environment without worrying about complex dependencies or configuration issues.
If you're looking to simplify your observability stack further, Last9 offers a unified view of metrics, logs, and traces, making it easier for teams to connect the dots across distributed systems and microservices.
Last9 has been crucial for us. We’ve been able to find interesting bugs, that were not possible for us with New Relic. — Shekhar Patil, Founder & CEO, Tacitbase
Schedule a demo with us to learn more or try it for free!
FAQs
How does Docker improve the performance of Grafana?
Docker provides a lightweight, isolated environment for Grafana, ensuring it runs independently from other applications on the host. This reduces dependency conflicts, making it easier to manage and scale Grafana in multiple environments. Docker's resource allocation features also help optimize Grafana’s performance by controlling CPU and memory usage.
Can I run Grafana and Prometheus together in Docker?
Yes, Grafana and Prometheus can be run together in Docker using Docker Compose. This allows you to deploy both containers simultaneously with an easy-to-manage configuration. Docker Compose links the two services, ensuring they communicate efficiently for monitoring and data visualization.
Is it difficult to scale Grafana in a Dockerized environment?
Not at all. Docker’s lightweight nature and orchestration tools like Kubernetes make scaling Grafana containers easy. By adding more replicas or adjusting resource allocation, you can ensure that Grafana handles increased traffic or larger datasets with minimal changes.
How do I ensure data persistence for Grafana in Docker?
To ensure data persistence, mount Docker volumes to store Grafana’s configuration and data outside the container. This ensures that even if the container is removed or recreated, your dashboards and settings remain intact.
What are the best practices for securing Grafana in Docker?
- Use SSL/TLS for encrypted connections to Grafana.
- Set up firewall rules to restrict access to the Grafana dashboard.
- Store sensitive data, such as passwords or API keys, using environment variables.
- Configure user roles and permissions in Grafana to limit access to specific features.
Can I use Grafana with other data sources besides Prometheus?
Yes, Grafana supports a wide variety of data sources, including InfluxDB, Elasticsearch, MySQL, and more. Docker makes it easy to set up these data sources alongside Grafana by linking multiple containers together in a Docker Compose setup.


