Watching how your apps and resources perform in Google Cloud Platform (GCP) helps keep everything running smoothly and within budget. With the right tools, GCP monitoring makes it easier to catch issues early and keep things optimized.
This guide walks you through the basics, tools, and best practices to help you get started.
What Is GCP Monitoring?
GCP monitoring is the process of collecting, analyzing, and visualizing metrics, logs, and events from your GCP resources. Whether you're running virtual machines, Kubernetes clusters, or serverless applications, monitoring helps you:
- Detect and resolve performance issues before they escalate.
- Optimize resource utilization to manage costs effectively.
- Maintain high availability and meet user expectations.
Key Tools for GCP Monitoring
1. Cloud Monitoring
- Centralized platform for tracking metrics, events, and uptime.
- Integrates with other GCP services like BigQuery and Cloud Logging.
- Features include customizable dashboards, alerting policies, and SLO monitoring.
2. Cloud Logging
- Collects and stores logs from all your GCP services.
- Offers query capabilities for troubleshooting and analytics.
- Supports export to tools like BigQuery for long-term analysis.
3. Cloud Trace
- Provides request latency data to visualize bottlenecks in your distributed applications.
- Helps in debugging and improving API response times.
4. Cloud Profiler
- Continuously profile your application to identify inefficient resource usage.
- Useful for performance tuning in production environments.
5. Cloud Debugger
- Enables you to debug applications in real time without impacting performance.
- Ideal for identifying issues in live environments.

Step-by-Step Guide to GCP Monitoring
Step 1: Set Up Cloud Monitoring
- Enable APIs: Ensure the Cloud Monitoring API is enabled for your project.
- Configure Workspaces: Create or link a workspace to organize and view monitoring data.
- Integrate Resources: Add your resources (e.g., Compute Engine, GKE) to start collecting metrics.
Step 2: Build Dashboards
- Use pre-built dashboards for quick insights into resource health.
- Customize dashboards by adding widgets for metrics like CPU usage, memory, and disk I/O.
- Group resources by labels like environment (e.g., prod, dev) for focused monitoring.
Step 3: Set Up Alerts
- Define alert policies for key metrics such as uptime, error rates, and latency.
- Use notification channels (email, Slack, PagerDuty) to alert the right team members.
- Test your alerts to avoid false positives.
Step 4: Analyze Logs with Cloud Logging
- Enable logging for your services to capture all activity.
- Use log queries to filter and find specific events (e.g., error messages).
- Export logs to BigQuery for deeper analysis or to external systems like Splunk.
Step 5: Optimize with Cloud Profiler and Trace
- Profile your application to identify inefficient code paths and improve CPU/memory usage.
- Use Trace to analyze latency issues and optimize API performance.
Best Practices for GCP Monitoring
Focus on SLOs (Service Level Objectives)
- Identify the metrics that directly impact your user experience (e.g., availability, response time).
- Align monitoring and alerts with your SLOs to prioritize critical issues.
Use Labels
- Use consistent labeling for resources to group and filter them effectively in dashboards.
Avoid Alert Fatigue
- Set threshold-based alerts to focus on actionable incidents.
- Combine related alerts to reduce noise.

Automate Where Possible
- Use Terraform or Deployment Manager to automate monitoring configurations.
- Schedule regular audits of monitoring setups to keep them relevant.
Integrate with Third-Party Tools
- Extend GCP monitoring capabilities by integrating with tools like Grafana, Prometheus, or Datadog.
Applications of GCP Monitoring
Scenario 1: Optimizing Kubernetes Workloads
- Use Cloud Monitoring to track pod CPU/memory usage.
- Set up Cloud Logging to analyze logs for errors or warnings in your GKE cluster.
- Monitor latency with Cloud Trace during peak traffic.
Scenario 2: Debugging an API Latency Issue
- Use Cloud Trace to pinpoint where the API request is bottlenecked.
- Analyze logs in Cloud Logging for detailed error information.
- Optimize code using insights from Cloud Profiler.
Scenario 3: Cost Management for Compute Engine Instances
- Monitor usage metrics in Cloud Monitoring to identify underutilized instances.
- Automate scaling policies based on workload demands.
- Export data to BigQuery for long-term cost analysis.
GCP Monitoring Implementation Guide
1. Monitoring Configuration Examples
Basic Monitoring Setup
monitoring:
  metric_descriptors:
    - name: custom.googleapis.com/service/latency
      metric_kind: GAUGE
      value_type: DOUBLE
      unit: ms
      labels:
        - key: service_name
          value_type: STRING
        - key: environment
          value_type: STRING

  alert_policies:
    - display_name: "High Latency Alert"
      conditions:
        - display_name: "Latency > 200ms"
          condition_threshold:
            filter: metric.type="custom.googleapis.com/service/latency"
            duration: 300s
            comparison: COMPARISON_GT
            threshold_value: 200
Explanation:
metric_descriptors: Defines custom metricsname: Unique identifier for the metricmetric_kind: GAUGE for instant measurementsvalue_type: DOUBLE for floating-point valueslabels: Key-value pairs for metric categorization
alert_policies: Configures monitoring alertscondition_threshold: Defines when alerts triggerduration: Time window for evaluation (300s = 5 minutes)comparison: Comparison operator (GT = greater than)
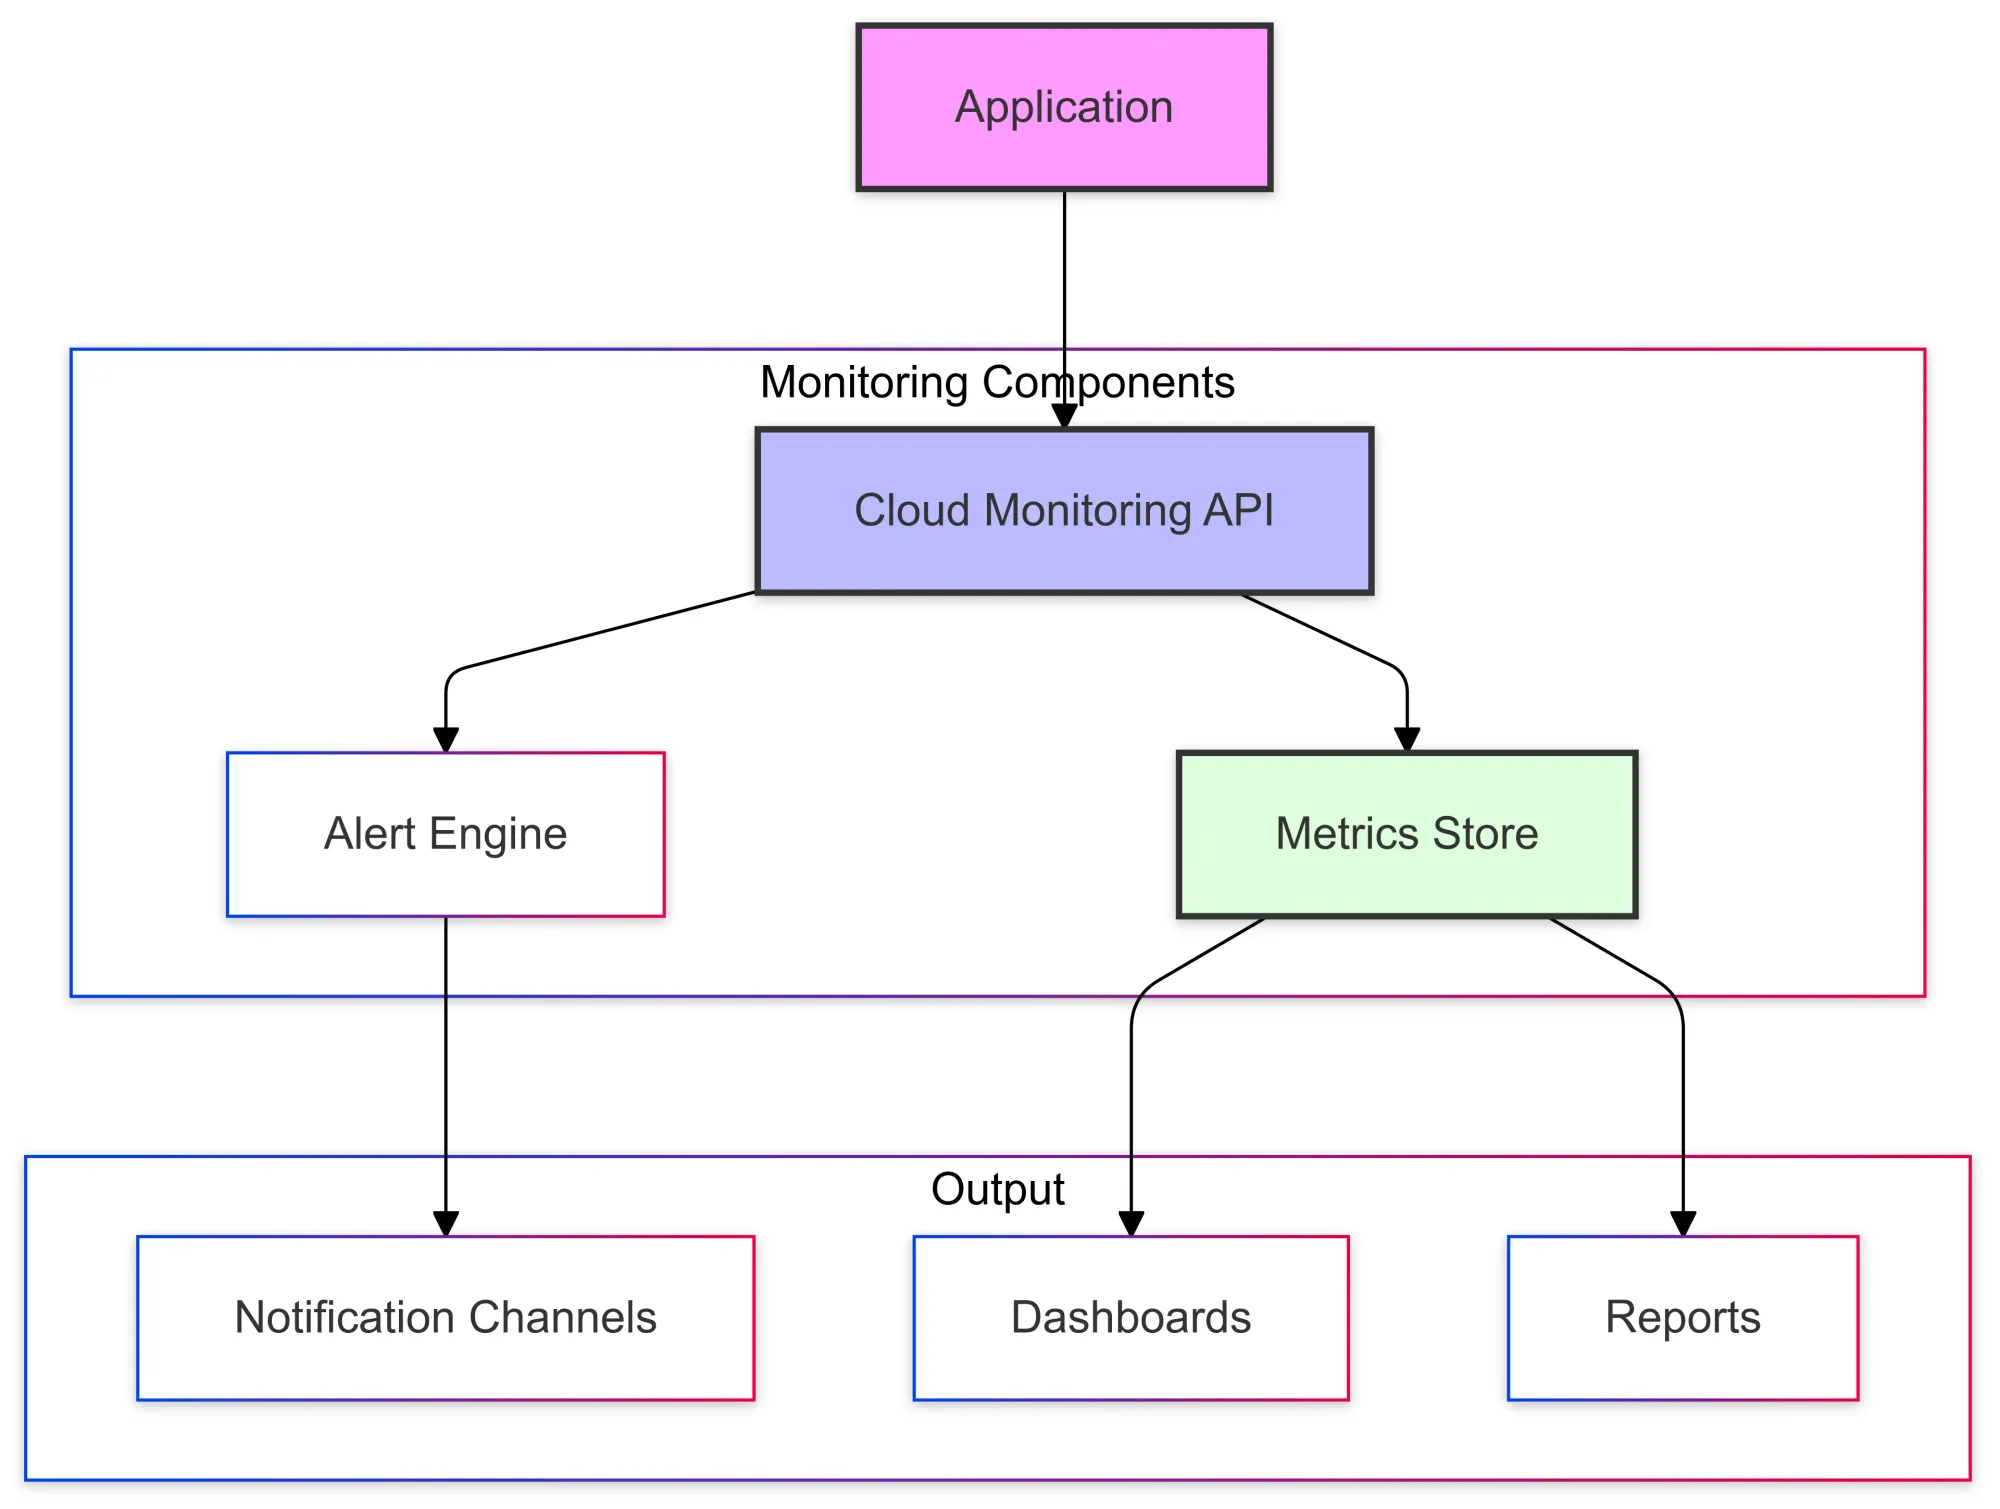
2. Monitoring Architecture
3. Custom Metrics Implementation
Python Implementation
from google.cloud import monitoring_v3
import time

def create_time_series(project_id):
    client = monitoring_v3.MetricServiceClient()
    project_name = f"projects/{project_id}"

    series = monitoring_v3.TimeSeries()
    series.metric.type = "custom.googleapis.com/service/latency"
    series.resource.type = "global"

    # Add label values
    series.metric.labels["service_name"] = "payment-service"
    series.metric.labels["environment"] = "production"

    point = series.points.add()
    point.value.double_value = 123.45
    now = time.time()
    point.interval.end_time.seconds = int(now)

    client.create_time_series(
        name=project_name,
        time_series=[series]
    )
Explanation:
- Creates a time series for custom metric
- Sets metric type and resource type
- Adds labels for categorization
- Creates data point with timestamp
- Submits to GCP Monitoring

4. Alert Policy Configuration
Terraform Implementation
resource "google_monitoring_alert_policy" "alert_policy" {
  display_name = "High Error Rate Alert"
  combiner     = "OR"
  conditions {
    display_name = "Error Rate > 5%"
    condition_threshold {
      filter          = "metric.type=\"custom.googleapis.com/service/error_rate\""
      duration        = "60s"
      comparison      = "COMPARISON_GT"
      threshold_value = 5.0
      trigger {
        count = 1
      }
      aggregations {
        alignment_period   = "60s"
        per_series_aligner = "ALIGN_RATE"
      }
    }
  }
  notification_channels = [google_monitoring_notification_channel.email.name]
}
Explanation:
- Creates alert policy using Terraform
- Sets threshold for error rate (5%)
- Configures evaluation duration (60s)
- Defines aggregation method
- Links to the notification channel
5. Dashboard Configuration

{
  "displayName": "Service Performance Dashboard",
  "gridLayout": {
    "columns": "2",
    "widgets": [
      {
        "title": "Service Latency",
        "xyChart": {
          "dataSets": [{
            "timeSeriesQuery": {
              "timeSeriesFilter": {
                "filter": "metric.type=\"custom.googleapis.com/service/latency\"",
                "aggregation": {
                  "alignmentPeriod": "60s",
                  "perSeriesAligner": "ALIGN_MEAN"
                }
              }
            }
          }]
        }
      }
    ]
  }
}
Explanation:
- Defines dashboard layout with 2 columns
- Creates chart widget for latency
- Configures time series data source
- Sets up data aggregation (60s intervals)
- Uses mean alignment for data points
6. Log-Based Metrics
from google.cloud import logging_v2

def create_log_metric(project_id, metric_name):
    client = logging_v2.MetricsServiceV2Client()
    parent = f"projects/{project_id}"

    metric = {
        "name": metric_name,
        "filter": "resource.type=cloud_run_revision AND severity>=ERROR",
        "metric_descriptor": {
            "metric_kind": "DELTA",
            "value_type": "INT64",
            "unit": "1",
            "display_name": "Error Count"
        }
    }

    response = client.create_log_metric(
        parent=parent,
        metric=metric
    )
    return response
Explanation:
- Creates metric based on log entries
- Filters for Cloud Run errors
- Configures metric as counter (DELTA)
- Sets up integer value type
- Defines display name for dashboards
Conclusion
GCP monitoring isn’t just a technical task—it’s key to boosting performance, cutting costs, and keeping users happy.
Get started today by setting up your Cloud Monitoring workspace and gain the insights you need for a more resilient and efficient cloud environment.
At Last9, we think observability should be easier and cost-effective. Our data warehouse is designed to handle telemetry data (logs, traces, metrics, and events) at scale, making it easier to manage.
Plus, it’s available on both AWS and GCP marketplaces, so you can use it with your preferred cloud provider. Schedule a demo with us or try it for free to see how it makes observability simple and cost-effective.
FAQs
What is GCP monitoring?
GCP monitoring refers to the process of tracking and analyzing the performance, availability, and health of resources within the Google Cloud Platform (GCP). It involves using tools like Cloud Monitoring, Cloud Logging, and Cloud Trace to gather insights and ensure your cloud infrastructure runs smoothly.
Why is GCP monitoring important?
Monitoring is essential to ensure the reliability, performance, and cost efficiency of your GCP resources. It allows you to spot issues before they affect your users, optimize resource usage to reduce costs and maintain high service availability.
What tools are available for GCP monitoring?
- Cloud Monitoring: Tracks metrics, uptime, and resource health.
- Cloud Logging: Collects and analyzes logs from GCP services.
- Cloud Trace: Visualizes latency across your application.
- Cloud Profiler: Identifies performance bottlenecks and optimizes resource usage.
- Cloud Debugger: Enables real-time debugging without impacting production.
How do I set up Cloud Monitoring in GCP?
To set up Cloud Monitoring:
- Enable the Cloud Monitoring API for your project.
- Create a monitoring workspace and link it to your resources.
- Start configuring dashboards to visualize metrics and set up alert policies.
What are Service Level Objectives (SLOs), and why should I track them?
SLOs are measurable goals that define the expected performance and availability of a service. Tracking SLOs helps ensure your application meets user expectations, optimizes service performance, and prioritizes issues based on their impact on users.
How can I reduce alert fatigue in GCP monitoring?
To avoid alert fatigue, configure actionable, threshold-based alerts and set clear notification channels. Combine related alerts and fine-tune thresholds to avoid excessive notifications. Regularly review and adjust alert policies to align with current needs.
Can I integrate GCP monitoring with third-party tools?
Yes, GCP monitoring can be integrated with third-party tools like Grafana, Prometheus, and Datadog to enhance visualizations, alerting, and monitoring capabilities beyond what is available natively in GCP.
How do I analyze logs in GCP?
Use Cloud Logging to collect and store logs from your GCP services. You can filter logs using queries, identify errors or unusual events, and export them to BigQuery for deeper analysis or to third-party systems for further processing.
How do I monitor Kubernetes workloads in GCP?
Use Cloud Monitoring to track metrics like CPU and memory usage of Kubernetes pods. Leverage Cloud Logging for error analysis and Cloud Trace to measure API response times. Set up alerts to notify you when resource utilization exceeds thresholds.
How can GCP monitoring help with cost management?
GCP monitoring helps by providing insights into resource utilization, allowing you to identify underutilized resources and scale accordingly. You can also set up alerts for unexpected usage spikes, which can help you manage and reduce cloud costs.
What’s the difference between Cloud Monitoring and Cloud Logging?
- Cloud Monitoring focuses on tracking and visualizing performance metrics such as uptime, CPU, and memory usage.
- Cloud Logging is designed for collecting and analyzing logs from services and applications, useful for troubleshooting and identifying issues at the event level.
How can I improve the performance of my GCP infrastructure using monitoring?
By leveraging tools like Cloud Profiler to identify inefficient code and Cloud Trace to find latency bottlenecks, you can optimize your application’s performance. Additionally, Cloud Monitoring helps track resource usage trends, enabling you to adjust scaling and optimize infrastructure costs.
What are the benefits of using AI in GCP monitoring?
AI-driven insights in GCP monitoring can automatically detect anomalies, predict potential issues, and offer remediation suggestions, reducing the need for manual intervention. This proactive approach can help prevent outages and improve operational efficiency.
Can GCP monitoring be used for multi-cloud environments?
Yes, while GCP monitoring is primarily designed for GCP resources, it can be extended to multi-cloud environments with integrations like Prometheus or third-party monitoring solutions that consolidate metrics across different cloud platforms.


