

This blog post explains how you can use advanced filtering capabilities to filter out metrics based on their labels before them being sent to destinations. It assumes that you know what OpenTelemetry is already. If not, brush it up here before moving forward.
TLDR;
Go through the video for a quick overview but I would suggest going through the post to strengthen your fundamentals on the OpenTelemetry collector flow.
OpenTelemetry Collector
OpenTelemetry Collector is a vendor-agnostic way to receive, process and export telemetry data. It removes the need to run, operate, and maintain multiple agents/collectors.
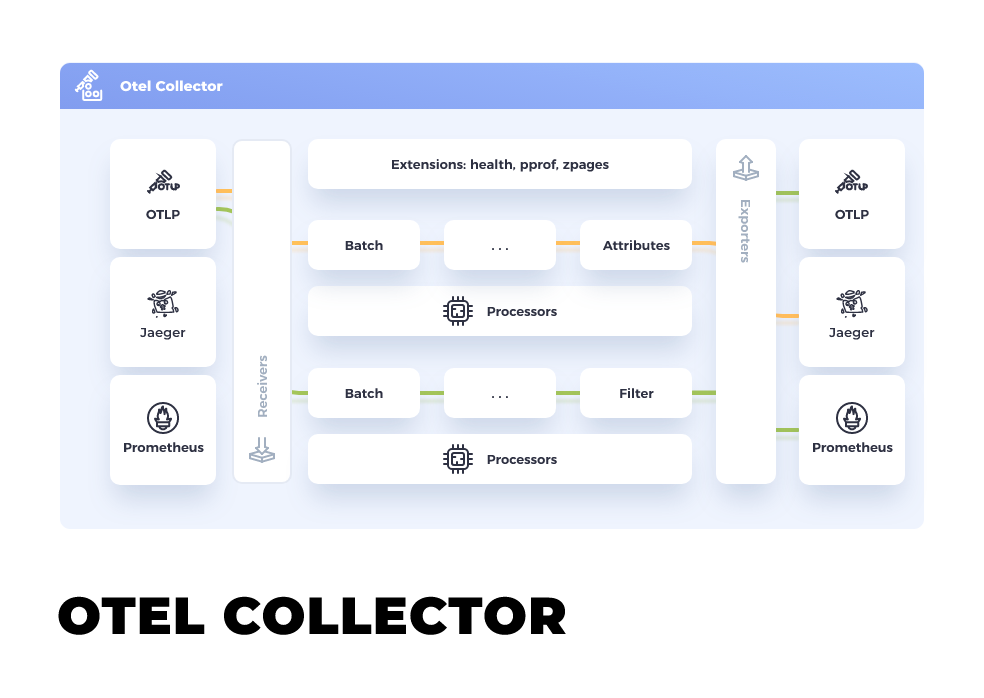
The Collector consists of three components that access telemetry data:
- Receivers - Receive the telemetry data from different sources.
- Processors - Process it, filter it, drop it if needed before being exported.
- Exporters - Export the processed data to the destination endpoint.
All these components are configured to form a pipeline that works end to end.
Read more on the configuration details on how the receivers, processors and exporters work together.
Filtering Metrics by Labels
Coming back to the problem at hand, while OpenTelemetry supports different telemetry data types such as Metrics, Logs and Traces, we are focussed on only Metrics. We want to filter the Metrics by their labels and then send them to different destinations.
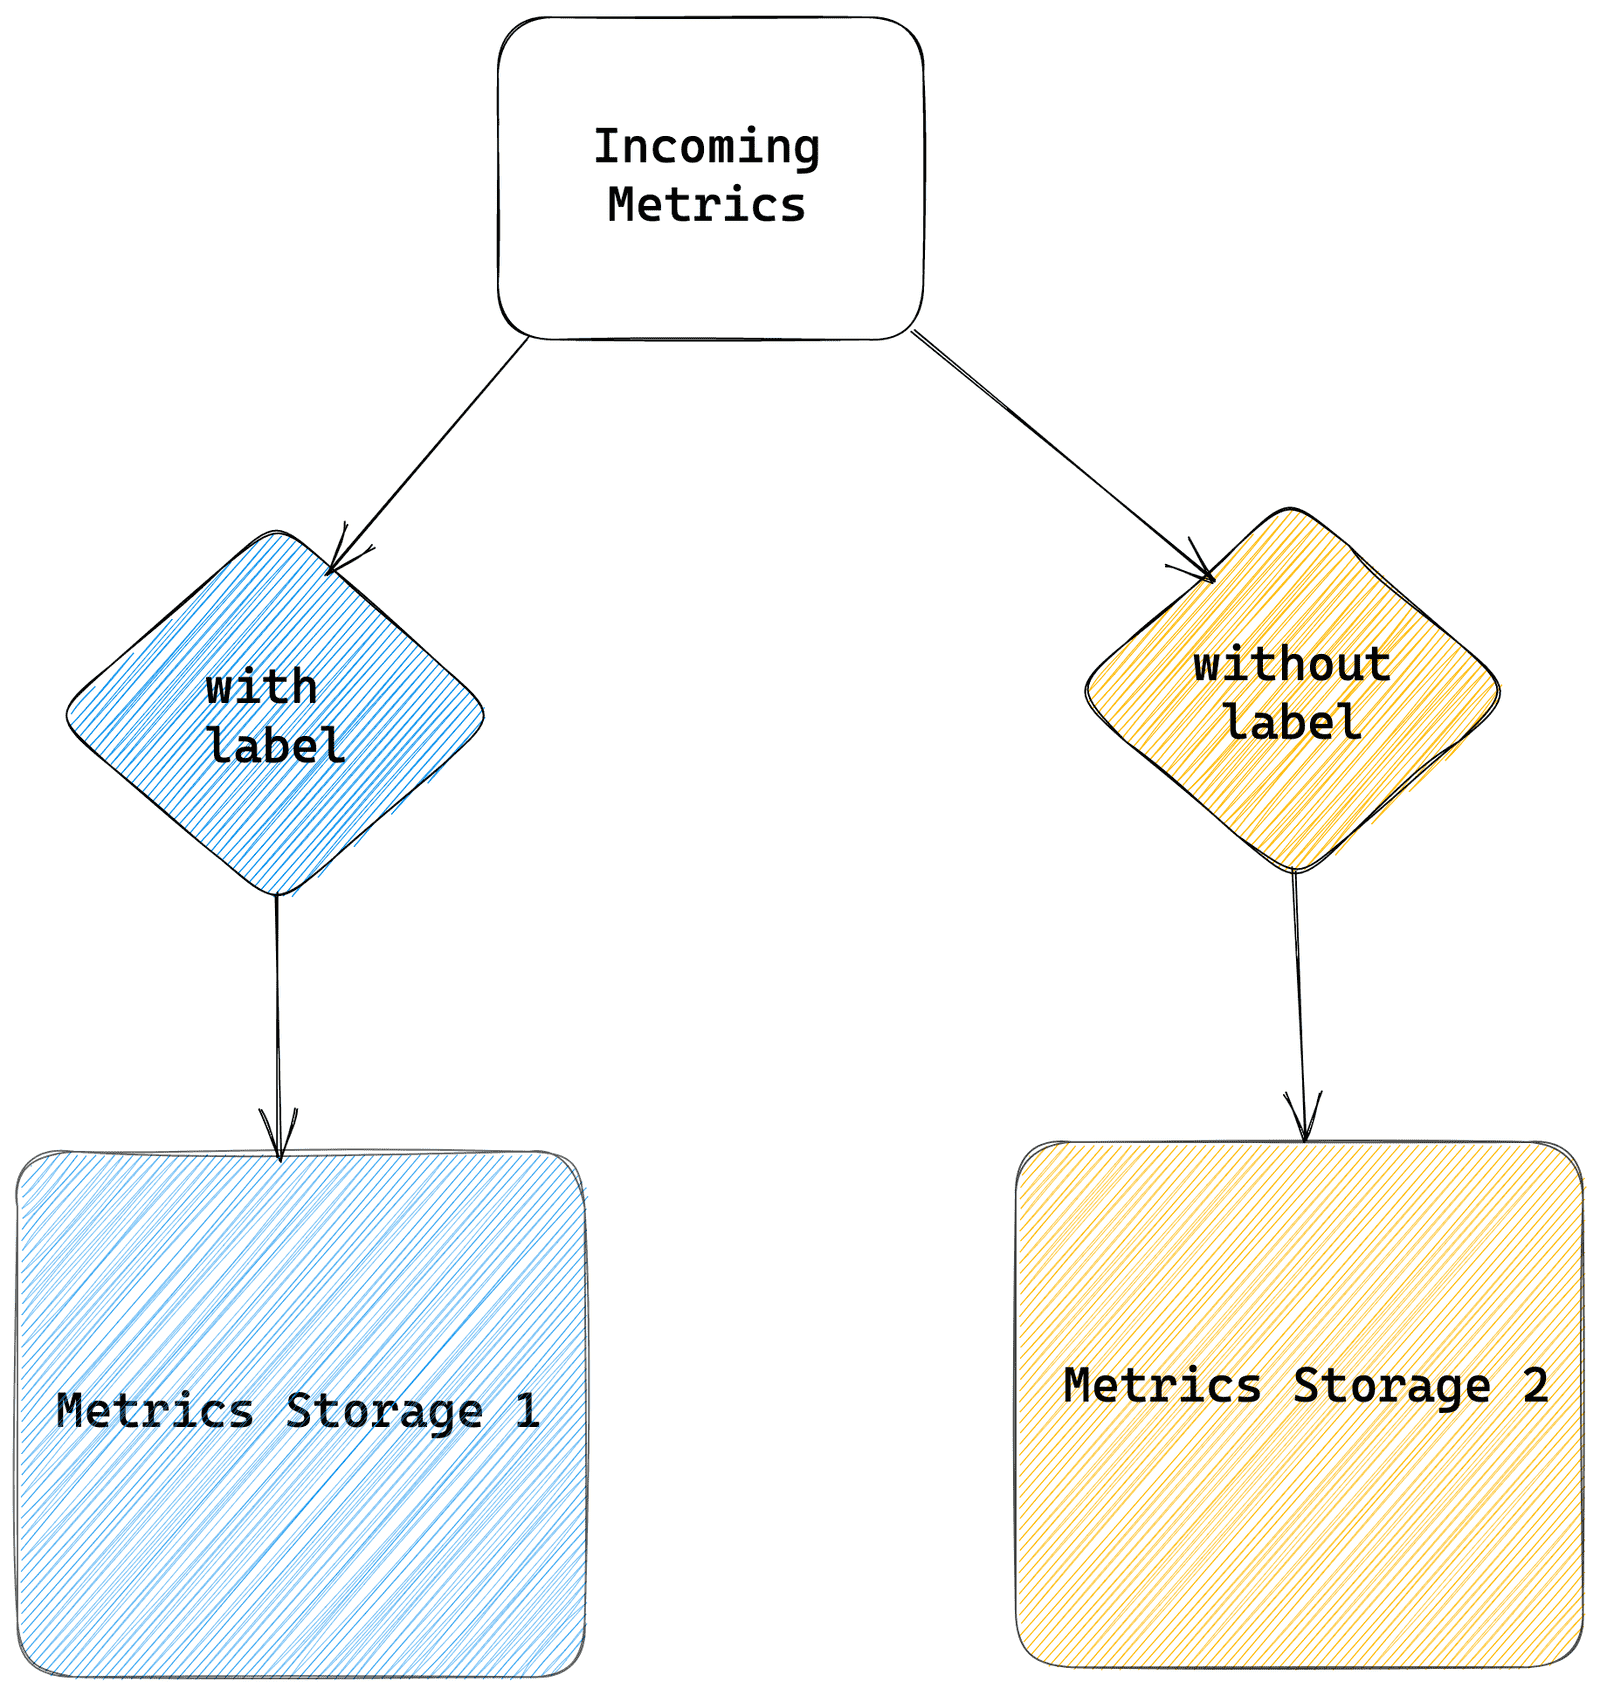
If we map this whole process into OpenTelemetry Collector's components, we see a very clear picture which component will be responsible for which phase.
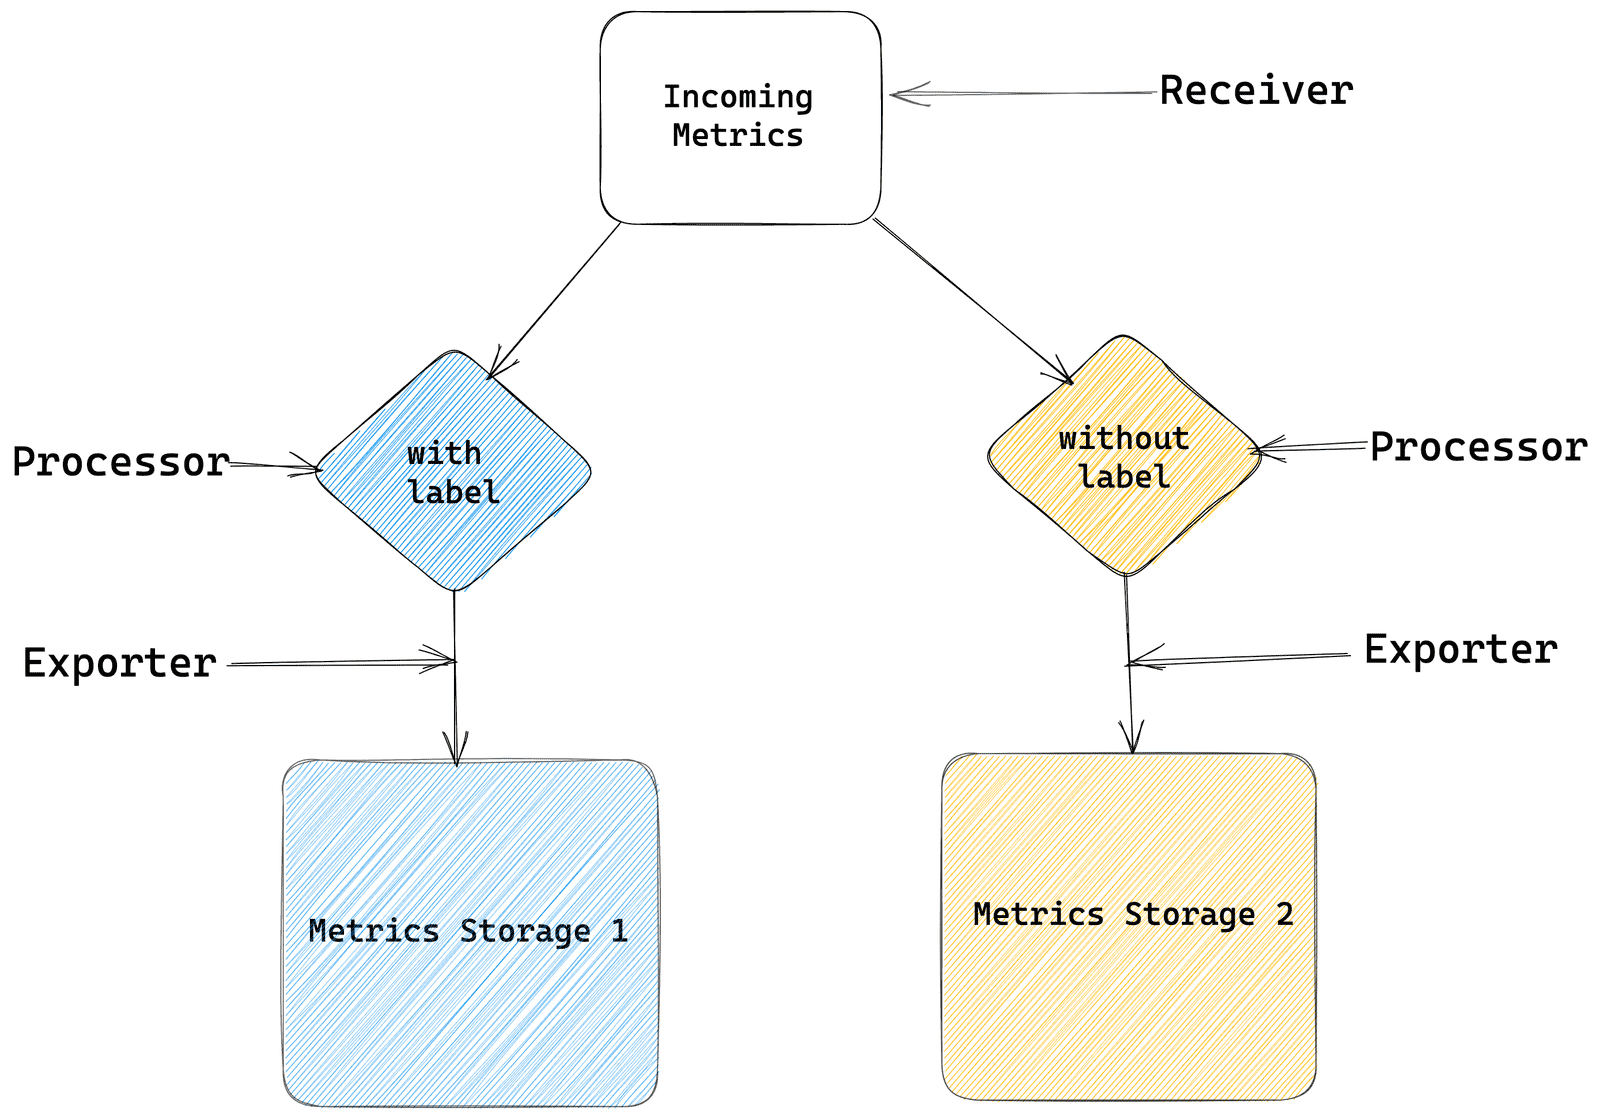
With the expected flow defined, let's dive deeper into how we will achieve this.
The Receiver
The receiver configuration is just a Prometheus scraper listening scraping from an application which emits certain metrics with labels.
receivers:
  prometheus:
    config:
      scrape_configs:
      - job_name: 'otel-collector-01'
        scrape_interval: 60s
        static_configs:
        - targets: ['app:8000']
Here the app is emitting the metrics on port 8000.
The Processor
This is where the real fun is. We use the filter key for metrics data type to define the filtering rule.
OpenTelemetry allows us to define the filter on metric names based on three types.
strict- match the metric name with the filter providedregexp- match all the metric with names matching a regexexpr- match all the metrics matching with result of the expression.
Strict Match
This filter will exclude all the metrics matching the names hello_world and hello/world.
processors:
  filter/1:
    metrics:
      exclude:
        match_type: strict
        metric_names:
          - hello_world
          - hello/world
Regular Expression Match
processors:
  filter/1:
    metrics:
      include:
        match_type: regexp
        metric_names:
          - prefix/.*
          - prefix_.*
This filter will match all the metrics matching the given regular expression.
(Advanced) Expression match
processors:
  filter/1:
    metrics:
      exclude:
        match_type: expr
        expressions:
        - MetricName == "my.metric" && Label("my_label") == "abc123"
        - MetricType == "Histogram"
The expression based filter is powerful enough that it can effectively run boolean assertions against the metrics and match the metrics based on their results.
Multiple expressions are ORed so if any of the expression matches, then the metric is picked up by the filter.
Additionally, the expressions allow us to use following functions and variables.
MetricNamea variable containing the current Metric's name.MetricTypea variable containing the current Metric's type: "Gauge", "Sum", "Histogram", "ExponentialHistogram" or "Summary".Label(name)a function that takes a label name string as an argument and returns a string: the value of a label with that name if one exists, or "".HasLabel(name)a function that takes a label name string as an argument and returns a boolean: true if the datapoint has a label with that name, false otherwise.
Using these functions we can solve the problem of filtering the metrics based on labels. Coming back to our problem at hand.
processors:
  filter/1:
    metrics:
      include:
        match_type: expr
        expressions:
        - MetricName == "request_counts_total" && HasLabel("path") == true
  filter/2:
    metrics:
      include:
        match_type: expr
        expressions:
        - MetricName == "request_counts_total" && HasLabel("path") == false
The receivers, processors, exporters and/or pipelines are defined via component identifiers intype[/name]format (e.g.otlporotlp/2). We can create multiple unique components of a given type as long as the identifiers are unique.
We create two filters, filter/1 matches metrics with name request_counts_total and having path label. The second filter filter/2 matches metrics with same name but without having the path label.
The Exporter
With filtering done, we need to send the data to two different storage destinations.
exporters:
  prometheusremotewrite/1:
    auth:
      authenticator: basicauth/prw/1
    endpoint: "https://tsdb-backend.io/v1/metrics/bb79e5ff****/sender/last9/write"
  prometheusremotewrite/2:
    auth:
      authenticator: basicauth/prw/2
    endpoint: "https://tsdb-backend.io/v1/metrics/bb79e5ff****/sender/last9/write"
We use the Prometheus Remote Write extension to securely send data using HTTP Basic Auth.
The Pipelines
Connecting the dots together, let's define two pipelines for two destinations to wire up the receiver, processor and exporters defined earlier.
service:
  extensions: [basicauth/prw/1, basicauth/prw/2]
  pipelines:
    metrics/1:
      receivers: [prometheus]
      processors: [filter/1]
      exporters: [prometheusremotewrite/1]
    metrics/2:
      receivers: [prometheus]
      processors: [filter/2]
      exporters: [prometheusremotewrite/2]
Once run, the Collector will export the metrics based on respective filters to each destination.
More details on possible options in the Filter Processor for metrics, can be found here.
Summary
To summarize, we saw how we can define powerful pipelines using OpenTelemetry collector to process, filter metrics based on various conditions such their names, using a regular expression and even defining complex expressions involving labels.
You can also check out the docker setup here to play with locally.

