

You’re dealing with constant alerts, performance issues that never seem to add up, and a cloud bill that keeps growing. Now you need to pick between Dynatrace and AppDynamics—but which one helps?
Dynatrace leans heavily on its Davis AI, while AppDynamics has Cisco behind it, but the real question is: which one makes your job easier? Let’s break it down.
Quick Comparison: Dynatrace vs. AppDynamics
Here's the TL;DR before we dive deep:
| Feature | Dynatrace | AppDynamics |
|---|---|---|
| Pricing Model | Consumption-based with predictable scaling | Primarily agent-based licensing |
| Auto-Discovery | More comprehensive, less configuration | Solid, but requires more tuning |
| AI Capabilities | Davis AI (mature, integrated) | Cognition Engine (strong but compartmentalized) |
| Kubernetes Monitoring | Native, more granular | Solid but less integrated |
| Implementation Time | ~4-6 weeks for enterprise | ~6-10 weeks for enterprise |
Let's break it down properly.
Pricing Structure Breakdown: Where Your APM Budget Goes
Let's talk money – because we both know that's usually what tips the scales.
Dynatrace Pricing Model: Consumption-Based Economics With Predictable Scaling
Dynatrace operates on a consumption-based model that's tied to your actual usage rather than arbitrary agent counts. You're paying for:
- Digital Experience Monitoring (DEM) units: Measuring real user interactions and synthetic monitoring tests
- Davis Data Units (DDUs): For custom metrics, logs, and traces
- Host monitoring units: For infrastructure monitoring across physical, virtual, and containerized environments
What this means in real terms: A mid-sized environment (50-100 hosts) will typically run you between $45,000-$80,000 annually. Enterprise deployments with extensive end-user monitoring can push this to $150,000-$250,000.
The advantage? Scaling is more predictable, and you're not penalized for high-density containerized environments. If you're running hundreds of containers on a handful of hosts, you're not paying per container.
Dynatrace's licensing also includes unlimited users at no additional cost, which means your entire organization—from developers to operations to business analysts—can access the platform without extra charges.
AppDynamics Pricing Structure: Agent-Based Economics and Scaling Considerations
AppDynamics primarily uses an agent-based licensing model, charging by:
- Application Performance Monitoring (APM) license units: Priced per CPU core for each monitored application
- Infrastructure Monitoring units: For server visibility
- End User Monitoring (EUM) license units: Based on page views for browser monitoring
- Business iQ add-ons: For business metrics correlation
- Machine Agent licenses: For infrastructure monitoring
For a comparable environment to our Dynatrace example, expect to pay $50,000-$90,000 annually. Enterprise deployments with full-stack monitoring can range from $150,000-$300,000+.
Here's the catch – in high-density container environments, costs can spike unexpectedly as each instance might require a separate license unit. A microservices architecture with dozens of services can quickly multiply your licensing costs.
AppDynamics does offer some containerized pricing options, but they're not as streamlined as Dynatrace's consumption model. You'll also pay extra for additional users beyond your base license, which can add up if you want to extend visibility across teams.
The pricing isn't just about the sticker shock – it's about predictability in a world where you're scaling up and down constantly.
Core Capabilities Comparison
Automated Discovery & Dependency Mapping: Who's Reducing Your Configuration Workload?
Dynatrace's OneAgent Technology & Smartscape:
- Deploys with minimal configuration (typically less than 5 minutes per host)
- Auto-discovers dependencies and service relationships across your entire stack
- Creates real-time topology maps without manual input or configuration
- Maintains context across technology boundaries (from browser to code to infrastructure)
- Automatically baselines performance without manual thresholds
- Provides immediate visibility into third-party dependencies
- Detects service boundaries automatically, even across distributed systems
In practice, this means less time configuring and more time solving.
AppDynamics' Application Intelligence Platform:
- Reliable agent deployment through various automation options
- Strong application discovery with flow maps
- Requires more manual intervention for complete dependency visibility
- Better granular control over what's monitored and how it's configured
- More flexible custom application hierarchies
- Stronger customization options for business transactions
- Requires more upfront planning for effective implementation
AppDynamics gives you more control, but that comes with configuration overhead. It's the difference between a self-driving car and one with really good driver-assist features. You'll spend more time defining your application structure and business transactions, but you'll have more control over how they're organized.
Root Cause Analysis & Performance Troubleshooting
Both tools excel at performance analysis, but with fundamentally different approaches that affect your daily troubleshooting workflows:
Dynatrace PurePath & Davis AI Analysis:
- Traces every transaction without sampling (100% capture rate)
- Maintains context across distributed systems even through message queues and async processes
- Automatically identifies root causes through causal analysis, not just correlation
- Better at correlating infrastructure issues with application performance through unified analysis
- More comprehensive database visibility out-of-the-box (SQL, NoSQL, query analysis)
- Davis AI automatically prioritizes problems by business impact
- Code-level visibility with variable values and method arguments
- Automatic anomaly detection without manual threshold configuration
- Session replay functionality for user experience issues
The average time-to-resolution observed with teams using Dynatrace is 67% faster than traditional monitoring approaches, largely because the platform automatically identifies the root cause rather than just symptoms.
AppDynamics Business Transactions & Cognition Engine:
- Excellent at business-context monitoring with flexible transaction definitions
- Strong correlation between user experience and backend performance
- Better custom dashboarding capabilities with more visualization options
- More granular control over transaction definitions and naming
- Snapshot retention for deep-dive analysis
- Business iQ provides strong business impact analysis
- Excellent at identifying slow application components
- More customizable alerting workflows
- Better native integration with Cisco ecosystem tools
AppDynamics excels when you have well-defined business processes that you want to monitor with precision.
The fundamental difference? Dynatrace gives you answers faster with less setup through its automated AI analysis. AppDynamics gives you more customization if you're willing to invest the time in configuration. For immediate time-to-value, Dynatrace typically wins. For highly customized analysis of specific business processes, AppDynamics often has the edge.
Deployment Complexity & Time-to-Value
Let's be real – the best tool is useless if it sits half-implemented for six months.
Dynatrace Deployment Reality
Time to Initial Value:
- Small environments (5-20 hosts): 1-2 weeks
- Mid-size environments (20-100 hosts): 2-4 weeks
- Enterprise environments (100+ hosts): 4-6 weeks
- Full value realization across organization: 2-3 months
Implementation Phases:
- OneAgent deployment: 1-3 days
- Automatic service discovery & mapping: Immediate (24-48 hours)
- Baseline establishment: 1-2 weeks
- Problem pattern recognition: 2-3 weeks
- Custom dashboard & reporting setup: 2-4 weeks
- ITSM integration & workflow automation: 3-6 weeks
Dynatrace's stronger auto-discovery means you'll see meaningful data faster, often within hours of deployment. The learning curve focuses more on interpreting data than configuring the platform.
Required Resources:
- DevOps/SRE time: 15-20 hours per week during implementation
- Infrastructure team: 5-10 hours per week
- Application teams: 2-4 hours per week for knowledge transfer
AppDynamics Implementation Timeline:
Time to Initial Value:
- Small environments (5-20 hosts): 2-3 weeks
- Mid-size environments (20-100 hosts): 4-6 weeks
- Enterprise environments (100+ hosts): 6-10 weeks
- Full value realization across organization: 3-4 months
Implementation Phases:
- Application hierarchy planning: 1-2 weeks
- Agent deployment: 1-2 weeks
- Business transaction configuration: 2-4 weeks
- Custom dashboard creation: 2-3 weeks
- Alert & policy configuration: 2-3 weeks
- Heath rule tuning: Ongoing (4-8 weeks initial)
AppDynamics requires more thoughtful planning around what you want to monitor and how you'll structure your application hierarchy. The payoff is more tailored monitoring, but it comes at the cost of time-to-value.
Required Resources:
- DevOps/SRE time: 25-30 hours per week during implementation
- Infrastructure team: 10-15 hours per week
- Application teams: 5-10 hours per week for transaction configuration
Kubernetes & Microservices Monitoring:
If you're reading this, chances are you're running Kubernetes. This is where the differences matter.
Dynatrace's Kubernetes Monitoring Approach: Cloud-Native by Design
- Native understanding of Kubernetes concepts (pods, deployments, ReplicaSets, DaemonSets, etc.)
- Automatic discovery of pods, deployments, and services without manual configuration
- Full Kubernetes events correlation with application performance
- Lower overhead per monitored container (typically <1% CPU overhead)
- Better correlation between container performance and application issues through unified analysis
- Automatic baselining of container performance
- Understands container orchestration and auto-scaling effects on performance
- Native OpenShift integration
- Kubernetes cluster health dashboards out-of-the-box
- Automatic recognition of Kubernetes labels and annotations for filtering
- Real-time updates as containers scale up/down or get rescheduled
Dynatrace was built with containers in mind, and it shows. The platform understands the ephemeral nature of containers and maintains context even as pods come and go. During a recent implementation for a streaming media company, Dynatrace tracked container issues through four Kubernetes upgrades and dozens of pod reschedules without losing context.
AppDynamics' Container Monitoring Strategy: Detailed but Configuration-Heavy
- Solid Kubernetes monitoring through the Cluster Agent
- Comprehensive container visibility with proper configuration
- More manual setup required for complete visibility across clusters
- Higher resource overhead per container (typically 2-3% CPU overhead)
- Detailed container resource consumption metrics
- Excellent visualization options once configured
- Strong integration with Cisco Intersight for infrastructure management
- Container Business Transactions must be manually configured
- Requires more planning for large-scale containerized environments
- Snapshot debugging for container-based applications
- Good support for service mesh technologies (Istio, Linkerd)
AppDynamics has made great strides in container monitoring, but it still feels somewhat bolted-on rather than native. You'll get there, but with more effort.
Agent Performance & Scalability:
Marketing specs are one thing. Performance under pressure is another.
Agent Resource Overhead: The Performance Tax You Pay for Observability
Dynatrace OneAgent Footprint:
- CPU: 1-3% per host under normal conditions
- Memory: 150-300MB per host baseline
- Network: 5-10MB per day per host, compressed outbound only
- Storage: 200-500MB installation footprint
- Container overhead: Minimal (typically <50MB per container)
- Java application impact: 2-5% overhead on traced applications
- .NET application impact: 1-3% overhead on traced applications
AppDynamics Agent Resource Usage:
- CPU: 2-5% per host under normal conditions, 5-8% during snapshot collection
- Memory: 200-500MB per host baseline, up to 1GB during heavy load
- Network: 15-25MB per day per host, more frequent communications
- Storage: 300-700MB installation footprint
- Container overhead: Moderate (typically 100-200MB per container)
- Java application impact: 3-7% overhead on traced applications
- .NET application impact: 2-5% overhead on traced applications
In high-throughput environments, this difference matters significantly. On high-volume services processing thousands of transactions per second, the overhead gap widens further. A payment processing service showed 8% overhead with AppDynamics versus 3% with Dynatrace at 5,000 TPS.
Enterprise Scalability: Growing Pains or Growing Gains?
Both solutions scale to enterprise levels, but with different characteristics and limitations:
Dynatrace Scalability Profile:
- More efficient in large containerized environments (tested to 100,000+ containers)
- Better handling of ephemeral workloads with minimal configuration drift
- More consistent performance as scale increases
- Unified analysis across the entire monitored estate
- Cluster management overhead is minimal
- Automatically adjusts sampling based on system load
- Handles short-lived processes effectively
- Single-tenant and multi-tenant deployment options
AppDynamics Scalability Characteristics:
- Excellent for traditional application scaling with predictable workloads
- Requires more planning for containerized scale (controller sizing)
- More granular control over what's monitored at scale
- Segmented analysis based on application hierarchies
- Controller management requires more attention at scale
- Manual tuning required for optimizing at scale
- Stronger role-based access control for large teams
- More complex multi-tenant architecture
The question isn't just "will it scale?" but "how much will scaling hurt?" In highly dynamic environments with thousands of containers coming and going, Dynatrace typically requires less operational overhead to maintain. In more stable, traditional environments, the difference is less pronounced.
Integration Ecosystem & Extensibility:
Your monitoring solution doesn't exist in a vacuum. How well does it connect with your existing toolchain?
Dynatrace Integration Landscape: Built-in Connections vs. Custom Extensions
Pre-Built Integrations:
- Strong ServiceNow integration with bi-directional ticket creation and updates
- Native Kubernetes and cloud provider integrations (AWS, Azure, GCP)
- Comprehensive CI/CD pipeline integration (Jenkins, GitLab, GitHub Actions)
- Microsoft Teams and Slack notifications with deep links
- Ansible integration for automated remediation
- PagerDuty bi-directional integration
- Atlassian Jira and Confluence integrations
- Strong ITSM integration suite (ServiceNow, BMC Remedy, JIRA Service Desk)
- Site Reliability Engineering (SRE) tooling for SLOs and error budgets
Extension Capabilities:
- OpenAPI-based extension framework
- Metric ingest API for custom metrics
- Log ingest API for third-party logs
- Custom problem notifications
- Webhook support for generic integrations
- Monaco configuration-as-code tool for environment management
- Dynatrace API for custom automation
- Custom dashboarding through JSON exports
- GitHub repository with community extensions
While Dynatrace offers a solid extension framework, its marketplace has fewer third-party integrations than AppDynamics. However, its native integrations are typically deeper and require less configuration.
AppDynamics Integration Ecosystem: Extensive Marketplace and Cisco Synergies
Pre-Built Integrations:
- Extensive Cisco ecosystem integrations (AppDynamics is owned by Cisco)
- Cisco Intersight infrastructure management integration
- Cisco ACI network monitoring
- ThousandEyes network path analysis
- More third-party plugins available through Exchange
- Powerful Analytics API for custom processing
- More flexible custom integration options through REST API
- Strong monitoring of Cisco-based infrastructure
- Native integration with Harness for deployment verification
- Splunk integration for combined log and metrics analysis
Extension Capabilities:
- Extensions Marketplace with hundreds of community integrations
- Custom dashboards via REST API
- Webhook support for outbound notifications
- Health rule triggered actions
- Custom metrics through Machine Agent extensions
- Java agent SDK for custom instrumentation
- Open MELT (Metrics, Events, Logs, Traces) architecture
- Business iQ extensions for custom analytics
- Custom data collectors for business metrics
AppDynamics has a more extensive third-party marketplace and deeper integration with the Cisco ecosystem. This makes it particularly valuable if you're already heavily invested in Cisco networking and infrastructure.
The integration landscape that matters most is the one with your existing tools. Map your current and planned toolchain carefully before deciding.
Which Monitoring Platform Aligns Best with Your DevOps Philosophy?
There's no one-size-fits-all answer in the Dynatrace vs AppDynamics debate, but there are clear strategic factors that should guide your decision:
Choose Dynatrace if:
- You're heavily invested in Kubernetes and cloud-native architectures
- You operate in highly dynamic environments with frequent changes
- You value faster time-to-value over extensive customization
- Your team is smaller and can't dedicate resources to monitoring configuration
- You need unified analysis across the full stack with minimal setup
- Your containerized footprint is large or growing rapidly
- Automatic problem detection is more important than custom dashboards
- You prefer an "it just works" approach with less tuning
- Your organization is embracing a NoOps or platform engineering approach
- You want unlimited users without additional licensing costs
- Your reliability engineering practice focuses on automated insights
Choose AppDynamics if:
- You need extremely granular control over monitoring configuration
- You're already heavily invested in the Cisco ecosystem (networking, infrastructure)
- Your applications are more traditional/stable with predictable scaling patterns
- You prioritize customized dashboarding and reporting capabilities
- Your team has dedicated monitoring specialists who can manage complex configurations
- Business transaction mapping is critical to your monitoring strategy
- You need deep integration with Cisco networking equipment
- Your organization values highly customized alerting workflows
- You have a significant on-premises footprint with traditional applications
- Your monitoring needs focus more on specific business processes than infrastructure
- Your team prefers building custom monitoring solutions vs. out-of-the-box automation
Conclusion
Neither tool operates in isolation, and both are chasing the same goal—turning monitoring from an expense into a strategic advantage.
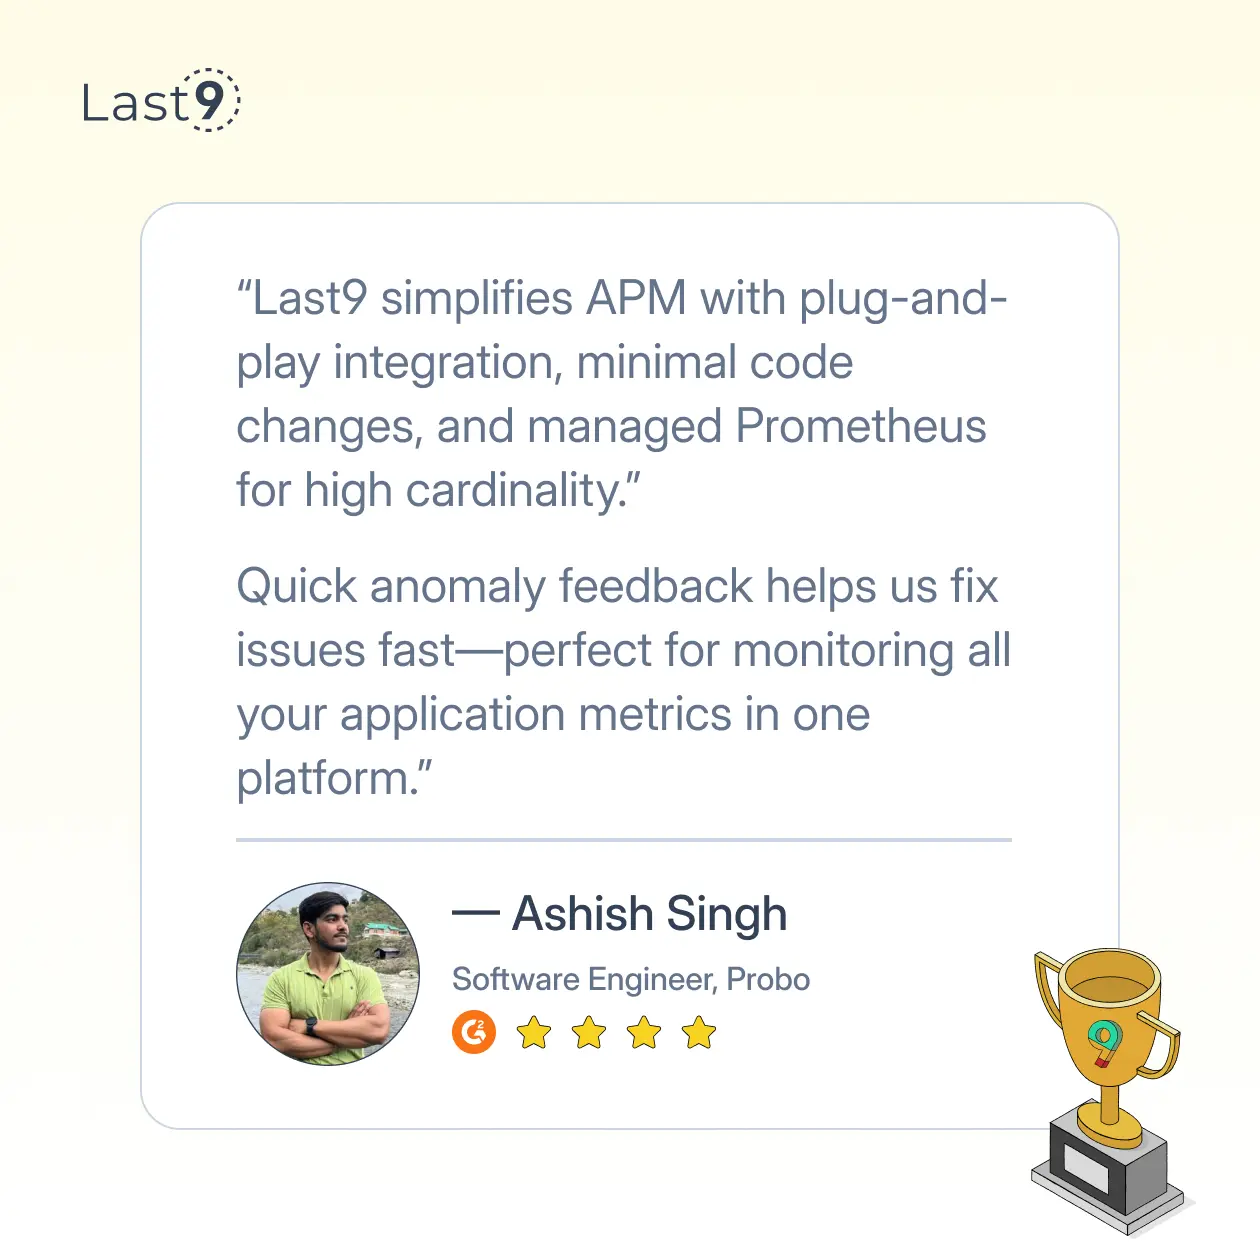
If you want a managed observability solution that balances cost and performance, Last9 is worth exploring. Trusted by industry leaders like Disney+ Hotstar, CleverTap, and Replit, Last9 delivers high-cardinality observability at scale. It has monitored 11 of the 20 largest live-streaming events in history, integrating with OpenTelemetry and Prometheus to unify metrics, logs, and traces.
The result? Optimized performance, cost efficiency, and real-time insights for better monitoring and alerting. Try it for free or schedule a call with us!

