

A CDN delivers your content around the world, making sure users get it quickly and reliably. When it slows down or goes offline, users notice right away.
Good CDN monitoring gives your team the information needed to fix issues before they affect users. This guide explains the basics of CDN monitoring and shows practical ways to set it up.
What Is CDN and CDN Monitoring?
A Content Delivery Network (CDN) is a distributed system of servers, or edge nodes, strategically placed around the world to deliver web content quickly and reliably to users regardless of their location. CDN monitoring is the process of tracking the health, performance, and availability of this entire network in real time.
Unlike monitoring a single server, CDN monitoring involves observing a complex, global system where each edge server handles requests differently based on location, content type, and traffic patterns. This makes it critical to understand not just whether the CDN is “up,” but how well it’s performing across regions and scenarios.
Learn how to extract and analyze account-level CDN metrics from Akamai logs using Last9 for real-time insights and better customer tracking.
What to Measure in CDN Performance
Response Time and Latency
Response time is how long your CDN takes to get content to users. But averages don’t always tell the full story—if a few requests are slow, they can get lost in the average.
That’s why looking at percentiles is better. The 95th percentile (P95) shows how long the slowest 5% of requests take. If this number is high, those users are having a bad experience.
Here’s what typical numbers might look like:
- P50 (median): 150ms
- P95: 400ms
- P99: 800ms
The P99 matters most because it shows the slowest requests, where users often get frustrated.
There are two latencies to track:
- Edge to user: How long content take from the CDN to the user? This affects what the user feels.
- Edge to origin: How long does the CDN take to get content from your server? If this is slow, it means the origin or network is causing delays.
Tracking both helps figure out where the problem is — on the CDN side or with your origin servers.
Cache Hit Ratio
The cache hit ratio shows how often your CDN serves content from its cache instead of fetching it from your origin servers. A good hit ratio is usually between 85% and 95%, but it depends on the kind of content you’re delivering.
Static files like images, CSS, and JavaScript usually have higher hit ratios. Dynamic content changes more often, so it tends to have lower hit ratios.
If you see a sudden drop in your cache hit ratio, it could mean your cache is clearing too often or your TTL (time to live) settings need adjusting.
Here’s a quick guide to what different hit ratios mean:
- 95% and above: Excellent, mostly static content
- 80% to 94%: Good for mixed content
- 60% to 79%: Acceptable for dynamic content
- Below 60%: Time to review your caching setup
To effectively monitor your CDN’s performance, it’s essential to focus on the four Golden Signals—latency, traffic, error rate, and saturation—as they provide a clear framework for assessing system health.
DNS Resolution Performance
DNS resolution happens early in the page load process and adds directly to the user’s wait time. With a CDN, DNS plays an even bigger role because it routes users to the nearest or fastest edge server. This means extra DNS lookups, which can impact performance.
It’s important to monitor DNS response times from multiple locations because:
- Different ISPs or regions may have varying speeds or issues resolving your CDN’s domain.
- For example, a slow or failing DNS resolver in Europe can cause longer page loads or errors for users there—even if your CDN and origin servers are fine.
- DNS failures or timeouts can cause requests to stall or fail, leading to pages not loading.
- Sometimes, a single problematic DNS resolver affects many users in a whole region.
To keep your CDN fast and reliable, track DNS resolution times, failure rates, and timeouts across all your user regions. Catching DNS issues early helps you fix them before users are affected.
Error Rates and Status Codes
It’s important to track the HTTP status codes your CDN returns to understand how well it’s serving your content.
- 4xx errors usually point to client-side problems, like broken links or missing files. For example, a 404 error happens when someone tries to load an image that’s been deleted or moved.
- 5xx errors indicate server-side issues, either with your origin servers or sometimes with the CDN itself. A 503 error, for instance, often means your server is overloaded or temporarily unavailable.
If many errors come from a specific area, it could signal local network issues or a problem with a particular CDN edge server. Monitoring both the type and location of errors helps you quickly identify and fix issues before they impact more users.
Bandwidth and Traffic Patterns
Monitoring bandwidth usage helps detect sudden changes in traffic that affect CDN performance. For example, during a flash sale on an e-commerce site, traffic can jump dramatically as users rush to grab deals. This spike tests your CDN’s ability to serve cached product images and pages without slowing down.
On the flip side, a sudden increase in traffic could be a DDoS attack—where attackers flood your CDN with fake requests to overwhelm your servers. You might notice this as a sharp rise in requests to specific URLs or unusual spikes in traffic from unexpected geographic regions.
Geographic Performance Monitoring
A CDN spans the globe, but performance isn’t equal everywhere. What loads quickly for users in New York might feel slow for those in Mumbai.
To get an accurate view, set up monitoring from multiple locations that match your user base. For example, if 30% of your traffic comes from Asia, aim to run about 30% of your tests from locations in that region.
Using synthetic monitoring—regular tests run from different parts of the world—helps identify regional issues early, so you can fix problems before they impact real users.
CDN Mapping and Routing Verification
CDNs use smart routing to direct users to the best edge servers based on their location, network health, and server load. But this routing doesn’t always work perfectly.
It’s important to verify that users are reaching the closest edge server. Testing can reveal if users are being sent to servers farther away, which can happen due to DNS misconfigurations or poor network peering between CDN nodes.
One way to check this is by comparing traceroute data from users to both the CDN edge servers and your origin servers. If the path through the CDN doesn’t reduce the number of network hops or improve speed compared to going directly to your origin, it means your CDN routing isn’t optimized.
Multi-CDN Performance Comparison
Using multiple CDN providers is a smart way to improve reliability and performance. To make the most of it, you need to monitor how each CDN performs.
Run tests from the same locations and request the same content through each CDN. This shows you which provider delivers faster or more consistently in different regions. It also gives you solid data when negotiating contracts or deciding where to route traffic.
You can also automate failover between CDNs. For example, if CDN A experiences slowdowns in Europe, your setup can automatically redirect traffic to CDN B to keep things running smoothly.
Know more about how to query multiple Prometheus metrics to analyze CDN performance in detail with Last9
How CDN Monitoring Works
To get the full picture of CDN, you need to combine several approaches that gather data from different sources and provide insights from multiple angles.
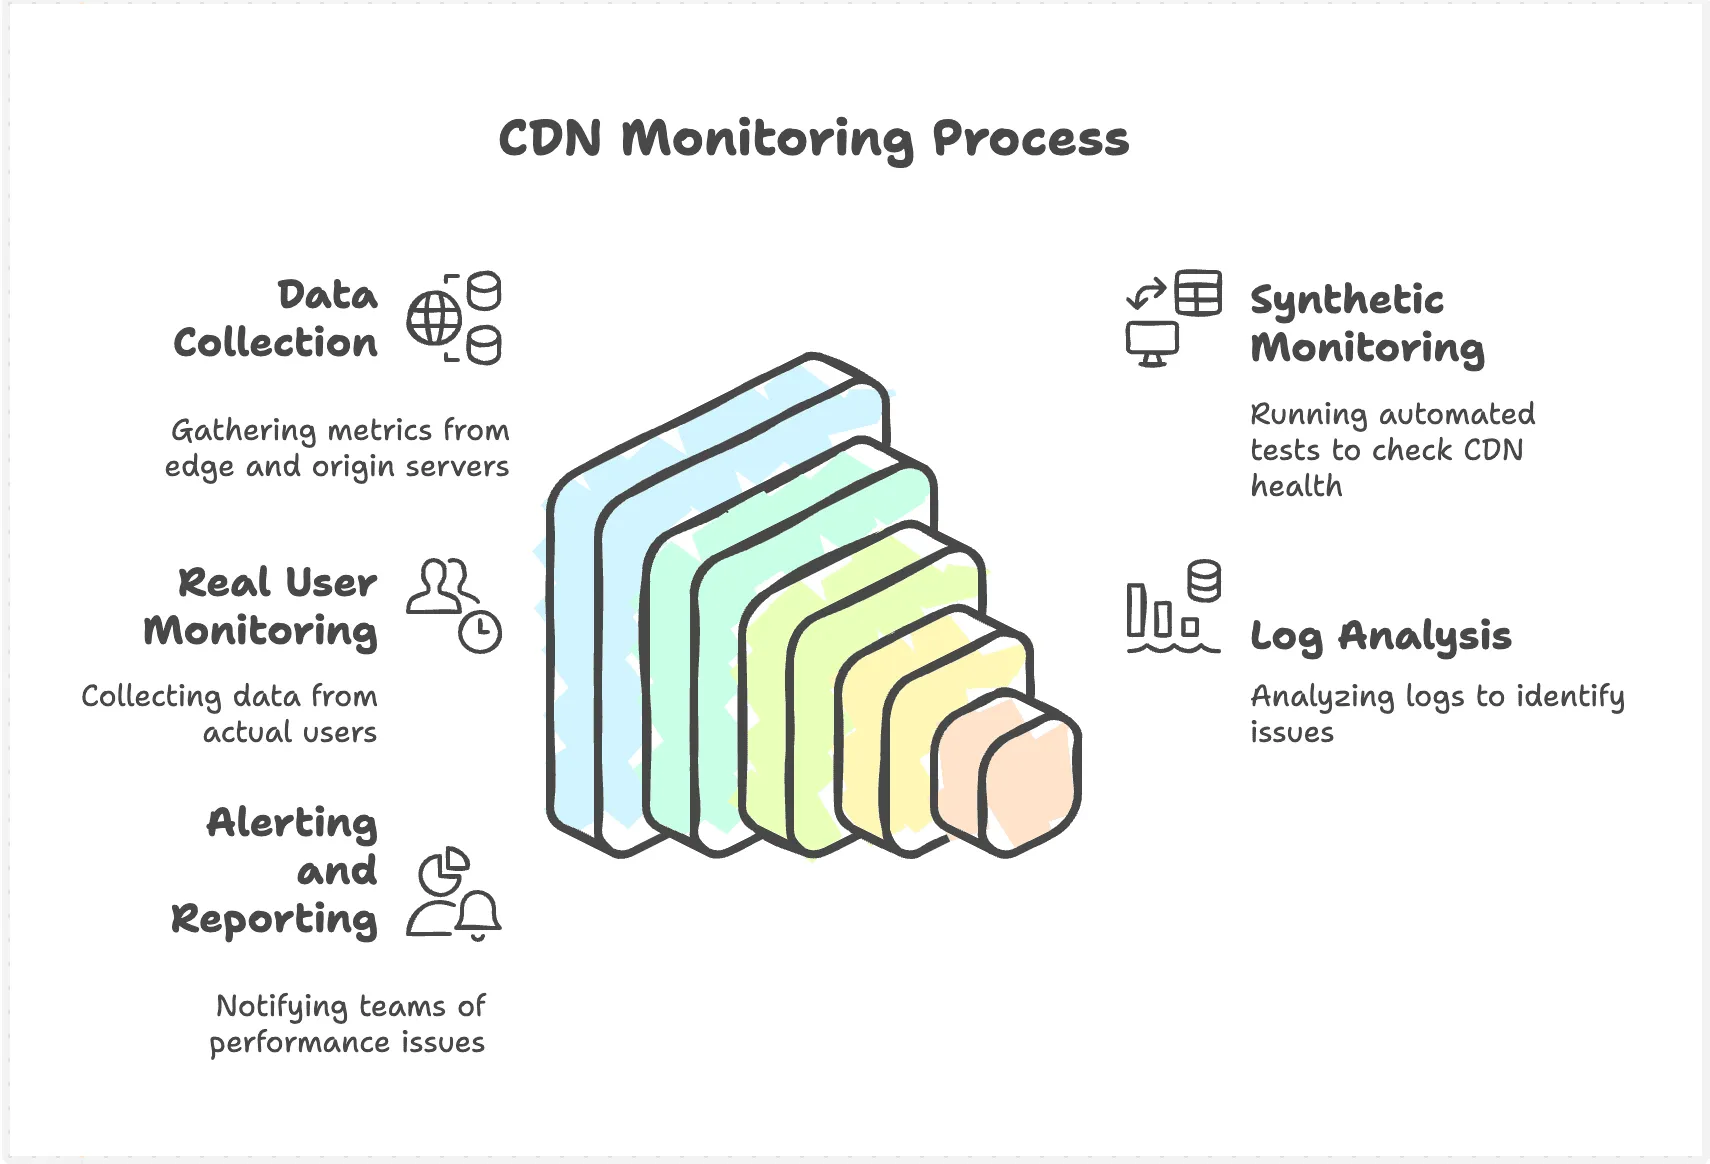
Data Collection
The foundation of CDN monitoring is collecting the right data. Your CDN’s edge servers report key metrics like response times, error rates, and cache hit ratios. At the same time, your origin servers share information about how quickly they serve fresh content when the CDN needs to fetch it. Finally, collecting data directly from users’ browsers or apps helps you understand the experience under real-world conditions.
Example: With Akamai or Cloudflare, edge server metrics and origin server logs provide raw data on delivery times and errors.
Synthetic Monitoring
To proactively check your CDN’s health, synthetic monitoring runs automated tests from multiple locations. These tests simulate user requests by regularly fetching important content and measuring availability, response times, and correctness. This approach helps you spot outages or slowdowns early, often before real users notice.
Example: Tools like Pingdom or Uptrends run scripted checks from global points to verify CDN uptime and responsiveness.
Real User Monitoring (RUM)
While synthetic monitoring tests from fixed points, Real User Monitoring gathers data from actual visitors. RUM captures how your CDN performs across different devices, browsers, and network types, including mobile or less reliable connections. This helps you see problems that synthetic tests might miss.
Example: Datadog RUM or New Relic Browser collect real user metrics, showing performance variations across geographies and device types.
To understand how Real User Monitoring (RUM) and Synthetic Monitoring differ in tracking CDN performance, explore our detailed comparison.
Log Analysis
Logs record every request and response processed by your CDN. Reviewing these logs allows you to identify error spikes, unusual traffic patterns, and caching inefficiencies. Log analysis is crucial when you need to dig deeper to troubleshoot issues or understand long-term trends.
Example: ELK Stack (Elasticsearch, Logstash, Kibana) or Last9 can ingest CDN logs and help visualize error rates, traffic volumes, and cache performance.
Alerting and Reporting
Finally, alerting systems notify your team when performance metrics cross defined thresholds, like rising error rates or increasing response times. Dashboards provide visual summaries that make it easier to track overall health and spot trends over time.
Example: PagerDuty or Opsgenie integrates with monitoring tools to send notifications based on custom alert rules.
Now that we know what to measure and how it works, let’s look at how to manage alerts without getting overwhelmed.
Managing CDN Alerts Without Overload
Monitoring a CDN involves many moving parts, which can lead to a flood of alerts. Without a clear plan, these alerts can overwhelm your team and make it hard to spot real problems. The key is to focus on alerts that matter and reduce unnecessary noise.
Start by setting practical thresholds. Not every small glitch requires an alert. Focus on issues that impact users or your service’s health. For example:
- Critical alerts for serious problems like a complete CDN outage, error rates above 50%, or response times consistently over 5 seconds.
- Warning alerts when cache hit ratios fall below 80% or response times double.
- Informational alerts for traffic spikes or new regions generating traffic—these are useful to know, but don’t require immediate action.
Next, use alert grouping or correlation. When your CDN has a problem, it’s common to receive many related alerts at once. Grouping these into a single notification cuts down noise and helps your team focus on the root cause.
Finally, define clear escalation policies. Not every alert should wake the whole team in the middle of the night:
- Minor issues can trigger automated responses or low-priority notifications.
- Moderate problems, like service slowdowns, notify the on-call engineer.
- Major outages escalate quickly to the full team so everyone can respond.
Last9 offers full monitoring support, including Alert Studio for advanced alerting and notifications. While challenges like coverage, fatigue, and cleanup affect all tools, Last9’s Pattern-based Alerting and Alert Manager built for High Cardinality help you stay ahead.
Key Practices for Reliable CDN Performance
Start with Business Metrics
It’s easy to get lost in technical details, but the real goal is understanding how your CDN affects your business outcomes. Focus on metrics that directly impact your users and revenue:
- User experience: Track how long pages take to load, bounce rates, and conversion rates. For example, if page load times increase, you might see higher bounce rates or lower sales.
- Revenue impact: Monitor failed transactions, abandoned carts, and user complaints. These issues can indicate CDN-related problems affecting your bottom line.
- SLA compliance: Keep an eye on uptime and performance thresholds defined in service agreements. Missing these targets can lead to penalties or loss of customer trust.
Technical metrics like latency or error rates are useful but should always be looked at in the context of these business goals.
Monitor the Whole Delivery Chain
Your CDN is only one part of a longer chain that delivers content to users. A problem anywhere—from your origin servers to third-party services—can slow down or break the experience. To avoid blind spots, monitor all these components:
- Origin servers: Check response times, error rates, and resource usage to catch backend issues before they affect the CDN.
- CDN edge servers: Track health, availability, cache hit ratios, and performance to ensure your CDN is serving content efficiently.
- DNS resolution: Slow or failing DNS lookups add delays before content even starts loading.
- SSL certificates: Expired or misconfigured certificates cause browsers to block content or warn users.
- Third-party dependencies: External APIs, analytics, or ads can slow down pages or cause errors that look like CDN problems but aren’t.
Test Like Your Users Do
No single monitoring method shows the full picture. Use a combination of:
- Synthetic monitoring: Automated tests run from fixed locations worldwide. They check your site consistently to catch outages or performance drops early.
- Real User Monitoring (RUM): Collects data from actual visitors on different devices, browsers, and networks. RUM reveals how your site performs in the real world, including issues that synthetic tests might miss, like slowdowns on mobile networks or specific browsers.
For a closer look at how synthetic monitoring works and where it fits in your CDN monitoring setup, check out this guide!
Common CDN Issues and How to Detect Them Early
DNS Configuration Problems
CDNs rely on DNS to route users to the right edge servers. If DNS is slow or misconfigured, users can face delays or errors.
- Slow DNS lookups, like 500ms instead of 50ms, add noticeable delay before the page starts loading.
- Some ISPs or regions might fail to resolve your CDN’s hostname, causing outages.
- Wrong CNAME records can send users to the wrong servers or cause errors.
- DNS changes take time to spread, so updates might not be consistent everywhere.
How to detect: Run synthetic DNS checks from multiple regions and set alerts for slow or failed lookups.
CDN Routing Problems
CDNs try to send users to the closest or fastest edge server. Sometimes this fails.
- Users in New York might get routed to servers in California, adding delay.
- Poor peering between CDN nodes can cause slow routes.
How to detect: Use traceroute and geographic tests to confirm users hit nearby servers. Look out for persistent latency or slow speeds in specific regions.
Cache Invalidation Issues
Sometimes old content sticks around after updates because cache invalidation didn’t reach all edge servers.
- Some users might see stale pages or assets after a deployment.
How to detect: Watch cache hit ratios after updates. Sudden drops or uneven behavior across regions can mean cache purges aren’t working properly.
Now, fix production CDN performance issues instantly—right from your IDE, with AI and Last9 MCP. Bring real-time production context — logs, metrics, and traces — into your local environment to troubleshoot faster.
Origin Server Overload
When cache hit ratios fall, more requests hit your origin servers, which can cause slowdowns.
- Slow origin responses cause CDN timeouts, further reducing cache hits in a feedback loop.
How to detect: Monitor origin server metrics like CPU, memory, and request latency along with cache hit ratios. Rising errors and slow responses tied to falling cache hits are red flags.
Geographic Performance Variations
CDN speed and reliability vary by region due to infrastructure and network differences.
- Your CDN might be fast in Europe but slow in Southeast Asia.
How to detect: Run synthetic and real user monitoring from all important regions. Compare latency and errors to spot trouble spots.
SSL Certificate and Security Issues
Expired or misconfigured SSL certificates break secure connections.
- Expired certificates cause browsers to block access or warn users.
- TLS handshake failures prevent secure connections.
- Mixed content warnings occur when HTTPS pages load insecure content.
How to detect: Monitor certificate expiry with advanced alerts. Track TLS errors and scan for mixed content regularly.
Advanced CDN Monitoring Strategies
Once you’ve got the basics covered, there are several practical ways to deepen your CDN monitoring.
If you’re using multiple CDN providers, splitting traffic between them is a good way to compare performance. Track things like:
- Response times in different regions
- Cache hit ratios for various content types
- Error rates during traffic spikes
- Cost per gigabyte transferred
This information helps you figure out which CDN works best in which area, allowing you to route traffic more effectively.
It’s also valuable to compare your CDN’s performance to direct origin server access. This helps you:
- Confirm whether your CDN is speeding up delivery
- Identify which content might load better straight from the origin, especially dynamic content
- Spot issues originating from your servers rather than the CDN
Many CDNs include automatic image optimization and compression features. To make sure these are working properly, monitor:
- File size reductions after optimization
- Frequency of format conversions, like to WebP
- Processing time for optimizations
- Whether mobile users receive the right optimized versions
Global Server Load Balancing (GSLB) plays a key role in traffic distribution. Keep an eye on:
- How traffic is split across edge servers to prevent overload
- Whether failovers work smoothly during outages
- If load balancing decisions factor in server health and user proximity
Finally, use historical traffic data to predict and prepare for spikes. For example, if traffic rises 30% every Friday evening, ensure your CDN can handle the extra load to avoid slowdowns.
Tools and Technologies for CDN Monitoring
To monitor your CDN effectively, it’s helpful to use a mix of tools that cover different aspects of performance and reliability. Here’s a quick overview:
| Tool Category | What It Does | Main Features | Popular Tools |
|---|---|---|---|
| Synthetic Monitoring | Runs tests from different locations | Regular checks, global coverage, uptime reports | Pingdom, Uptrends, Catchpoint |
| Real User Monitoring | Shows how real users experience your site | Data from actual browsers, geographic insights | New Relic Browser, Datadog RUM, Google Analytics |
| Log Analysis | Lets you dig into CDN activity | Tracks requests, finds errors, reveals traffic patterns | ELK Stack, Last9, Graylog |
| Alerting Platforms | Sends alerts when something goes wrong | Custom alerts, escalation policies, tool integrations | Last9, PagerDuty, Opsgenie, VictorOps |
Synthetic monitoring runs scheduled tests from various global locations to consistently check your CDN’s uptime and performance. Real User Monitoring (RUM) gathers data from actual visitors, showing how your site performs across different devices and networks.
Log analysis digs into request logs and error patterns to help you troubleshoot issues and understand traffic behavior. Alerting platforms notify your team as soon as problems arise, allowing you to respond quickly with customizable alert rules and escalation paths.
Together, these tools give you full visibility into your CDN’s health and help keep your service reliable.
Wrapping Up
Keeping your CDN healthy is crucial for delivering fast, reliable experiences to your users. Tracking the right metrics and catching issues early helps prevent disruptions before they impact your customers.
At Last9, we support monitoring for CDNs like Akamai, Fastly, Cloudflare, and more. Our platform brings logs, metrics, and traces together in one place, giving your team clear and actionable insights into CDN performance.
If you want better visibility across multiple CDN providers and easy-to-understand data to troubleshoot issues, Last9 can help you get there. Get started for free today!
FAQs
How often should I check my CDN monitoring metrics?
For critical applications, check key metrics every minute. Response times and availability need frequent monitoring, while bandwidth trends and cache hit ratios can be checked every 5-15 minutes. Set up real-time alerts for critical issues so you don’t need to watch dashboards constantly.
What’s a good cache hit ratio for my CDN?
Most applications should target 85-95% cache hit ratios, but this depends on your content mix. Static assets (images, CSS, JS) should hit 95 %+ while dynamic content might only reach 60-80%. Focus on improving ratios for your highest-traffic content first.
Should I monitor CDN performance from every country where I have users?
You don’t need monitoring from every country, but you should cover all major geographic regions where you have significant user bases. If 20% of your traffic comes from Europe, set up monitoring from 2-3 European locations. Quality matters more than quantity.
How do I know if my CDN monitoring alerts are working correctly?
Test your alerts regularly with controlled failures or synthetic issues. If you can’t remember the last time you received a test alert, you probably have monitoring gaps. Schedule monthly alert testing to verify your escalation policies work as expected.
What CDN metrics should trigger immediate pages to on-call engineers?
Page immediately for complete CDN failures, error rates above 10%, or response times over 5 seconds. Everything else can wait for business hours unless it affects revenue-generating functionality. Adjust thresholds based on your specific SLA requirements.
How long should I retain CDN monitoring data?
Keep high-resolution data (minute-level) for 30 days, hourly summaries for 1 year, and daily summaries for 2-3 years. This gives you enough detail for immediate troubleshooting while maintaining long-term trends for capacity planning and performance analysis.

