
If you’re building high-performance systems, Golang has probably earned a spot in your stack. Its speed, lightweight concurrency, and quick compile times make it ideal for scalable APIs, microservices, and distributed systems.
But those same qualities that make Go powerful can make performance monitoring tricky. Goroutines run fast and in parallel, which means a simple CPU or memory graph doesn’t always tell you what’s slowing things down.
To understand what’s really happening inside your Go services, you need an APM that can follow requests across functions, trace latency, and show context-not just numbers. That’s what separates good observability from guesswork.
Why Go Apps Need Performance Monitoring
Performance issues in Go aren’t always obvious. A few slow goroutines or subtle memory leaks can quietly affect your latency, throw off SLOs, and frustrate users long before you notice. If you’re building Go services, Application Performance Monitoring (APM) isn’t just another tool - it’s how you keep your systems fast, predictable, and easy to debug.
Why Go Needs Its Own Kind of APM
Go isn’t like most other runtimes, and that’s exactly why it needs a different approach to monitoring.
1. Goroutines and Concurrency
Go’s lightweight concurrency model is both a strength and a challenge. Thousands of goroutines can run in parallel, each communicating through channels. A solid APM should help you see how these goroutines behave - which ones are blocked, which are waiting, and where time is being spent. Without that visibility, tracking down slowdowns or deadlocks becomes guesswork.
2. Garbage Collection and Latency
Go’s garbage collector is efficient, but even brief pauses can hurt latency-sensitive applications. Your APM should measure GC cycles, pause durations, and heap usage to help you optimize memory and keep latency predictable.
3. Minimal Runtime, Limited Introspection
Go’s runtime is intentionally lean - great for performance, but light on built-in diagnostics. A good APM fills that gap by capturing metrics, traces, and profiles efficiently, without adding heavy overhead to your application.
4. Built for Microservices
Most Go apps power distributed systems - multiple services talking to each other. You need an APM that can trace a single request across those services, pinpoint latency hotspots, and show dependencies clearly. That’s what makes distributed tracing essential for Go environments.
5. Static Binaries, Smart Instrumentation
Go binaries are static by design, which means your APM can’t depend on dynamic linking or agents that attach after deployment. The ideal solution integrates during the build process or uses lightweight profiling that doesn’t interfere with runtime performance.
The Limits of Generic Monitoring Tools
It’s tempting to stick with a single, all-purpose APM solution - one dashboard for everything, one contract to manage. But when it comes to Go, that approach often leaves you with blind spots rather than clarity.
Here’s why general-purpose APMs struggle with Go:
1. Limited Visibility into Go’s Runtime
Most generic tools surface top-level stats like CPU, memory, and network I/O. They’re useful, but not enough to understand what’s really happening inside your Go services. You need deeper context - goroutine states, garbage collection (GC) timings, and function-level latency - to diagnose performance issues accurately.
2. Harder Root Cause Analysis
When latency spikes or throughput drops, you need to know why. Without Go-specific telemetry, it’s difficult to tell if the issue lies in goroutine contention, GC pauses, or downstream dependencies. You end up guessing, not debugging.
3. Added Overhead from Heavy Instrumentation
Some APMs try to bridge the gap by instrumenting code more aggressively. That can increase overhead, adding latency to the very systems you’re trying to monitor. A Go-native approach minimizes this risk by using lightweight hooks designed for Go’s runtime.
4. Gaps in Developer Experience
If you work in Go daily, you want insights that match how you write and deploy code. Generic dashboards often display metrics in language-agnostic ways, leaving you to interpret what they mean for goroutines, memory allocations, or channel behavior. Tools built with Go in mind speak your language - literally and technically.
5. Incomplete Distributed Tracing
Go services often use lightweight RPC frameworks and communicate over custom protocols. Generic APMs may not capture these traces completely, leading to broken spans or missing data. A Go-optimized tracer ensures continuity across microservices, helping you see the full request path.
When you understand how Go behaves, you can monitor it more intelligently. Choosing the right APM isn’t about spending more - it’s about getting visibility that matches how your services actually run.
11 Leading APM Solutions for Golang
Choosing the right APM for Go is about finding a tool that truly understands the language - its concurrency model, its runtime behavior, and its microservice-driven deployment style.
Let’s look at how today’s leading solutions compare, starting with Last9.
1.Last9 - Purpose-Built for Go-Native Observability
At Last9, we’ve built our platform around how Go applications actually behave in production. Go’s concurrency, lean runtime, and distributed nature demand more than surface-level metrics - they need observability that understands Go from the inside out.
We offer full visibility across traces, metrics, and logs - no proprietary agents, no black-box integrations.
How We Help Go Teams
1. OTel-Native Instrumentation
Instrument your Go services using standard OpenTelemetry SDKs - no custom agents or hidden hooks. Whether you’re tracing gRPC calls, HTTP handlers, or database queries, our platform integrates cleanly into your stack.
2. Streaming Aggregation for High Volume
Go’s concurrency can create millions of short-lived spans. Our Streaming Aggregation engine processes telemetry in motion - before it hits storage - so you get high-cardinality visibility without unpredictable costs.
3. Automatic Service & Job Discovery
Once your Go services start sending traces, we automatically map every service, job, and dependency - no YAML edits or manual tagging. Perfect for dynamic, fast-changing environments.
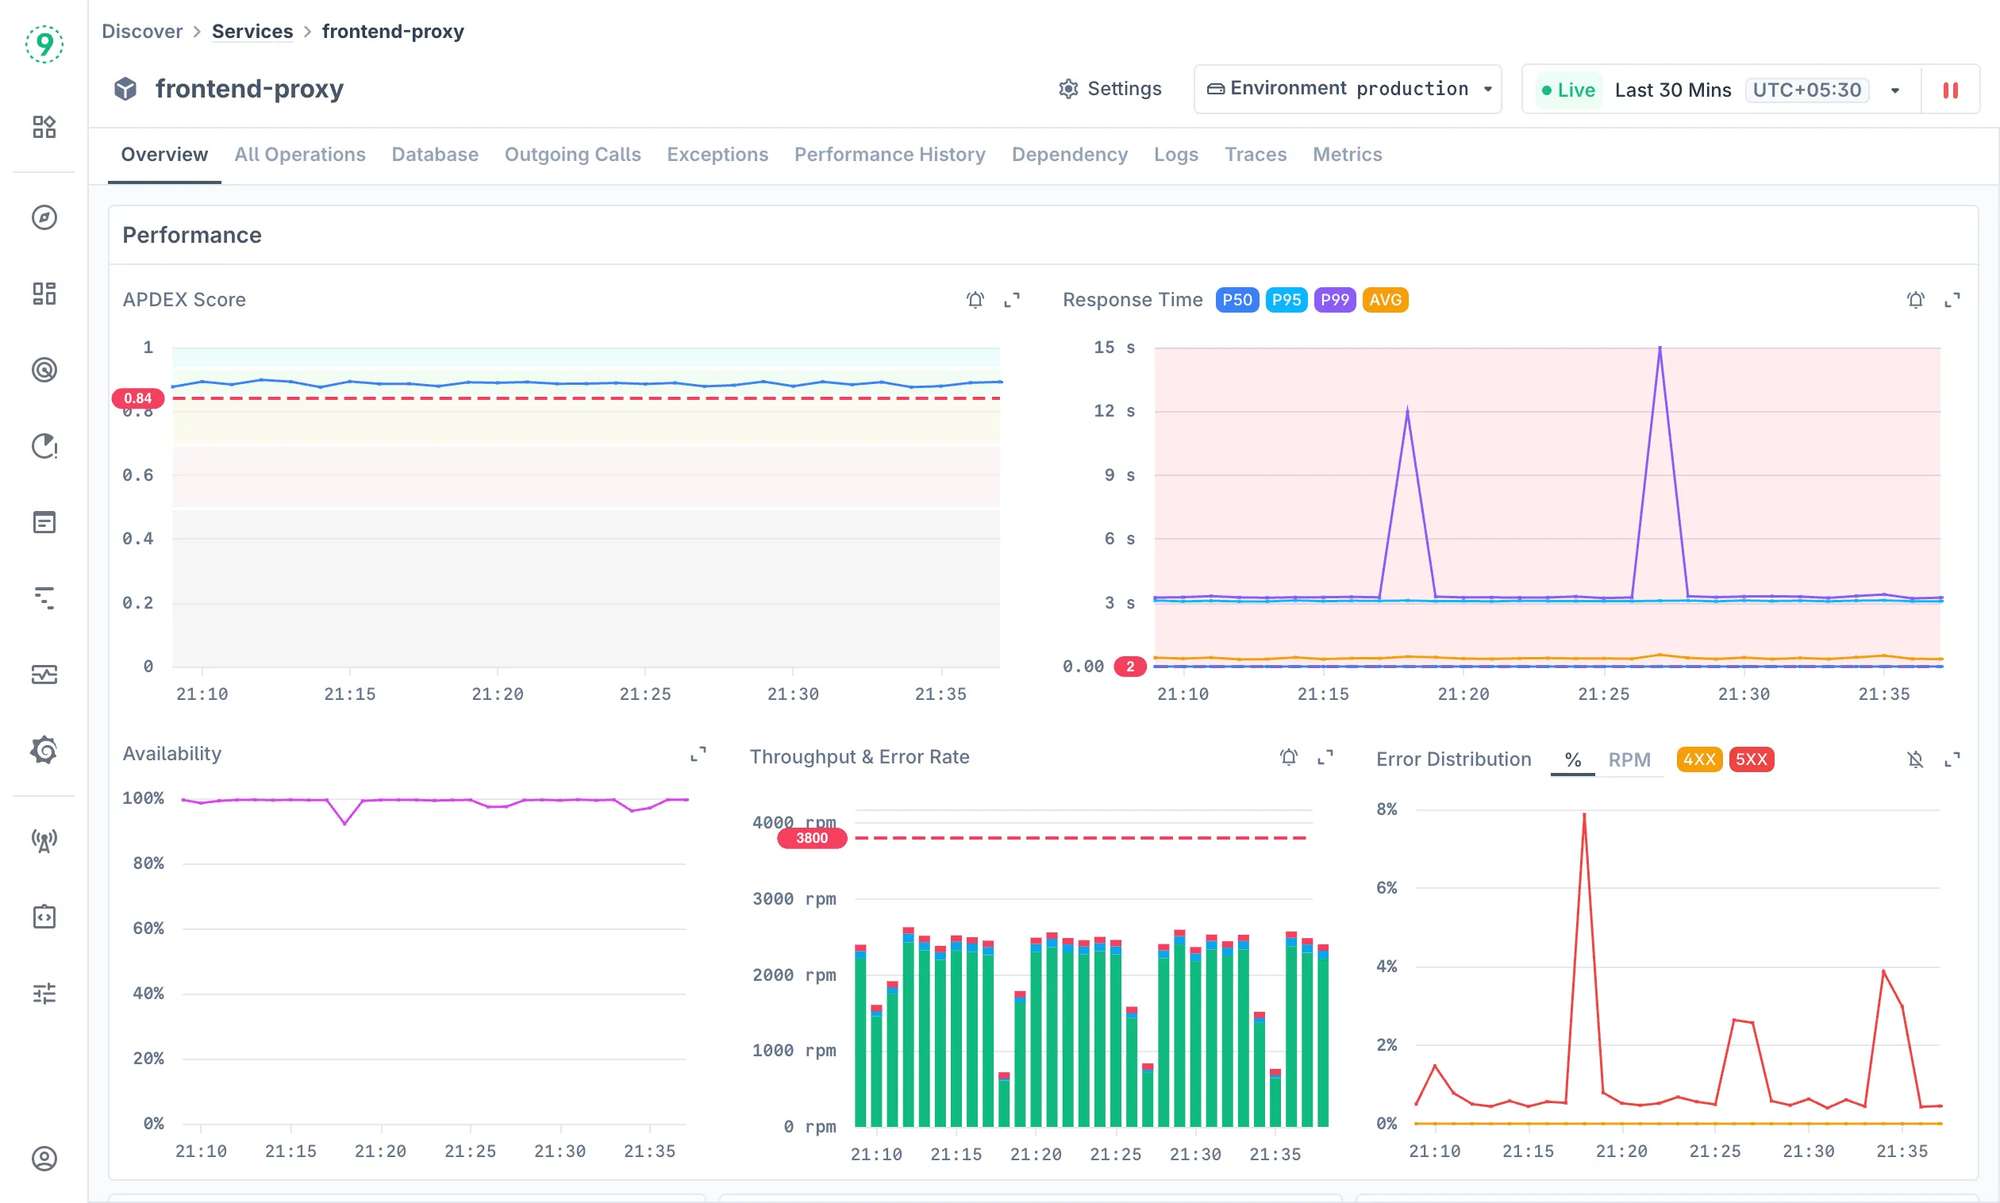
4. Unified Traces, Metrics & Logs
When something slows down, you shouldn’t have to jump across dashboards. We correlate traces, metrics, and logs so you can move from a latency spike to the exact trace - and the precise log line - in seconds.
5. Lightweight Data Pipeline
Our ingestion pipeline follows OpenTelemetry Collector principles, keeping overhead low and performance intact. You get detailed insights without impacting runtime speed.
Pricing
Our pricing is simple and transparent - no hidden usage tiers.
- Free plan: 100M events, 5 users, 7-day retention.
- Pro plan: starts at $850/month, includes streaming aggregation, extended retention, and SLA-backed uptime.
- Enterprise: custom pricing with flexible retention and BYOC deployment.
We believe in transparent pricing - you should always know what you’re paying for and what you get. Our Free plan includes 100M events, 5 users, and 7-day retention. The Pro plan starts at $850/month for expanded usage and longer retention.
2.Uptrace - OpenTelemetry-Based APM for Go
Uptrace is one of the newer observability tools built entirely on OpenTelemetry, making it a solid choice if you’re running Go services and prefer open standards. It focuses on simplicity and speed - helping teams visualize traces and metrics without heavy setup or complex pricing.
What Makes It Useful for Go
1. OpenTelemetry-First Architecture
Uptrace doesn’t reinvent instrumentation. You use the official OpenTelemetry Go SDK to collect spans and metrics, then point your exporter to the Uptrace endpoint. This ensures vendor neutrality and lets you migrate or combine backends easily.
2. Clean UI and Query Support
The platform uses a SQL-like query language to filter traces and metrics. You can quickly spot latency spikes, slow database queries, or inefficient goroutine usage. It’s lightweight enough for small teams, yet flexible for larger systems.
3. Self-Hosting Option
For teams that prefer full control, Uptrace offers a self-hosted deployment mode. This makes it appealing for compliance-sensitive organizations that can’t ship telemetry data outside their environment.
4. Built for Developers
Uptrace doesn’t try to be an all-in-one enterprise suite. It’s focused on developers who want direct insight into their applications - no noisy dashboards or generic KPIs, just data you can act on.
Pricing
Uptrace has a free community edition for self-hosting, and its cloud version starts around $5 per million spans - one of the more transparent pricing models among OTel-based tools.
It’s a good fit if you’re looking for a lean, standards-based APM that integrates neatly into an OpenTelemetry workflow without complex onboarding.
3.Helios - Observability for Go’s Async Workflows
Helios focuses on making tracing more usable for developers, especially in distributed or asynchronous Go systems. It’s not a traditional APM-it’s a tracing platform designed to give you end-to-end visibility into how requests move through queues, background jobs, and APIs.
What Makes It Stand Out for Go
1. Built Around OpenTelemetry
Helios supports OpenTelemetry out of the box. You instrument your Go services with the standard OTel SDK, and Helios automatically reconstructs trace flows, showing how requests propagate across services, queues, and async tasks.
2. Context-Aware Debugging
Instead of just showing spans, Helios links each trace with payloads, headers, and metadata so you can replay real execution paths. For Go developers dealing with concurrency or event-driven systems, this makes it easier to understand where requests stall or fail.
3. Developer-First UX
The platform integrates with your workflow tools-GitHub, VS Code, CI pipelines-so you can visualize traces directly where you work. It’s designed to shorten feedback loops instead of adding another dashboard to check.
4. Lightweight Setup
No agents or sidecars required. You point your OpenTelemetry exporter to Helios and start getting traces in minutes.
Pricing
Helios offers a free tier with limited traces and team members, with paid plans starting around $99/month, depending on data volume and retention.
It’s a strong option if your Go services rely heavily on async processing or background workers, where understanding message flow is as important as tracking latency.
4.Aspecto - API-Level Observability for Go Services
Aspecto focuses on API and event-driven observability, which makes it especially useful for Go applications that rely on microservices, message queues, or event buses. Instead of broad infrastructure metrics, it zeroes in on how your APIs behave and interact across distributed systems.
Why It’s Useful for Go Developers
1. OpenTelemetry Support from Day One
Aspecto runs on OpenTelemetry data. You can instrument your Go applications using the standard OTel SDK and send data directly to Aspecto - no proprietary agents or setup complexity. This makes it easy to fit into existing Go observability pipelines.
2. Visualizing API Interactions
It automatically maps your API dependencies, showing how services talk to each other - including payloads, headers, and response times. For Go engineers working with gRPC or REST, it helps uncover issues like missing retries, broken contracts, or long-tail latency.
3. Pre-Production and CI/CD Visibility
One of Aspecto’s standout features is that it also works during local development and CI. You can test API behavior before deploying, tracing requests as they move through mock or staging environments. That’s a big advantage if your Go services are part of a complex microservice mesh.
4. Lightweight and Developer-Centric
Setup is simple: export your OpenTelemetry traces to Aspecto, and it auto-detects service boundaries. The UI focuses on readability and context rather than dashboard sprawl.
Pricing
Aspecto provides a free developer plan with limited traces and environments, with paid tiers starting at around $49/month per project. It’s best suited for engineering teams who want to catch integration issues early - before they reach production.
5.Lightstep - Distributed Tracing for Complex Go Systems
Lightstep, now part of ServiceNow, is one of the earliest platforms to take distributed tracing mainstream. It’s built for high-scale, microservice-heavy environments - including Go backends running hundreds or thousands of concurrent processes.
Why It Works Well for Go
1. Deep Distributed Tracing
Lightstep’s tracing engine is designed for systems where requests span multiple services, queues, and databases. For Go applications, this means you can trace a single request across goroutines, RPC calls, and external dependencies - all visualized in a timeline view.
2. Strong OpenTelemetry Integration
Lightstep has been involved with OpenTelemetry since its inception. You can instrument your Go services with the official OTel SDK and export traces directly, avoiding vendor lock-in or proprietary agents.
3. Powerful Aggregation and Analysis
Once data lands in Lightstep, you can group traces by service, endpoint, or latency percentile. For Go workloads, that makes it easier to isolate issues like long GC pauses, slow external calls, or goroutine contention without scrolling through raw spans.
4. Focused on SLOs and Dependencies
Lightstep connects observability data to reliability goals. You can tie trace metrics to service-level objectives (SLOs) and visualize how a Go service’s latency affects overall application health. It’s especially valuable for teams running distributed systems at scale.
Pricing
Lightstep offers a free tier for small teams and proof-of-concepts, while paid plans start at around $100/month, depending on data volume and retention. Enterprise pricing includes longer trace storage, custom dashboards, and SLO tracking.
Lightstep is a strong fit for teams running Go microservices at scale - especially if your focus is on distributed performance and reliability rather than just metrics.
6.AppSignal - Simple, Developer-Centric APM for Go
AppSignal focuses on making APM simple for developers rather than platform engineers. It’s lightweight, quick to set up, and ideal for small to medium Go teams that want meaningful performance insights without dealing with complex dashboards or config sprawl.
Why It’s a Good Fit for Go
1. Easy Setup
You add a few lines of code or import the AppSignal Go library, and you’re up and running. It auto-instruments standard Go libraries like net/http, database/sql, and grpc, capturing slow requests, errors, and throughput automatically.
2. Error Tracking Meets Performance
Unlike tools that focus purely on traces, AppSignal pairs APM data with real error reports and contextual metadata. You can see which request triggered the error, what the runtime looked like, and how it affected end-user latency - all from a single timeline.
3. Built-In Metrics and Dashboards
The Go agent exports custom metrics like goroutine count, GC pauses, and heap usage, with out-of-the-box charts that don’t require additional configuration. It’s a straightforward way to track memory pressure or identify slow database operations.
4. Minimal Overhead
The agent is designed to be light on resources. It batches and compresses data before sending it, making it suitable even for latency-sensitive Go services.
Pricing
AppSignal offers a 14-day free trial, after which plans start at around $19/month per host. You can scale usage by event volume, with pricing that stays predictable for smaller teams.
AppSignal is ideal if you want production visibility without the operational weight of managing collectors, dashboards, or storage backends - just quick setup and clear, actionable data.
7.Groundcover - eBPF-Based Observability for Go
Groundcover takes a different path from most APMs. Instead of requiring instrumentation or agents inside your Go code, it uses eBPF - a Linux kernel technology that captures telemetry directly from runtime and network layers. This means you get deep visibility into your Go applications without modifying a single line of code.
Why It’s Interesting for Go Teams
1. Zero Instrumentation Setup
You deploy Groundcover as a Kubernetes DaemonSet, and it automatically observes your Go services - tracing requests, network calls, and system performance. For fast-moving teams, this saves hours of setup time normally spent wiring SDKs or exporters.
2. Broad Telemetry Coverage
It monitors everything from API latency and error rates to resource usage and network traffic. While it doesn’t replace OpenTelemetry, it complements it - ideal if you want instant observability for Go microservices while gradually layering in OTel-based traces.
3. Real-Time Data Visualization
Groundcover presents metrics and traces in a unified dashboard. You can drill down into service dependencies, identify hotspots, or trace a slow request path through multiple Go processes - all without rebuilding or redeploying code.
4. Lightweight and Secure
Because it runs at the kernel level, Groundcover introduces almost no overhead to Go applications. It’s read-only by design, so it observes rather than interferes - suitable for production workloads that demand performance isolation.
Pricing
Groundcover offers a free plan for up to a few nodes, with paid plans starting around $250/month based on data volume and environment size. It’s an appealing choice for Go teams running on Kubernetes who want near-instant visibility - especially when instrumenting every service isn’t practical.
8.Grafana Tempo - OpenTelemetry Tracing at Scale
Grafana Tempo is a distributed tracing backend designed to handle massive volumes of trace data - perfect for Go services producing high concurrency and short-lived spans. Built by the Grafana Labs team, it integrates natively with OpenTelemetry, Prometheus, and Loki, forming a complete observability stack.
Why It Works Well for Go
1. OTel-Native by Design
Tempo ingests data directly from OpenTelemetry collectors. If your Go services already use OTel SDKs, you can export traces to Tempo with minimal configuration. No custom agents, no proprietary formats - just clean, standard OTLP data.
2. Cost-Efficient Trace Storage
Unlike traditional APMs, Tempo doesn’t rely on indexing. It stores traces in object storage (like S3 or GCS) and uses trace IDs for retrieval. This approach drastically cuts costs while still letting you query traces through Grafana or APIs.
3. Seamless Integration with Grafana Stack
If you already use Grafana for metrics and Loki for logs, Tempo slots in effortlessly. You can jump from a Go metric spike in Prometheus to related traces in Tempo and even drill into logs - all in the same UI.
4. Built for Scale
Tempo was designed for high-throughput environments where Go workloads might generate millions of spans per minute. It’s horizontally scalable, fault-tolerant, and lightweight enough to run in your own infrastructure.
Pricing
Grafana Tempo is open source and free to self-host. For managed deployments, Grafana Cloud offers Tempo as part of its observability suite, starting around $20/month for basic usage.
Tempo is a strong fit for Go teams who want full OpenTelemetry compatibility, control over their data, and a cost-effective tracing backend that scales effortlessly.
9.Elastic APM - Go Tracing within the Elastic Stack
Elastic APM extends the Elastic Stack’s reach beyond logs and metrics into application performance. If you’re already using Elasticsearch and Kibana, Elastic APM is a natural addition for tracing your Go services.
Why It Works Well for Go
1. Native Go Agent
Elastic provides a Go agent that auto-instruments common libraries like net/http, database/sql, and gin. It captures spans, errors, and request timings out of the box.
2. Tight Integration with Elastic Stack
All telemetry - logs, metrics, and traces - flows into Elasticsearch. You can correlate slow transactions in APM with related log entries or infrastructure metrics in one query.
3. Flexible Deployment
Elastic APM can be self-hosted or used via Elastic Cloud, giving teams full control over data retention and cost.
Pricing
Elastic APM is open source, with Elastic Cloud plans starting at about $95/month, depending on usage. It’s a good fit for Go teams already using the Elastic Stack and looking to add distributed tracing without introducing new tooling.
10.Sentry - Error Tracking That Doubles as APM for Go
Sentry began as an error-tracking platform, but it now includes full APM capabilities. For Go developers, it bridges the gap between crash monitoring and performance tracing - ideal for debugging production issues with context.
Why It’s Useful for Go
1. Unified Errors and Traces
Sentry captures errors, stack traces, and performance spans in the same timeline. You can see which function failed, how it affected response time, and what user actions triggered it.
2. Lightweight Instrumentation
You install the Sentry Go SDK, set your DSN, and it begins capturing transactions automatically for net/http you, and database/sql. It’s one of the simplest setups among APMs.
3. Developer-Centric Workflow
Sentry integrates directly with GitHub, GitLab, and Slack. You can track a regression from code commit to production incident without leaving your workflow.
Pricing
Sentry offers a free tier for small teams, with paid plans starting at $26/month, based on the number of transactions. It’s perfect for Go developers who want observability tied directly to source code and real-world errors - not just metrics.
11.Instana - Runtime Insights for Go Applications
Instana (now part of IBM) focuses on automatic discovery and low-overhead instrumentation. It’s designed for dynamic microservice environments where Go is often a key component.
Why It’s Useful for Go
1. Auto-Instrumentation
Instana automatically detects Go services and instruments supported frameworks without manual configuration. It tracks request flow, dependencies, and latency across containers and Kubernetes clusters.
2. Real-Time Dependency Graphs
It builds live service maps that visualize how your Go services communicate with others. This helps pinpoint latency sources or resource bottlenecks immediately.
3. Context-Rich Traces
Instana correlates Go traces with infrastructure metrics, showing how runtime behavior (like CPU spikes or GC cycles) affects response time.
Pricing
Instana pricing starts at around $75 per host/month, with enterprise-grade options for large deployments. It’s a strong choice for teams that value automation and want to spend minimal time configuring instrumentation.
How to Choose the Right APM for Go Apps
The right choice depends on your architecture, workflows, and the kind of problems you actually face in production.
Start with the basics: what’s really slowing you down?
- Are goroutine leaks or deadlocks hard to reproduce?
- Do latency spikes appear and disappear without a clear cause?
- Is tracing across multiple Go services incomplete or inconsistent?
- Or does every production incident take hours to debug?
Once you identify those recurring pain points, focus on features that genuinely solve them. For Go applications, you’ll usually need:
- Visibility into goroutines and concurrency patterns.
- Continuous profiling with GC and memory insights.
- Distributed tracing that connects Go and non-Go services.
- Simple instrumentation for frameworks like gRPC, Gin, or Kafka.
- Dashboards and alerts that make debugging faster, not noisier.
Every team’s setup is unique, so check how well each tool fits into your environment. If you’re on Kubernetes, you’ll want an APM that can scale horizontally and visualize service dependencies.
If you’re tied to a specific cloud, look for native integrations - AWS X-Ray, for example, plugs easily into Go environments running on ECS or Lambda. And if cost predictability matters, understand how the tool bills for events or spans before you commit.
Before finalizing, run a short proof of concept instead of relying on docs or demos.
Pick two or three contenders, instrument a couple of Go services, and simulate a realistic load. See which one helps you find a CPU-hungry function or a goroutine leak faster. Measure overhead, ease of setup, and how intuitive the UI feels to the people who’ll use it daily - your developers and SREs.
Finally, don’t overlook support and community. Even the best APM falls short if the documentation is outdated or the support team doesn’t understand Go.
Look for clear guides, responsive help channels, and an active community sharing configurations and best practices. A tool that evolves with OpenTelemetry and Go’s runtime changes will stay useful longer than one that just looks good on a dashboard.
Last9 Adapts to Your Go Stack
Every Go application behaves differently - which is why APM shouldn’t be one-size-fits-all.
At Last9, we’ve built observability that adapts to your needs instead of forcing you into rigid workflows. You get full-fidelity telemetry, simple OpenTelemetry setup, and performance insights that scale with your system - not against it.
Getting started just takes a few minutes, or if you'd like to know more about how the platform fits into your setup, book some time with us!
FAQs
What does APM stand for?
APM stands for Application Performance Monitoring. It’s the practice of tracking how your applications behave in production - including latency, throughput, errors, and resource usage - to help you detect and fix performance issues faster.
What is the difference between APM and logging?
Logging captures discrete events (like errors or warnings) in text form.
APM provides a broader view - combining traces, metrics, and logs to show how your application performs end-to-end. Logs tell you what happened, while APM helps you understand why and where it happened.
Is Splunk an APM?
Splunk started as a log analytics tool but now offers Splunk Observability Cloud, which includes APM capabilities. It’s a full observability suite that combines metrics, traces, and logs - but its APM features are separate from the core logging product.
Can you build an app with Golang?
Absolutely. Go (or Golang) is one of the most popular languages for building high-performance APIs, distributed systems, and backend services. Its simplicity, speed, and built-in concurrency make it ideal for cloud-native and microservice architectures.
How do you manage config in your applications?
Go developers often manage configuration through:
- Environment variables (e.g., via
os.Getenv) - Configuration files in YAML or JSON (using packages like
viperorenvconfig) - Secrets managers from cloud providers (AWS Secrets Manager, GCP Secret Manager)
For production-grade setups, environment variables or managed secrets are preferred to avoid hardcoding sensitive data.
What is the best free logs monitoring tool with a great dashboard UI in 2025?
A few strong free options stand out:
- Loki + Grafana – lightweight, open-source, and ideal for structured logs from Go services.
- OpenObserve – a newer open-source platform with a polished dashboard and unified storage.
All three work well with Golang and OpenTelemetry.
What’s your logging, monitoring, and observability stack for a Golang app?
A typical modern Go stack looks like this:
- Logs: Loki, Elasticsearch, or Fluent Bit
- Metrics: Prometheus, OpenTelemetry Metrics, or Last9
- Traces: OpenTelemetry + a backend like Grafana Tempo, Last9, or Jaeger
- Dashboards: Grafana or Last9’s visual interface
This combination covers real-time metrics, historical data, and root-cause debugging.
What can I use for monitoring or tracking custom events and metrics?
OpenTelemetry SDKs are now the go-to standard. They let you define custom spans, metrics, and attributes directly in Go code. You can then export data to any backend (Last9, Prometheus, Datadog, Tempo, etc.) for visualization and alerting.
How much CPU and memory overhead does APM add?
It depends on the tool and how it’s configured. In most Go environments:
- Lightweight, OTel-based instrumentation adds <2% CPU and ~50MB memory overhead.
- Heavy agents or full-stack profilers can increase resource use by 5–10%.
Testing overhead in a staging environment before rollout is a best practice.
How can I integrate APM with a Golang application?
Most APMs support Go through the OpenTelemetry SDK. You typically:
- Install the SDK (
go.opentelemetry.io/otel). - Initialize a tracer and exporter (to Last9, Tempo, or another backend).
- Wrap handlers or middleware for HTTP, gRPC, or database calls.
- Run the OpenTelemetry Collector to forward telemetry data.
This setup captures traces, metrics, and logs from your Go services without heavy code changes.
What are the best practices for implementing APM in a Golang application?
- Use OpenTelemetry as your standard - it’s portable and vendor-neutral.
- Start small: instrument critical paths first (APIs, DB queries, external calls).
- Measure overhead before deploying to production.
- Aggregate data early (via an OTel Collector) to avoid storage bloat.
- Correlate traces, metrics, and logs for faster debugging.
- Choose a backend (like Last9) that scales with your telemetry volume and budget.