

Spring Boot uses SLF4J with Logback by default, giving you out-of-the-box logging that you can configure through application.properties or custom XML files to control log levels, formats, and outputs across your application.
Most Spring Boot developers start with console logging during development and quickly realize they need more when moving to production. You'll want structured logs for searchability, async appenders for performance, and distributed tracing context when debugging across microservices. The challenge isn't getting logs—it's making them useful without tanking performance or drowning in noise.
This guide covers the full spectrum: basic Logback configuration, advanced techniques like AOP and MDC, performance optimization strategies, and when to stop managing your own logging infrastructure.
Why Does Logging Matter in Spring Boot Applications?
Logging is how you understand what your application is actually doing in production. When a payment fails at 3 AM, your logs are the first place you look. When response times spike during a product launch, logs tell you which database query is causing the bottleneck.
Spring Boot's logging setup handles everything from simple debug statements to complex distributed tracing scenarios. The framework gives you flexibility—SLF4J as the API layer means you can swap Logback for Log4j2 without touching application code. You can log to the console during development, files in staging, and remote aggregators in production.
The real value shows up when something breaks. Without proper logging, you're guessing. With it, you can trace a request from the API gateway through three microservices, see exactly where it failed, and understand why. That's the difference between a 5-minute fix and a 5-hour war room.
Get Started with Spring Boot Logging
Spring Boot uses SLF4J (Simple Logging Facade for Java) as the default logging API. This acts as an abstraction layer—your application code logs to SLF4J, and the actual logging implementation (Logback, Log4j2, or others) sits underneath. You can swap implementations without changing your code.
The default implementation is Logback. It's mature, well-tested, and handles most use cases without additional configuration. If you don't create any custom config files, Spring Boot uses sensible defaults: INFO-level logging to the console, with timestamps and thread names included.
Default Logging Configuration
When you create a new Spring Boot application, logging works immediately. No setup required. Run your app, and you'll see output like this:
2024-12-04 10:23:45.123 INFO 12345 --- [main] c.e.Application : Starting ApplicationThat's Logback using Spring Boot's default configuration. It logs at INFO level and above (WARN, ERROR) but filters out DEBUG and TRACE. The format includes timestamp, log level, process ID, thread name, logger name, and the actual message.
Customize with Logback Configuration
To customize logging, create a logback-spring.xml file in src/main/resources. Spring Boot will automatically pick it up. Here's a minimal example:
<configuration>
  <appender name="CONSOLE" class="ch.qos.logback.core.ConsoleAppender">
    <encoder>
      <pattern>%d{yyyy-MM-dd HH:mm:ss} - %msg%n</pattern>
    </encoder>
  </appender>

  <root level="INFO">
    <appender-ref ref="CONSOLE"/>
  </root>
</configuration>
This strips down the format to just timestamp and message. The <appender> defines where logs go (console, file, network socket). The <root> section sets the default log level and which appenders to use.
You can also configure logging through application.properties for simpler cases:
logging.level.org.springframework.web=DEBUG
logging.level.com.yourcompany=TRACE
This sets Spring Web framework to DEBUG and your company's packages to TRACE. It's quick for development but doesn't give you control over formatting or appenders.
What Log Levels Does Spring Boot Support?
Spring Boot supports six log levels, from most verbose to least:
- TRACE – Extremely detailed, shows code flow. Use sparingly, only during deep debugging.
- DEBUG – Detailed diagnostic info. Good for development, avoid in production.
- INFO – General operational messages. Application startup, major events. Default for production.
- WARN – Something unexpected happened, but the app continues. Deprecated API usage, configuration issues.
- ERROR – Something failed. The app might continue, but functionality is broken.
- FATAL – Critical failure usually means the app is shutting down.
Most production systems run at INFO or WARN. You temporarily enable DEBUG for specific packages when troubleshooting, then turn it back off.
Advanced Methods for Optimizing Spring Boot Logging
Basic logging gets you 80% of the way there. But when you're running distributed microservices with high request volumes, you need more sophisticated approaches.
Aspect-Oriented Programming (AOP) keeps logging separate from business logic. Mapped Diagnostic Context (MDC) adds request tracking across thread boundaries. Asynchronous logging prevents blocking your main application threads.
These techniques address real production problems: performance overhead, context loss in concurrent operations, and maintainability when logging is scattered across your codebase.
1. Aspect-Oriented Programming (AOP) for Logging
AOP lets you inject logging behavior without modifying your business logic. Instead of adding logger.info() calls to every method, you define an aspect that automatically logs method entry, exit, parameters, and exceptions.
This is particularly useful for service layer methods where you want consistent logging without cluttering the code. It also makes it easier to change logging behavior later—update the aspect instead of hunting through dozens of classes.
Example: Using AOP for Method-Level Logging
First, add the Spring AOP dependency if it's not already included:
<dependency>
    <groupId>org.springframework.boot</groupId>
    <artifactId>spring-boot-starter-aop</artifactId>
</dependency>
Then create a logging aspect:
@Aspect
@Component
public class LoggingAspect {

    private static final Logger logger = LoggerFactory.getLogger(LoggingAspect.class);

    @Before("execution(* com.yourcompany.service.*.*(..))")
    public void logBeforeMethod(JoinPoint joinPoint) {
        logger.info("Entering method: {}", joinPoint.getSignature().getName());
    }

    @AfterReturning(pointcut = "execution(* com.yourcompany.service.*.*(..))", returning = "result")
    public void logAfterMethod(JoinPoint joinPoint, Object result) {
        logger.info("Method {} returned: {}", joinPoint.getSignature().getName(), result);
    }

    @AfterThrowing(pointcut = "execution(* com.yourcompany.service.*.*(..))", throwing = "ex")
    public void logAfterThrowing(JoinPoint joinPoint, Throwable ex) {
        logger.error("Exception in method {}: {}", joinPoint.getSignature().getName(), ex.getMessage(), ex);
    }
}
The @Before annotation runs before method execution. @AfterReturning runs after successful completion. @AfterThrowing catches exceptions. The pointcut expression execution(* com.yourcompany.service.*.*(..)) matches all methods in your service package.
This approach keeps your service classes clean. No logging code mixed with business logic. If you need to add timing information or change log levels later, you update one aspect instead of 50 service methods.
2. Mapped Diagnostic Context (MDC) for Logging Context
MDC is a thread-local storage mechanism that lets you attach contextual information to all log statements in a request. Put a request ID in MDC at the start of a request, and every log line from that request automatically includes it. This makes it possible to filter logs to a single user session or API call.
In microservices, MDC becomes essential. When a request flows through multiple services, you need a correlation ID to trace it end-to-end. MDC propagates that ID through your code without passing it as a method parameter everywhere.
Example: Using MDC for Request Tracking
Create a filter that generates and stores a trace ID:
@Component
public class RequestLoggingFilter implements Filter {

    @Override
    public void doFilter(ServletRequest request, ServletResponse response, FilterChain chain)
            throws IOException, ServletException {
        String traceId = UUID.randomUUID().toString();
        MDC.put("traceId", traceId);

        try {
            chain.doFilter(request, response);
        } finally {
            MDC.clear();
        }
    }
}
Configure Logback to include the MDC value:
<pattern>%d{yyyy-MM-dd HH:mm:ss} [%X{traceId}] - %msg%n</pattern>Now every log line includes [abc-123-xyz] showing which request it came from. You can grep logs by trace ID to see everything that happened during a specific request.
The finally block clearing MDC is critical. Without it, the trace ID persists when the thread handles the next request, causing logs to have the wrong correlation ID.
Automatic Trace Correlation with OpenTelemetry
Manual MDC works, but OpenTelemetry's Java agent does this automatically. It injects trace_id and span_id into logs without you writing filter code. More importantly, it propagates trace context across service boundaries using standard HTTP headers.
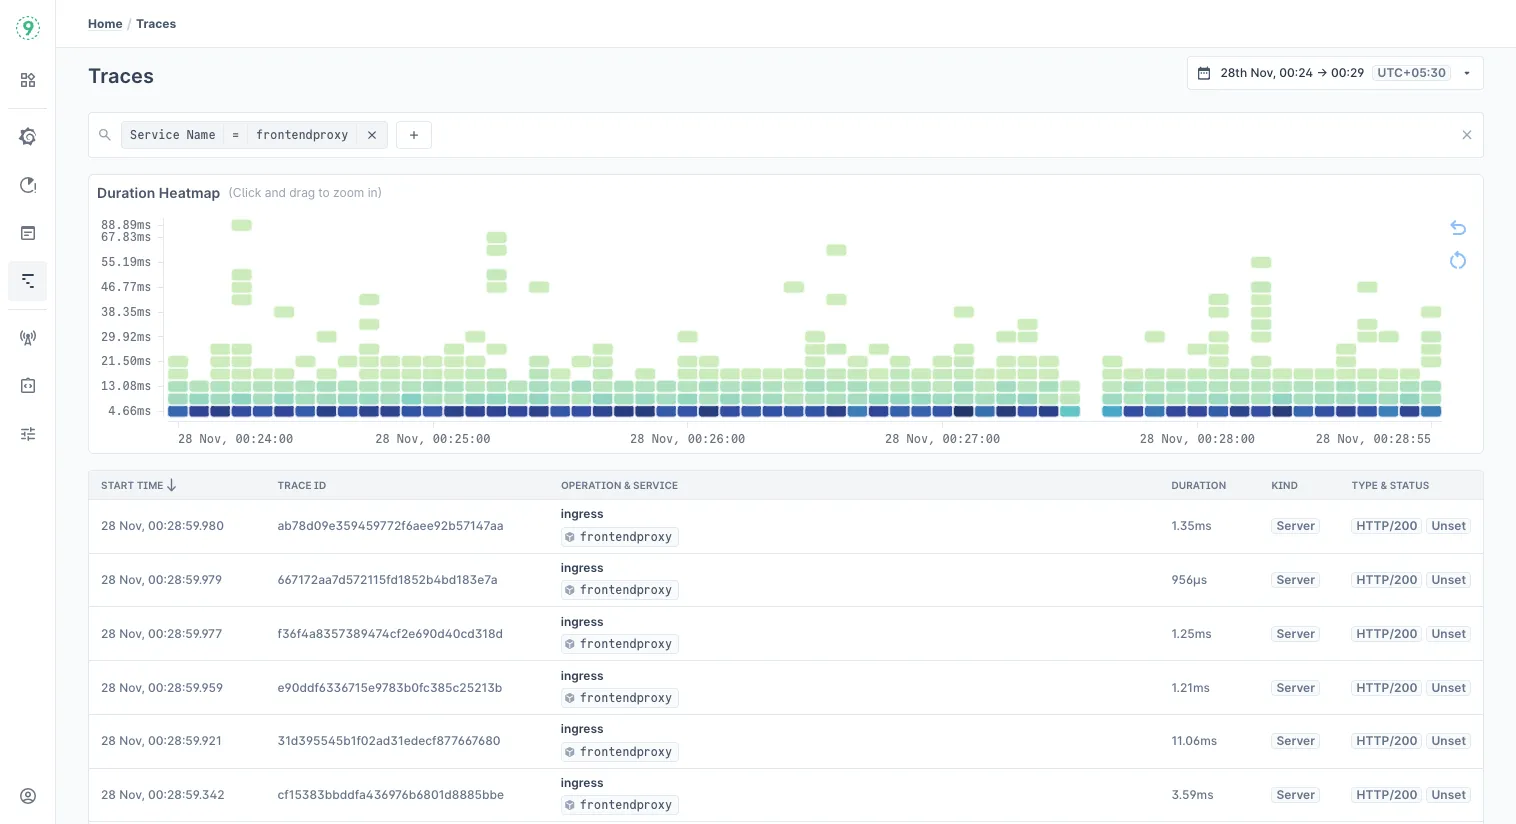
When you use an OpenTelemetry-compatible backend like Last9, you get automatic linking between logs, traces, and metrics. See an error log, click the trace ID, and you're looking at a waterfall diagram showing exactly which microservice failed and why. No manual correlation, no timestamp hunting.
The trace view shows the full request path with timing breakdowns, and clicking any span pulls up relevant logs from that service.
3. Asynchronous Logging for Performance Optimization
Logging can become a performance bottleneck when you're writing to disk or network on every log statement. Asynchronous logging solves this by buffering log events and writing them in a background thread. Your application thread doesn't wait for I/O to complete.
The tradeoff is potential log loss if your application crashes before the buffer flushes. But for most applications, the performance gain is worth it. You're looking at 3-5ms per synchronous log write becoming <1ms with async.
Example: Configuring Asynchronous Logging in Logback
Wrap your file appender with an async appender:
<appender name="FILE" class="ch.qos.logback.core.FileAppender">
    <file>/var/logs/myapp.log</file>
    <encoder>
        <pattern>%d{yyyy-MM-dd HH:mm:ss} - %msg%n</pattern>
    </encoder>
</appender>

<appender name="ASYNC_FILE" class="ch.qos.logback.classic.AsyncAppender">
    <appender-ref ref="FILE"/>
    <queueSize>512</queueSize>
    <discardingThreshold>0</discardingThreshold>
</appender>

<root level="INFO">
    <appender-ref ref="ASYNC_FILE"/>
</root>
The queueSize determines how many log events can be buffered. Set discardingThreshold to 0 to ensure all log levels are preserved (default behavior discards lower-priority logs under pressure).
OpenTelemetry's Built-in Batching
If you're using OpenTelemetry, the Java agent handles batching automatically. It buffers telemetry data (logs, traces, metrics) and sends it in batches to reduce network overhead. You get configurable batch sizes and flush intervals without writing Logback XML.
The OTel approach also handles backpressure better. When your logging backend is slow or unreachable, the agent can drop data strategically instead of blocking application threads or causing out-of-memory errors.
Here's a complete Spring Boot + OpenTelemetry setup:
java -javaagent:opentelemetry-javaagent.jar \
     -Dotel.exporter.otlp.endpoint=https://otlp.last9.io \
     -Dotel.service.name=checkout-service \
     -Dotel.exporter.otlp.headers="Authorization=Bearer YOUR_API_KEY" \
     -jar your-spring-boot-app.jar
This gives you async batched logging, distributed tracing, and auto-instrumentation for Spring MVC, JDBC, and HTTP clients. No code changes. Last9's OTLP endpoint handles the data, but you're using a vendor-neutral standard—switch backends anytime.
How to Log HTTP Requests and Responses in Spring Boot?
Interceptors let you log HTTP-level details that aren't visible in your business logic: headers, response times, and status codes. This is useful for API monitoring, security audits, and performance analysis. You can see which endpoints are slow, which clients are sending malformed requests, and how your API behaves under load.
Spring Boot provides two mechanisms: HandlerInterceptor for the request/response lifecycle, and Filter for lower-level HTTP processing. Use interceptors when you need access to Spring's handler chain. Use filters when you need to modify the raw request or response.
1. Create a Custom Request Interceptor
A HandlerInterceptor has three hooks: before handling (preHandle), after handling but before view rendering (postHandle), and after completion (afterCompletion). Most logging happens in preHandle and afterCompletion.
Example:
@Component
public class RequestLoggingInterceptor implements HandlerInterceptor {

    private static final Logger logger = LoggerFactory.getLogger(RequestLoggingInterceptor.class);

    @Override
    public boolean preHandle(HttpServletRequest request, HttpServletResponse response, Object handler)
            throws Exception {
        long startTime = System.currentTimeMillis();

        logger.info("Request URI: {} | Method: {}", request.getRequestURI(), request.getMethod());

        MDC.put("requestStartTime", String.valueOf(startTime));
        MDC.put("requestUri", request.getRequestURI());

        return true;
    }

    @Override
    public void afterCompletion(HttpServletRequest request, HttpServletResponse response,
                               Object handler, Exception ex) throws Exception {
        long endTime = System.currentTimeMillis();
        long duration = endTime - Long.parseLong(MDC.get("requestStartTime"));

        logger.info("Response Status: {} | Duration: {} ms", response.getStatus(), duration);

        MDC.clear();
    }
}
Register it with Spring Boot:
@Configuration
public class WebConfig implements WebMvcConfigurer {

    @Autowired
    private RequestLoggingInterceptor requestLoggingInterceptor;

    @Override
    public void addInterceptors(InterceptorRegistry registry) {
        registry.addInterceptor(requestLoggingInterceptor).addPathPatterns("/**");
    }
}
This logs every request with timing information. The URI and start time go into MDC so they're available to all downstream log statements. After the request completes, you get the status code and total duration.
2. Create a Custom Response Interceptor
Response logging is trickier because the response body is already sent to the client. You need a Filter that wraps the response to capture the body before it's written.
Example:
@Component
public class ResponseLoggingFilter implements Filter {

    private static final Logger logger = LoggerFactory.getLogger(ResponseLoggingFilter.class);

    @Override
    public void doFilter(ServletRequest request, ServletResponse response, FilterChain chain)
            throws IOException, ServletException {
        ResponseWrapper responseWrapper = new ResponseWrapper((HttpServletResponse) response);

        chain.doFilter(request, responseWrapper);

        logger.info("Response Status: {} | Body Length: {} bytes",
                    responseWrapper.getStatus(),
                    responseWrapper.getResponseData().length);
    }
}
The wrapper class:
public class ResponseWrapper extends HttpServletResponseWrapper {

    private ByteArrayOutputStream outputStream = new ByteArrayOutputStream();
    private PrintWriter writer = new PrintWriter(outputStream);

    public ResponseWrapper(HttpServletResponse response) {
        super(response);
    }

    @Override
    public PrintWriter getWriter() throws IOException {
        return writer;
    }

    public byte[] getResponseData() {
        writer.flush();
        return outputStream.toByteArray();
    }
}
Register the filter:
@Configuration
public class FilterConfig {

    @Bean
    public FilterRegistrationBean<ResponseLoggingFilter> loggingFilter() {
        FilterRegistrationBean<ResponseLoggingFilter> registrationBean = new FilterRegistrationBean<>();
        registrationBean.setFilter(new ResponseLoggingFilter());
        registrationBean.addUrlPatterns("/api/*");
        return registrationBean;
    }
}
Be cautious when logging full response bodies in production. A single large JSON response could fill your disk or exhaust your log aggregator's ingest capacity. Log response size and status code by default, body content only for errors.
3. Enhance Logs with Contextual Information
Interceptors are where you extract and log contextual metadata: user IDs, API keys, client versions, and geographic location. This metadata helps you answer questions like "which users are affected by this bug?" or "is this endpoint slower for mobile clients?"
Example: Add User Context to Logs
@Override
public boolean preHandle(HttpServletRequest request, HttpServletResponse response, Object handler)
        throws Exception {
    String userId = request.getHeader("X-User-Id");
    String clientVersion = request.getHeader("X-Client-Version");

    MDC.put("userId", userId);
    MDC.put("clientVersion", clientVersion);

    return true;
}

@Override
public void afterCompletion(HttpServletRequest request, HttpServletResponse response,
                           Object handler, Exception ex) throws Exception {
    logger.info("User {} | Client {} | Status {}",
                MDC.get("userId"),
                MDC.get("clientVersion"),
                response.getStatus());

    MDC.clear();
}
Now every log statement in the request lifecycle includes user and client information. When you're debugging an issue reported by a specific user, you can filter logs to just their requests.
Log Exceptions in Spring Boot
Exception logging is where you capture what went wrong, why, and what the application did about it.
Spring Boot's @ControllerAdvice centralizes exception handling. Instead of try-catch blocks scattered through your controllers, you define exception handlers in one place. This ensures consistent error responses and logging behavior.
Global Exception Handling with @ControllerAdvice
@ControllerAdvice intercepts exceptions thrown by controllers and lets you return appropriate HTTP responses while logging the details.
Example:
@ControllerAdvice
public class GlobalExceptionHandler {

    private static final Logger logger = LoggerFactory.getLogger(GlobalExceptionHandler.class);

    @ExceptionHandler(Exception.class)
    public ResponseEntity<ErrorResponse> handleException(Exception ex, WebRequest request) {
        logger.error("Unexpected error: {}", ex.getMessage(), ex);
        return new ResponseEntity<>(
            new ErrorResponse("Internal Server Error", ex.getMessage()),
            HttpStatus.INTERNAL_SERVER_ERROR
        );
    }

    @ExceptionHandler(ResourceNotFoundException.class)
    public ResponseEntity<ErrorResponse> handleResourceNotFound(ResourceNotFoundException ex) {
        logger.warn("Resource not found: {}", ex.getMessage());
        return new ResponseEntity<>(
            new ErrorResponse("Resource Not Found", ex.getMessage()),
            HttpStatus.NOT_FOUND
        );
    }

    @ExceptionHandler(MethodArgumentNotValidException.class)
    public ResponseEntity<ErrorResponse> handleValidationErrors(MethodArgumentNotValidException ex) {
        logger.info("Validation error: {}", ex.getMessage());
        List<String> errors = ex.getBindingResult().getAllErrors().stream()
                .map(DefaultMessageSourceResolvable::getDefaultMessage)
                .collect(Collectors.toList());
        return new ResponseEntity<>(
            new ErrorResponse("Validation Failed", errors),
            HttpStatus.BAD_REQUEST
        );
    }
}
The error response DTO:
public class ErrorResponse {
    private String error;
    private Object details;

    public ErrorResponse(String error, Object details) {
        this.error = error;
        this.details = details;
    }

    // getters and setters
}
Different exception types get different log levels. Unexpected exceptions (Exception.class) are ERROR—something broke and needs investigation. ResourceNotFoundException is WARN—expected in normal operation (user requested non-existent data). Validation errors are INFO—just input issues, not system problems.
Custom Exception Types
Define domain-specific exceptions for clearer intent:
public class ResourceNotFoundException extends RuntimeException {
    public ResourceNotFoundException(String message) {
        super(message);
    }
}

public class PaymentProcessingException extends RuntimeException {
    public PaymentProcessingException(String message, Throwable cause) {
        super(message, cause);
    }
}
Throw them where appropriate:
@RestController
@RequestMapping("/api/resources")
public class ResourceController {

    private static final Logger logger = LoggerFactory.getLogger(ResourceController.class);

    @GetMapping("/{id}")
    public ResponseEntity<Resource> getResource(@PathVariable Long id) {
        Resource resource = resourceService.findById(id);
        if (resource == null) {
            throw new ResourceNotFoundException("Resource with ID " + id + " not found");
        }
        return ResponseEntity.ok(resource);
    }
}
Custom exceptions make logs more searchable. Grepping for PaymentProcessingException finds payment issues. Generic RuntimeException could be anything.
Logging Best Practices for Exceptions
Always log the full stack trace for ERROR-level exceptions:
logger.error("Payment processing failed for user {}: {}", userId, ex.getMessage(), ex);The third parameter (the exception object) tells SLF4J to include the stack trace. Without it, you only get the exception message—not enough to debug most issues.
Include contextual information in the log message:
logger.error("Database query failed for table {} with params {}: {}",
             tableName, params, ex.getMessage(), ex);
This tells you what the application was trying to do when it failed, not just that it failed.
Exception Correlation Across Distributed Services
In microservices, a single API call might hit 4-5 services. When something fails, you need to see the full chain: which service started the request, where it went, what each service did, and where it broke.
The Manual Approach (ELK)
- Copy the
traceIdfrom the error log - Open Kibana, search for that trace ID across all indices
- Sort by timestamp to reconstruct the call chain
- Open each log entry to see what that service did
This works but takes 5-10 minutes per incident. If you're debugging multiple times a day, it adds up.
The Automated Approach (OpenTelemetry + Last9)
- Exception log includes
trace_idautomatically - Click the trace ID link
- See the full waterfall diagram showing all services
- Click any span to see logs from that service
- See related metrics (error rate, latency) for context
Last9 works with some of the world’s largest streaming companies. One of our customers shows movies, TV shows, and large-scale sporting events for its millions of subscribers. At Cricket Scale, hundreds, not dozens, of microservices harmoniously stitch together compelling user experiences that keep viewers glued to their devices.
Async Exception Handling
Exceptions in @Async methods don't propagate normally. You need to return CompletableFuture and handle failures explicitly:
@Async
public CompletableFuture<String> processTask() {
    try {
        // long-running task
        return CompletableFuture.completedFuture("Task completed");
    } catch (Exception ex) {
        logger.error("Async task failed: {}", ex.getMessage(), ex);
        return CompletableFuture.failedFuture(ex);
    }
}
The caller can handle the failure:
taskService.processTask()
    .exceptionally(ex -> {
        logger.error("Task execution failed: {}", ex.getMessage());
        return "Fallback value";
    });
How Can I Optimize Logging Performance in Spring Boot?
Logging has a cost. Every log statement consumes CPU (formatting the message), memory (buffering before write), and I/O (writing to disk or network). At low volumes, it's negligible. At high volumes—thousands of requests per second—it becomes measurable.
The goal is to capture the information you need without degrading application performance. This means choosing appropriate log levels, using asynchronous appenders, and being smart about what you log in hot paths.
Log Level Management
Different log levels for different environments:
Development: DEBUG or TRACE for detailed flow visibility
Staging: INFO to catch deployment issues
Production: INFO or WARN to reduce volume
Configure levels per package:
logging.level.org.springframework=INFO
logging.level.com.yourcompany=INFO
logging.level.com.yourcompany.payment=DEBUG
This keeps the framework at INFO while allowing DEBUG for your payment processing code.
Dynamic Log Level Adjustments
Spring Boot Actuator lets you change log levels at runtime:
management.endpoints.web.exposure.include=loggersThen adjust via HTTP:
curl -X POST "http://localhost:8080/actuator/loggers/com.yourcompany.payment" \
     -H "Content-Type: application/json" \
     -d '{"configuredLevel": "DEBUG"}'
Enable DEBUG for troubleshooting, then revert to INFO without restarting. This is particularly useful in production when you need more detail but don't want to redeploy.
Asynchronous Logging
Covered earlier, but worth emphasizing: async logging can reduce overhead by 60-70% in high-throughput applications. The tradeoff is potential log loss on crashes, but most applications can accept that risk.
Configure async in Logback:
<appender name="ASYNC" class="ch.qos.logback.classic.AsyncAppender">
    <appender-ref ref="FILE"/>
    <queueSize>512</queueSize>
    <discardingThreshold>0</discardingThreshold>
    <neverBlock>false</neverBlock>
</appender>

<root level="INFO">
    <appender-ref ref="ASYNC"/>
</root>
Set neverBlock to false so the application thread waits if the queue is full (prevents log loss). Set it to true if you prefer dropping logs over blocking threads.
Log Message Formatting
Use parameterized messages instead of string concatenation:
Bad:
logger.debug("Processing request with ID: " + requestId + " for user: " + userId);The string is constructed even if DEBUG is disabled. Wasted CPU cycles.
Good:
logger.debug("Processing request with ID: {} for user: {}", requestId, userId);The string is only built if DEBUG is enabled. SLF4J's placeholders are evaluated lazily.
Minimize Logging in Hot Paths
Avoid logging inside tight loops:
Bad:
for (Order order : orders) {
    logger.debug("Processing order {}", order.getId());
    processOrder(order);
}
If orders has 10,000 items, that's 10,000 log statements. Even at INFO level, it's overhead.
Good:
logger.debug("Processing {} orders", orders.size());
for (Order order : orders) {
    processOrder(order);
}
Log the aggregate action, not every iteration.
Log Rotation and Archiving
File-based logging needs rotation to prevent unbounded disk growth. Logback's RollingFileAppender handles this:
<appender name="FILE" class="ch.qos.logback.core.rolling.RollingFileAppender">
    <file>/var/logs/myapp.log</file>
    <encoder>
        <pattern>%d{yyyy-MM-dd HH:mm:ss} - %msg%n</pattern>
    </encoder>
    <rollingPolicy class="ch.qos.logback.core.rolling.TimeBasedRollingPolicy">
        <fileNamePattern>/var/logs/myapp-%d{yyyy-MM-dd}.log</fileNamePattern>
        <maxHistory>30</maxHistory>
        <totalSizeCap>10GB</totalSizeCap>
    </rollingPolicy>
</appender>
This creates a new log file daily, keeps 30 days of history, and caps total size at 10GB. Older logs are automatically deleted.
When File-Based Rotation Becomes a Problem
Log rotation works fine for single-server deployments. But when you move to Kubernetes or any container orchestration:
- Ephemeral containers mean logs disappear when pods restart
- Horizontal scaling creates dozens of separate log files across instances
- Multi-region deployments scatter logs across data centers
You end up scripting log collection with Fluentd or Filebeat, shipping logs to Elasticsearch, managing S3 archival, configuring retention policies, and maintaining all that infrastructure.
Last9 handles this automatically. Logs are ingested via OpenTelemetry Protocol (OTLP), stored with 14-day hot retention for fast queries, and optionally archived to your S3/GCS for compliance. No collection agents to maintain, no Elasticsearch cluster to tune.
The retention model is straightforward:
- Logs: 14 days hot, optional cold archival
- Traces: 14 days (Pro), up to 90 days (Enterprise)
- Metrics: 90 days with unlimited time series
For Spring Boot teams on Kubernetes, this removes a significant operational burden.
Efficient Log Aggregation
When sending logs to remote systems (Elasticsearch, Splunk, etc.), use batching to reduce network overhead:
<appender name="REMOTE" class="ch.qos.logback.classic.net.SocketAppender">
    <remoteHost>logging-server.com</remoteHost>
    <port>5000</port>
    <reconnectionDelay>30000</reconnectionDelay>
    <queueSize>500</queueSize>
</appender>
But even with batching, you're managing network reliability, backpressure handling, and what happens when the remote system is unreachable.
Performance Visibility with Last9's Control Plane
After optimizing your logging setup, how do you know it worked? Most teams discover problems after the fact—when an AWS bill arrives or when engineers complain about slow queries.
Last9's Control Plane provides real-time visibility:
- Ingestion rate: Events/sec per service with cardinality breakdown
- Query performance: P99 latency for log searches
- Cost attribution: Which services generate the most log volume
Make Spring Boot Logging Secure and Compliant
Logs often contain sensitive information: user IDs, IP addresses, request parameters, error messages with stack traces. If you're handling healthcare data (HIPAA), payments (PCI DSS), or EU users (GDPR), your logging practices are part of your compliance scope.
The challenge is balancing security with utility. Logs need enough detail to be useful for debugging, but not so much that they become a liability if exposed.
Prevent Sensitive Data in Logs
Never log passwords, API keys, credit card numbers, or personally identifiable information (PII) in plaintext:
Bad:
logger.info("User login: username={}, password={}", username, password);
logger.info("Payment details: cardNumber={}, cvv={}", cardNumber, cvv);
Good:
logger.info("User login: username={}", username);
logger.info("Payment processed for user: {}", userId);
If you need to log potentially sensitive data, use masking:
public String maskCreditCard(String cardNumber) {
    if (cardNumber == null || cardNumber.length() < 4) {
        return "****";
    }
    return "****-****-****-" + cardNumber.substring(cardNumber.length() - 4);
}

logger.info("Payment processed: card={}", maskCreditCard(cardNumber));
Access Control
Restrict who can view logs. Use role-based access control (RBAC) in your log management system. Engineers should see logs for their services, not necessarily all logs across the organization.
For file-based logging, set appropriate file permissions:
chmod 640 /var/logs/myapp.log
chown appuser:loggroup /var/logs/myapp.log
Only the application user and the log group can read the file.
Compliance Requirements
Different regulations have different requirements:
GDPR – Log retention must align with data retention policies. You can't keep logs with PII longer than you're allowed to keep the PII itself.
HIPAA – Logs must be encrypted in transit and at rest. Access must be audited.
PCI DSS – Logs must be tamper-proof. You need to be able to prove logs haven't been modified.
SOX – Logs must be retained for a specific period (typically 7 years) for audit purposes.
Compliance-Ready Logging with Last9
If your Spring Boot application handles regulated data, your observability platform needs to meet the same compliance standards. Self-hosting Elasticsearch means your team is responsible for pen testing, access auditing, and proving tamper-proof storage.
Last9 is SOC2 Type II, HIPAA, and ISO 27001 certified. For teams that can't send data outside their VPC, Last9 offers BYOC (Bring Your Own Cloud) deployment—managed observability running in your AWS/GCP/Azure account. You get the operational benefits (no cluster management, automatic scaling) without data leaving your network.
Last9 also provides pre-ingestion PII redaction. You can configure rules to mask or drop sensitive data before it's stored. For example, automatically redact credit card patterns in log messages:
Rule: IF message MATCHES /\d{4}-\d{4}-\d{4}-\d{4}/ THEN REPLACE WITH "****-****-****-****"This happens before storage, so the data never hits disk.
Encryption
Encrypt logs in transit using TLS/SSL. Most log shippers (Filebeat, Fluentd) support this:
# Filebeat config
output.elasticsearch:
  hosts: ["https://elasticsearch:9200"]
  protocol: "https"
  ssl.verification_mode: "full"
For at-rest encryption, use filesystem-level encryption (dm-crypt on Linux) or cloud provider encryption (AWS EBS encryption, GCP persistent disk encryption).
Audit Logging
Track who accessed logs and when. If you're using Elasticsearch, enable audit logging:
xpack.security.audit.enabled: true
xpack.security.audit.logfile.events.include: [access_granted, access_denied]
This creates a separate audit trail showing all log access attempts.
Framework Integration
Logback and Log4j2 both support encryption:
Logback with encrypted file appender (requires additional library):
<appender name="FILE" class="ch.qos.logback.core.FileAppender">
    <file>/var/logs/myapp.log.enc</file>
    <encoder class="ch.qos.logback.core.encoder.EncryptedEncoder">
        <key>your-encryption-key</key>
    </encoder>
</appender>
Log4j2 with a pattern layout that masks sensitive data:
<PatternLayout pattern="%d{yyyy-MM-dd HH:mm:ss} [%t] %-5level %logger{36} - %replace{%msg}{password=\S+}{password=****}%n"/>The %replace pattern uses regex to mask any password=<value> in log messages.
What Is OpenTelemetry Auto-Instrumentation for Spring Boot?
OpenTelemetry is the CNCF standard for observability instrumentation. Instead of vendor-specific agents, you use a single agent that works with any OpenTelemetry-compatible backend. For Spring Boot 3+, it's the recommended approach.
The Java agent automatically instruments common frameworks: Spring MVC, Spring WebFlux, JDBC, Hibernate, HTTP clients, Kafka, and more. You get logs, traces, and metrics without modifying application code.
What You Get Automatically
- Logs: SLF4J/Logback logs with trace context injected
- Traces: Distributed traces showing request flow across services
- Metrics: JVM metrics, HTTP server metrics, database connection pool metrics
- Correlation: Logs linked to traces linked to metrics
Every HTTP request becomes a trace. Every database query is a span in that trace. Every log statement includes the trace ID and span ID. Click a log line, see the full trace. Click a slow span, see related logs.
The OTel Java agent automatically instruments Spring Boot components you're already using:
Web Layer:
- Spring MVC controllers
- Spring WebFlux handlers
- Servlet filters
HTTP Clients:
- RestTemplate
- WebClient
- Apache HttpClient
- OkHttp
Database:
- JDBC drivers
- Hibernate/JPA operations
- MongoDB client
- Redis operations
Messaging:
- Kafka consumers and producers
- RabbitMQ
- JMS queues
RPC:
- gRPC client and server calls
Typical overhead: 3-8% CPU increase and ~200ms additional startup time. For most Spring Boot applications, this is negligible compared to the observability value you get.
Setup (5 Minutes)
1. Download the OpenTelemetry Java agent:
wget https://github.com/open-telemetry/opentelemetry-java-instrumentation/releases/latest/download/opentelemetry-javaagent.jar2. Run your Spring Boot application with the agent:
java -javaagent:opentelemetry-javaagent.jar \
     -Dotel.service.name=checkout-service \
     -Dotel.exporter.otlp.endpoint=https://otlp.last9.io \
     -Dotel.exporter.otlp.headers="Authorization=Bearer YOUR_API_KEY" \
     -jar target/myapp.jar
3. Verify data in your OpenTelemetry backend.
No code changes. No Logback XML modifications. No custom filters for MDC. It all happens automatically.
Configuration Options
Control what gets instrumented:
# Disable specific instrumentations
-Dotel.instrumentation.jdbc.enabled=false
-Dotel.instrumentation.kafka.enabled=false

# Set sampling rate (1.0 = 100%, 0.1 = 10%)
-Dotel.traces.sampler=parentbased_traceidratio
-Dotel.traces.sampler.arg=0.1

# Add custom resource attributes
-Dotel.resource.attributes=environment=production,region=us-east-1
Why OpenTelemetry
Before OpenTelemetry, you'd use DataDog's agent for DataDog, New Relic's agent for New Relic, and so on. Each agent had its own instrumentation, configuration, and overhead. Switching vendors meant reinstrumenting your application.
OpenTelemetry solves this. Instrument once with the OTel agent, send data to any compatible backend. Last9, Grafana Cloud, Elastic—they all accept OTLP. If you decide to switch, you change one environment variable (the endpoint URL), not your entire instrumentation.
For Spring Boot specifically, OpenTelemetry is a natural fit. Spring Boot 3 has built-in Micrometer Tracing support that works seamlessly with OTel. The framework is designed for this approach.
Best Practices for Spring Boot Logging
These are the practices that separate development logging from production-grade observability. They're based on what works at scale, not just what's easy to implement.
Choose the Right Log Level
TRACE – Extremely detailed, traces code execution path. Use rarely, only when debugging specific issues.
DEBUG – Diagnostic information useful during development. Typically disabled in production.
INFO – General operational messages. Application startup, scheduled job execution, and significant business events. Default for production.
WARN – Something unexpected but recoverable. Deprecated API usage, fallback behavior triggered, slow query detected.
ERROR – Operation failed. The application continues but functionality is broken. Requires investigation.
Use INFO as your baseline in production. Enable DEBUG temporarily for specific packages when troubleshooting. Never leave DEBUG enabled globally in production—the volume will bury useful information.
Structured Logging
Use structured formats (JSON) instead of plain text when possible:
Plain text:
2024-12-04 10:23:45 INFO Processing order 12345 for user john@example.comStructured (JSON):
{
  "timestamp": "2024-12-04T10:23:45.123Z",
  "level": "INFO",
  "message": "Processing order",
  "orderId": "12345",
  "userId": "john@example.com",
  "service": "order-service"
}
Structured logs are easier to query and aggregate. You can filter by orderId or count events by userId without parsing text.
Configure Logback for JSON output:
<encoder class="net.logstash.logback.encoder.LogstashEncoder">
    <includeContext>false</includeContext>
    <includeMdc>true</includeMdc>
</encoder>
Requires the logstash-logback-encoder dependency:
<dependency>
    <groupId>net.logstash.logback</groupId>
    <artifactId>logstash-logback-encoder</artifactId>
    <version>7.4</version>
</dependency>
Avoid Sensitive Data
Covered in the security section, but worth repeating: never log passwords, tokens, credit cards, or PII. Use masking functions for anything that could be sensitive.
Centralized Log Management: Self-Hosted vs Managed
For applications with more than a few services, centralized logging becomes necessary. You need to search across all services, correlate events, and set up alerts.
Self-Hosted (ELK Stack)
Elasticsearch + Logstash/Fluentd + Kibana gives you full control. But you're also responsible for:
- Elasticsearch cluster sizing and tuning (heap size, shard count, replica strategy)
- Index lifecycle management (rotation, archival, deletion)
- Cluster upgrades and security patches
- Backup and disaster recovery
- Scaling when the log volume increases
Most teams underestimate this. What starts as "spin up an Elasticsearch cluster" turns into a dedicated platform team managing observability infrastructure.
Commercial SaaS (Splunk, Datadog)
Zero infrastructure management. Enterprise-grade features (anomaly detection, APM integration, long-term retention). But pricing is based on data volume (per GB per day), which creates perverse incentives.
Teams start sampling logs or dropping verbose services to control costs. Exactly when you hit production incidents—when you need complete logs—your sampling strategy means critical data is missing.
Splunk costs $1,800-$2,500 per GB per day for annual contracts. A single verbose service logging 10GB/day costs $18,000-$25,000/month. Companies end up playing whack-a-mole with log volume to stay under budget.
OpenTelemetry-Native Platforms (Last9)
For Spring Boot teams, Last9 offers a middle path: managed infrastructure with event-based pricing instead of per-GB charges.
Since Spring Boot 3 natively supports OpenTelemetry via Micrometer, you can instrument once and send to any OTLP-compatible backend. Last9 accepts OTLP directly—no proprietary agents, no vendor lock-in. Switch backends by changing one environment variable.
When to consider Last9:
- You're spending >4 hours/week maintaining Elasticsearch
- Your team avoids structured logging because ELK is too complex
- You need full-fidelity logs (no sampling) during incidents
- You want automatic trace correlation without stitching tools together
Asynchronous Logging
Use async appenders for production. Configure them properly (queue size, discard threshold) to avoid blocking or losing critical logs.
Log Rotation
For file-based logging, configure rotation by size and time. Keep 30 days of history (adjust based on compliance requirements) and cap total size to prevent disk exhaustion.
How Last9 Reduces the Operational Load for Spring Boot Teams
If you've made it this far, you’ve set up Logback, built out MDC, tuned performance, and handled compliance. The foundation is strong, but it naturally leads to a bigger question: how long do you keep running your own logging stack?
The honest answer: you stop when the operational load outweighs the control you get from hosting it yourself.
The Operational Reality
Self-hosting Elasticsearch isn’t just about deployment. It becomes a constant stream of work—tuning heap, balancing shards, fixing slow queries, planning index rollovers, managing upgrades, and keeping up with security patches. Most of this ends up with platform or SRE teams, who now maintain observability infrastructure instead of improving application reliability.
The Cost Tradeoff
Tools that charge per GB force teams to reduce volume: sampling logs, cutting retention, filtering noisy services, or dropping structured JSON. All reasonable—but all painful during incidents, where missing one log line means missing the full story.
This is the point where teams start looking for a backend that removes both operational burden and volume anxiety. That’s where Last9 helps you achieve your goals.
Event-Based Pricing
You pay per event—not per GB—so structured logs, debug modes, and verbose incidents stay affordable. Probo Cuts Monitoring Costs by 90% with Last9
Full-Fidelity by Default
Last9 ingests everything: every log, span, and metric sample. For Spring Boot microservices, this means you don’t lose context when a payment, auth flow, or background job fails.
Automatic Trace Correlation
With OpenTelemetry, logs, traces, and metrics are linked automatically. See an error → jump to the trace → inspect spans → pull the surrounding logs. Teams consistently see 40–60% reductions in MTTR because the workflow removes guesswork.
Built for OTel and Spring Boot 3
OTLP is supported directly. Spring Boot 3 with Micrometer Tracing works cleanly. No proprietary agents, no rewrites—just a config change if you ever switch backends later.
Last9 has supported 12 of the 20 largest livestreamed events across industries.
“We just eliminated the toil. No more worrying about failing dashboards or alerts—it just works.”
— Matt Iselin, Head of SRE, Replit
Migration Without Pain
Dashboards import from Grafana and Datadog. Kibana queries can be translated. You can run your existing stack and Last9 in parallel before cutover. Enterprises can also use AWS Marketplace for procurement.
You get Slack or Teams access to the engineers who built the platform—useful during onboarding and production issues.
Last9’s free tier includes 100M events and 7-day retention—enough to instrument a few Spring Boot services and see the difference. And if you'd like a detailed walkthrough book sometime with us!
FAQs
How do I enable DEBUG logging for a specific package in Spring Boot without restarting the application?
Use Spring Boot Actuator's logging endpoint. First, enable it in application.properties:
management.endpoints.web.exposure.include=loggersThen change the log level via HTTP POST:
curl -X POST "http://localhost:8080/actuator/loggers/com.yourcompany.service" \
     -H "Content-Type: application/json" \
     -d '{"configuredLevel": "DEBUG"}'
This takes effect immediately. To revert, set it back to INFO or null (which uses the default level). This is particularly useful in production when you need temporary visibility into a specific component without redeploying.
What's the difference between Logback and Log4j2, and should I switch?
Logback is Spring Boot's default and works well for most applications. It's mature, well-documented, and has extensive community support. Log4j2 offers better performance under high load—specifically, its asynchronous loggers are faster than Logback's AsyncAppender.
Switch to Log4j2 if:
- You're logging >10,000 messages per second
- You've profiled and confirmed that logging is a bottleneck
- You need advanced features like custom plugins or lookups
Stay with Logback if:
- Your current setup works fine
- You don't have measurable performance issues
- You value ecosystem compatibility (most Spring Boot examples use Logback)
Switching requires changing dependencies and the configuration format. Unless you have a specific performance problem, the default is fine.
How do I prevent logs from containing sensitive information like passwords or credit card numbers?
Use a combination of coding practices and automated masking:
1. Never log sensitive fields directly:
// Bad
logger.info("User login: {}, password: {}", username, password);

// Good
logger.info("User login: {}", username);
2. Use masking functions for potentially sensitive data:
public String maskCreditCard(String cardNumber) {
    return "****-****-****-" + cardNumber.substring(cardNumber.length() - 4);
}

logger.info("Payment processed: {}", maskCreditCard(cardNumber));
3. Use regex-based masking in Logback:
<PatternLayout pattern="%d{yyyy-MM-dd HH:mm:ss} - %replace{%msg}{password=\S+}{password=****}%n"/>4. Use pre-ingestion filtering in your observability platform. Last9's Control Plane lets you set up rules that mask or drop sensitive data before it's stored, so it never hits disk.
Should I use MDC or OpenTelemetry's automatic trace context injection?
If you're starting a new project or already using OpenTelemetry, use automatic trace context injection. It's vendor-neutral, propagates context across service boundaries automatically, and integrates with observability platforms that support distributed tracing.
Use manual MDC if:
- You're on an older Spring Boot version and can't use OpenTelemetry
- You have a custom context (like tenant ID or customer tier) that's not part of the standard trace context
- You need fine-grained control over what gets logged
In practice, many teams use both: OpenTelemetry for trace/span IDs and manual MDC for application-specific context.
How much disk space do Spring Boot logs typically consume?
Highly variable, depends on log level and request volume. As a rough guideline:
- Low traffic (<100 requests/min): 100-500 MB/day at INFO level
- Medium traffic (1,000 requests/min): 1-5 GB/day at INFO level
- High traffic (10,000 requests/min): 10-50 GB/day at INFO level
DEBUG level can be 5-10x more verbose. Structured JSON logging is ~2x larger than plain text due to field names.
Set up log rotation (daily or by size) to prevent unbounded growth. Most teams keep 7-30 days of local logs, then archive or delete older files.
What's the performance overhead of logging in Spring Boot?
At INFO level with async appenders, typically 1-3% CPU overhead. Synchronous logging can be 5-10% depending on I/O speed. DEBUG or TRACE level can add 10-20% due to the sheer volume of messages.
The actual impact depends on:
- Log level: DEBUG logs 10x more than INFO
- Message complexity: Logging large objects or computing values is expensive
- Appender type: Async appenders are much faster than synchronous
- Destination: Writing to local disk is faster than network sockets
If logging becomes a bottleneck, use profiling tools to identify hot spots. Often the issue is logging in tight loops or constructing expensive log messages.
Can I query Last9 logs from my IDE?
Yes. Last9's MCP server integrates with Claude, Cursor, and GitHub Copilot. Ask questions like "Why is the checkout service slow?" or "Show me exceptions from the last hour" directly in your editor and get answers from production logs and traces.
This is particularly useful during development when you need to understand production behavior without context-switching to a web dashboard.
What support model does Last9 provide?
Unlike traditional ticketing systems, Last9 provides dedicated Slack or Teams channels with its engineering team. You're talking directly to the engineers who built the platform, not tier-1 support reading from scripts. During migrations or production incidents, this direct access significantly reduces resolution time.
The support model is designed for developers—technical conversations with people who understand Spring Boot, OpenTelemetry, and distributed systems at a deep level.

