


Best Incident Management Software for Engineering Teams (2026)
Compare 9 incident management tools: PagerDuty, Opsgenie, Incident.io, Rootly, FireHydrant, BetterStack, Grafana OnCall, Squadcast, and Last9. Features, pricing, and which fits your team.
Sahil Khan
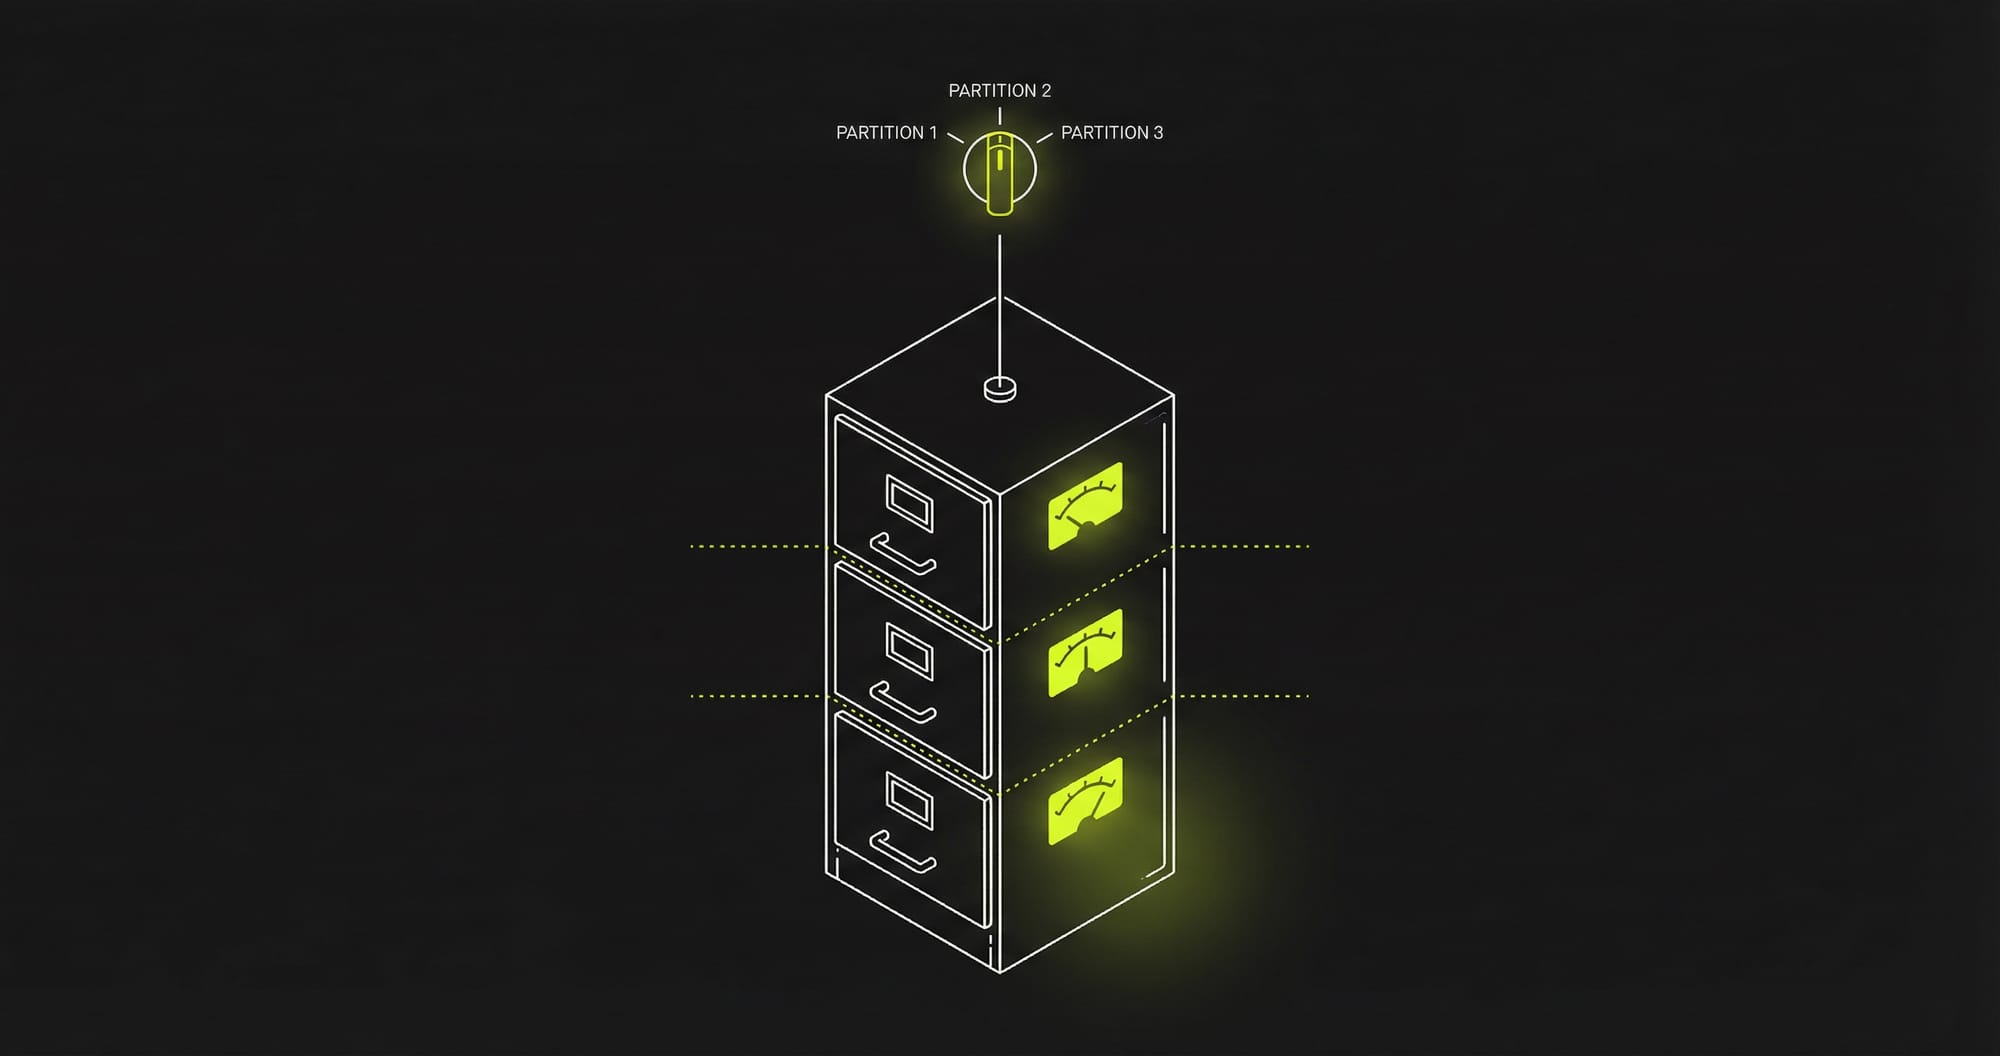
Database Partitioning: Types, Strategies, and When to Use Each
How database partitioning works in PostgreSQL and MySQL. Range, list, and hash partitioning with SQL examples and guidance on when to partition vs shard.
Prathamesh Sonpatki
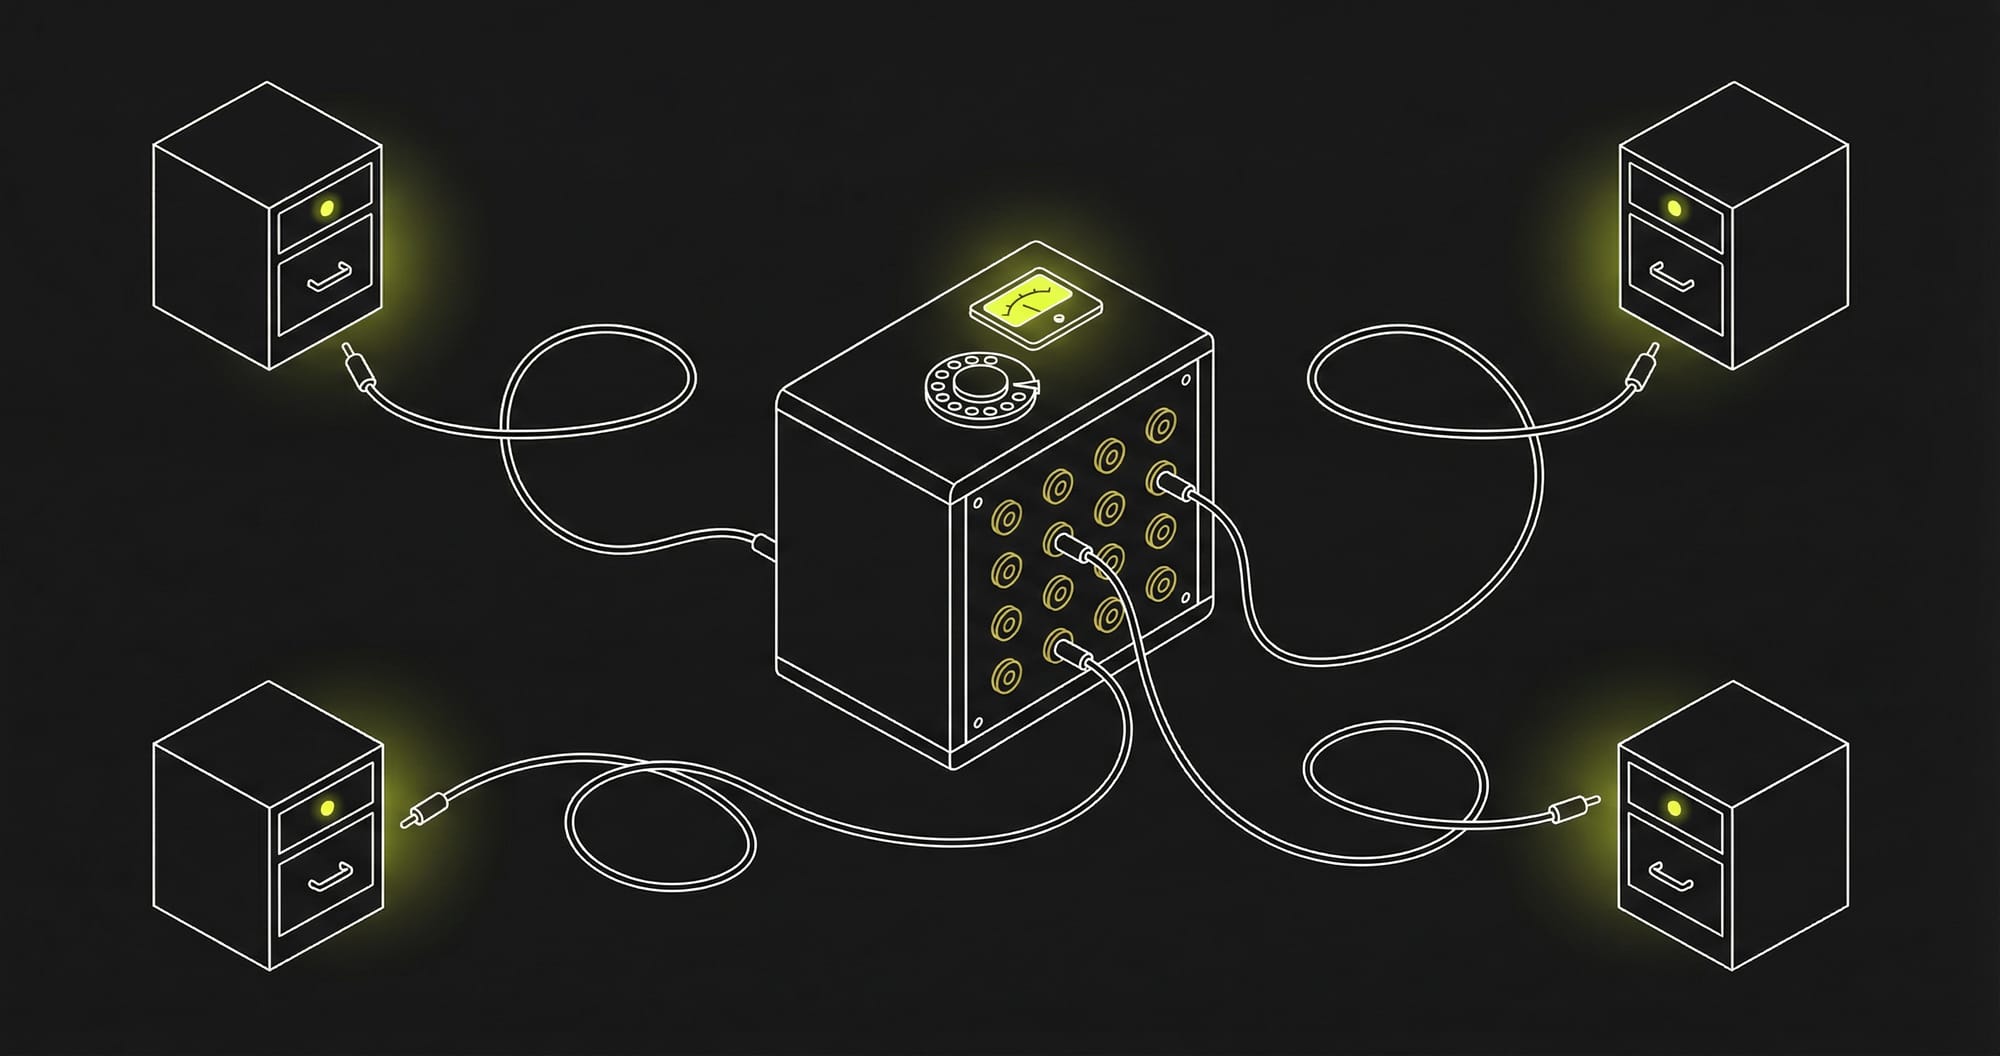
Database Sharding: How It Works and When You Actually Need It
How database sharding works, common strategies (hash, range, directory), shard key selection, and the operational cost of running a sharded database in production.
Prathamesh Sonpatki
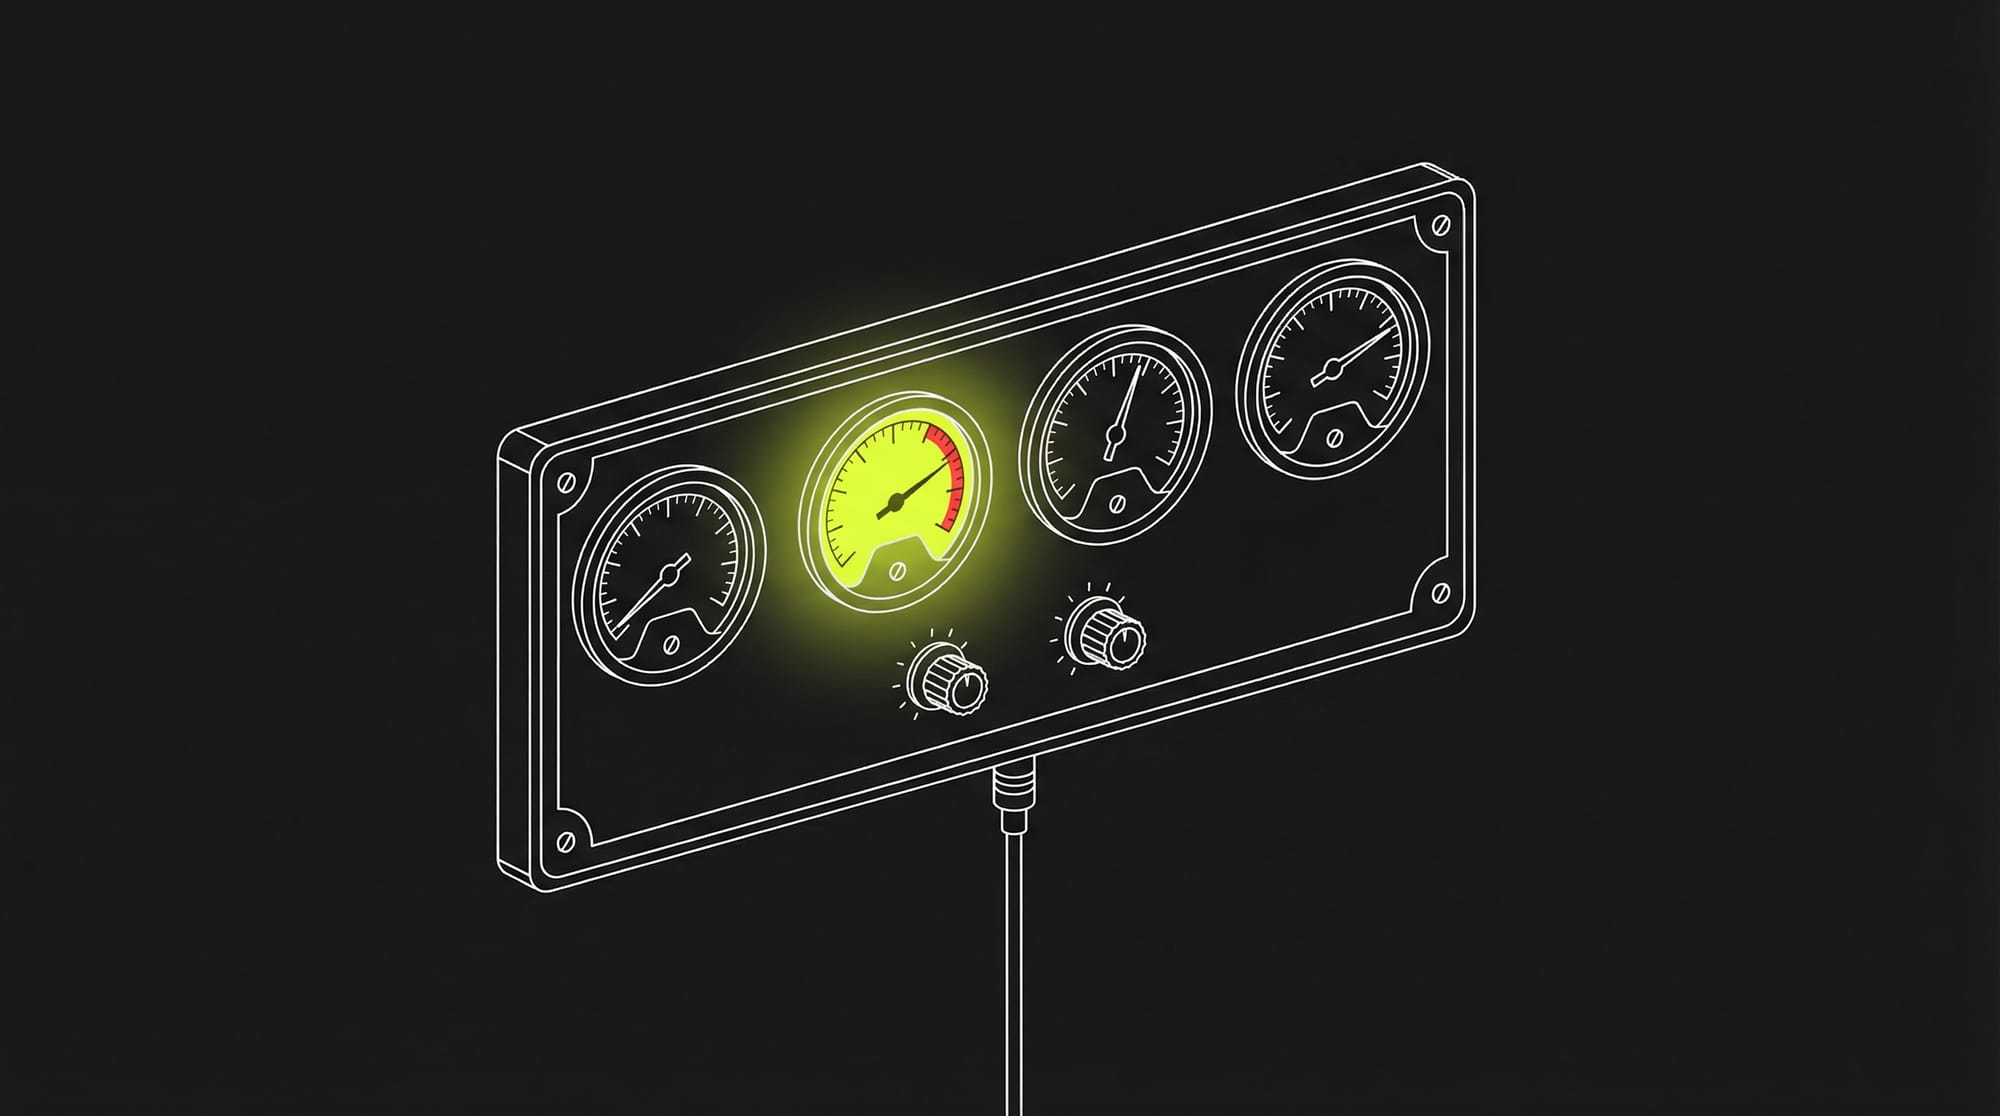
Database Performance Tuning: A Practical Guide for Production Systems
Tune PostgreSQL and MySQL for production with connection pooling, memory configuration, write path optimization, vacuum management, and lock contention fixes.
Preeti Dewani

Traces Are Not Your Business Logic
Distributed traces track how your system processed a single request — not what your customers did over time. Confusing the two leads to poorly instrumented systems.
Mukta Aphale
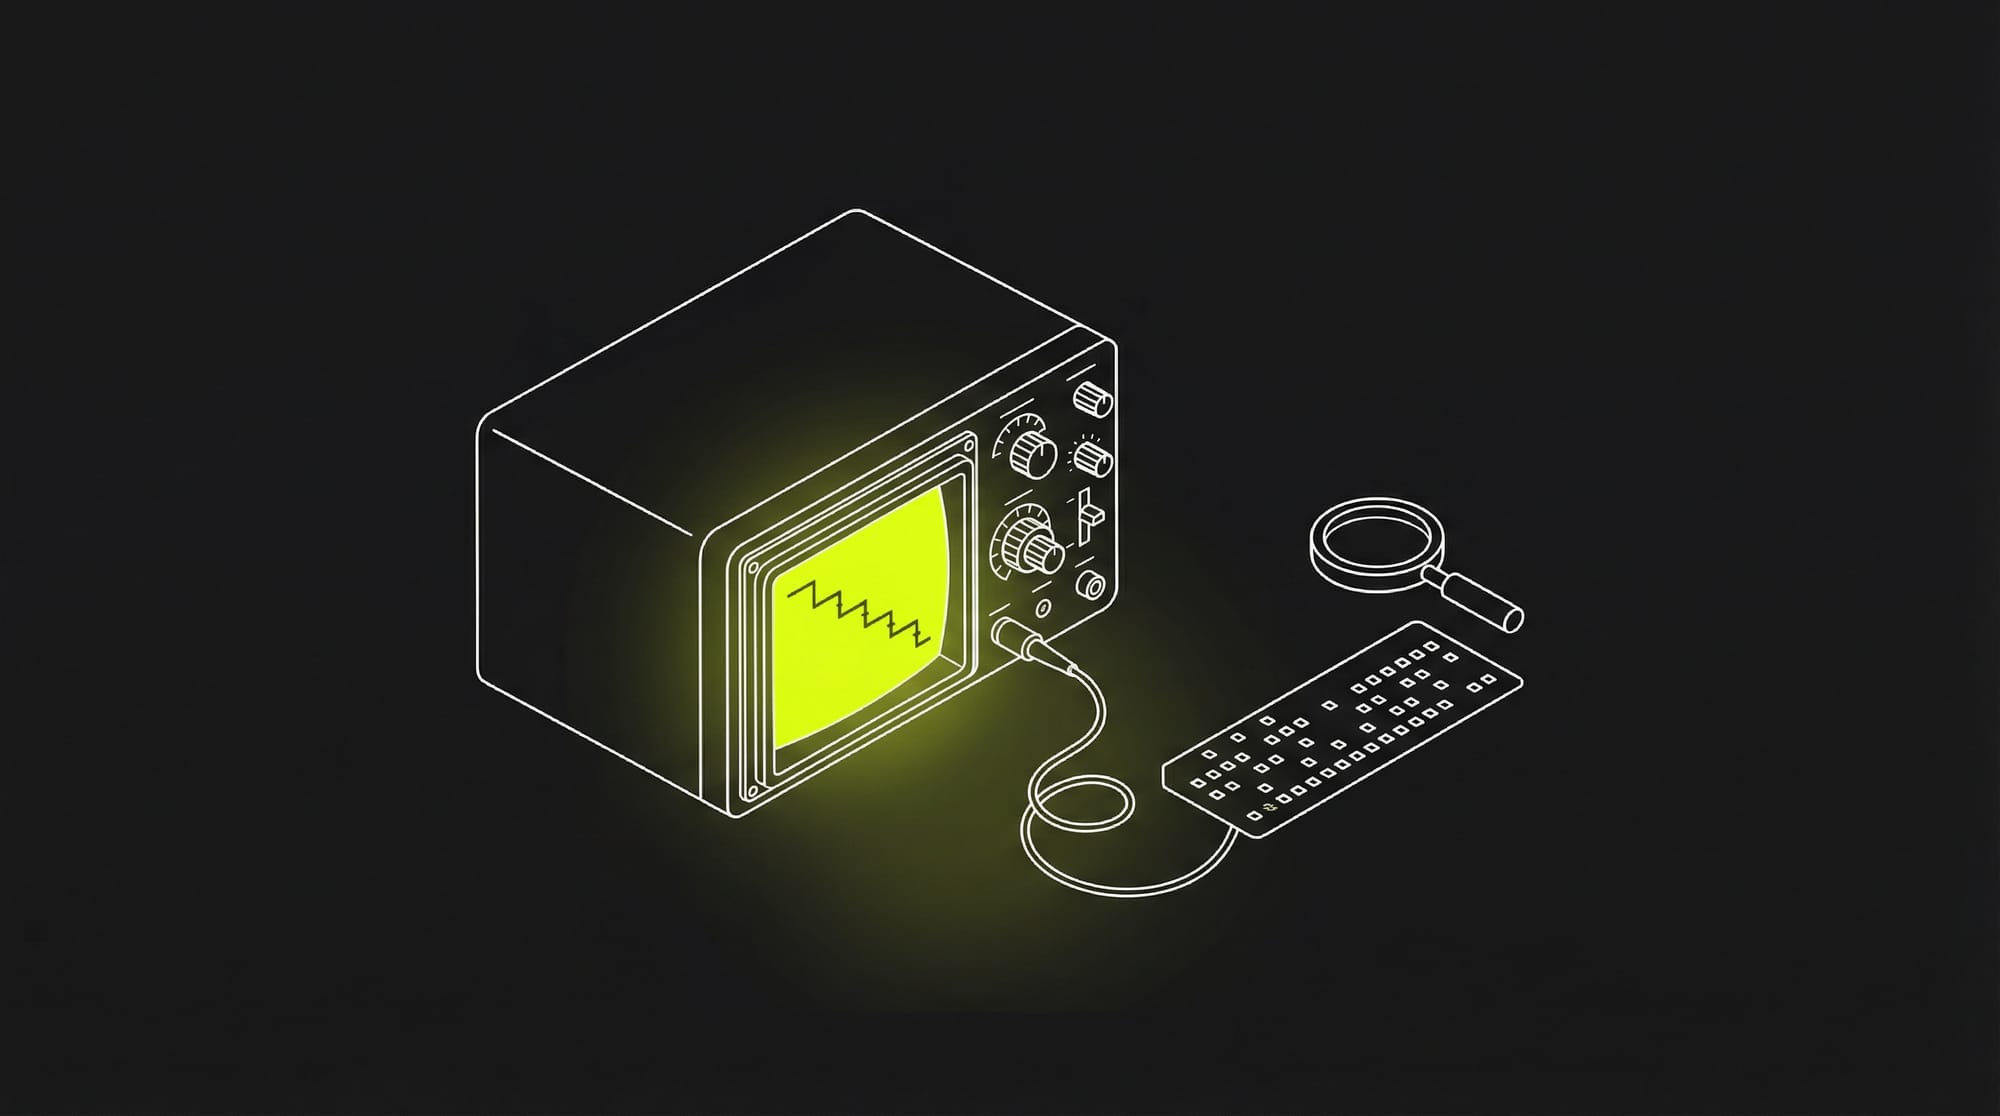
SQL Query Optimization: Techniques That Actually Improve Performance
Find and fix slow SQL queries using execution plans, missing index detection, N+1 pattern fixes, and pagination strategies for PostgreSQL and MySQL.
Sahil Khan
Database Indexing: How It Works, Types, and When to Use It
How database indexes work, when to use B-tree vs hash indexes, clustered vs non-clustered indexes, and how to tell if your indexes are actually helping.
Faiz Shaikh
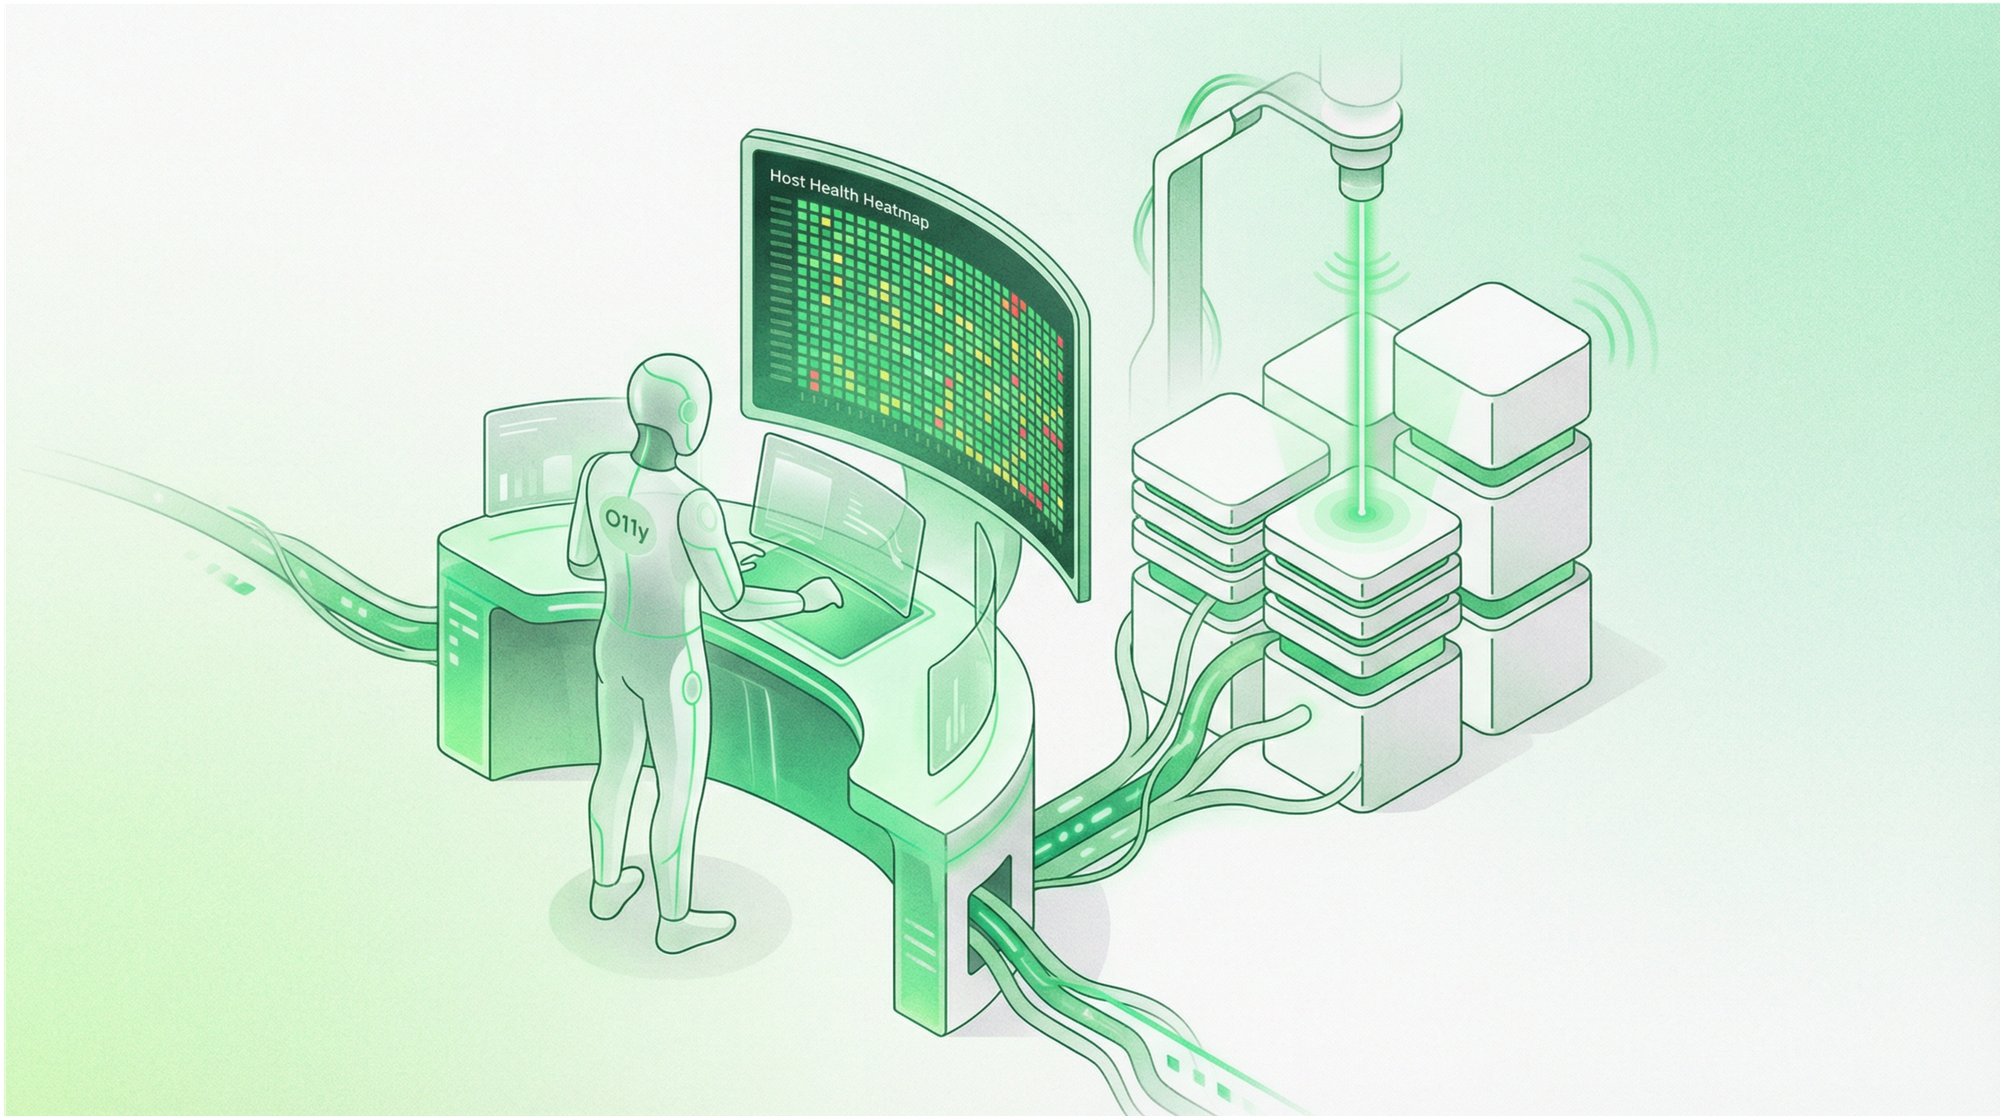
Stop Flying Blind: Synthetic Monitoring, Host heat-maps, and Process-Level Visibility
Most teams learn about outages from customers. Synthetic monitoring, host heat-maps, and AI streaming help you know before being told.
Nishant Modak
High Cardinality Metrics: How Prometheus and ClickHouse Handle Scale
Prometheus pays for high cardinality metrics at write time. ClickHouse pays at query time. Neither solves it : they fail differently. Here's how to choose.
Aditya Godbole
Preeti Dewani