
Recording rules in Prometheus pre-compute queries and store the results as new time series. But why would you want to "pre-compute" data before a query or alert rule even hits it?
Let's explore how Prometheus Recording Rules can optimize query performance, improve dashboards, and handle high-cardinality data in this blog.
What Are Prometheus Recording Rules?
Prometheus Recording Rules are a way to pre-compute frequently used or complex PromQL queries and store the results as new time series.
Think of them as a cache for your queries – they do the heavy lifting in advance, so when you need the data, it's right there waiting for you.
Why Use Recording Rules?
I remember the first time I realized I needed Recording Rules. I was working on a large microservices architecture, and our Grafana dashboards were becoming painfully slow.
Some queries were taking 30 seconds or more to load! That's when I turned to Recording Rules, and the impact was immediate.
Here are some key scenarios where Recording Rules shine:
- Optimizing Dashboard Performance: If you have complex queries that are used across multiple dashboard panels, pre-computing these with Recording Rules can significantly reduce load times.
- Improving Alert Responsiveness: For critical alerts that depend on complex calculations, Recording Rules ensure that the necessary data is always readily available.
- Aggregating High-Cardinality Data: When dealing with metrics that have a high number of labels, Recording Rules can help you pre-aggregate this data, making it much more manageable.
- Creating Custom Metrics: Sometimes, you need metrics that don't exist out of the box. Recording Rules allow you to define these custom metrics based on existing data.
How to Implement Recording Rules
Suppose we want to calculate the average CPU usage across all instances of a particular service.
Here's how we might define a Recording Rule for this:
groups:
  - name: cpu_usage
    rules:
      - record: job:node_cpu_utilization:avg_5m
        expr: avg by (job) (rate(node_cpu_seconds_total{mode!="idle"}[5m]))
Let's break this down:
groups: This organizes related rules together.name: A descriptive name for the group of rules.record: The name of the new time series that will be created.expr: The PromQL expression that will be evaluated to create the new time series.
In this case, we're calculating the average CPU utilization across all instances of each job over a 5-minute window.
Dealing with High-Cardinality Metrics
One of the most common challenges in Prometheus setups is handling high-cardinality metrics.
Let's talk about it with a real-world example and see how Recording Rules can help.
Example: High-Cardinality HTTP Request Metric
Imagine we have a metric http_requests_total that counts HTTP requests. It might have labels for:
method(GET, POST, PUT, etc.)path(the URL path)status_code(200, 404, 500, etc.)client_ip(the IP address of the client)
Here's what this metric might look like:
http_requests_total{method="GET", path="/api/users", status_code="200", client_ip="192.168.1.1"} 1
http_requests_total{method="POST", path="/api/orders", status_code="201", client_ip="192.168.1.2"} 1
http_requests_total{method="GET", path="/api/products", status_code="404", client_ip="192.168.1.3"} 1
...
This metric can quickly become high-cardinality, especially due to the client_ip and path labels. Each unique combination of these labels creates a new time series, which can explode into millions of series for busy services.
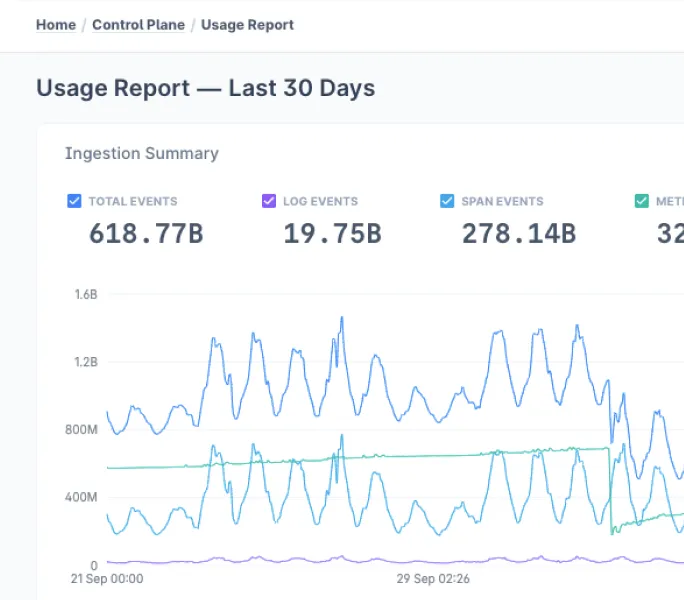
Visualizing Cardinality with Levitate
To understand the impact of this high-cardinality metric, we can use tools like Levitate, which provides a cardinality explorer UI.
Here's what you might see in Levitate:
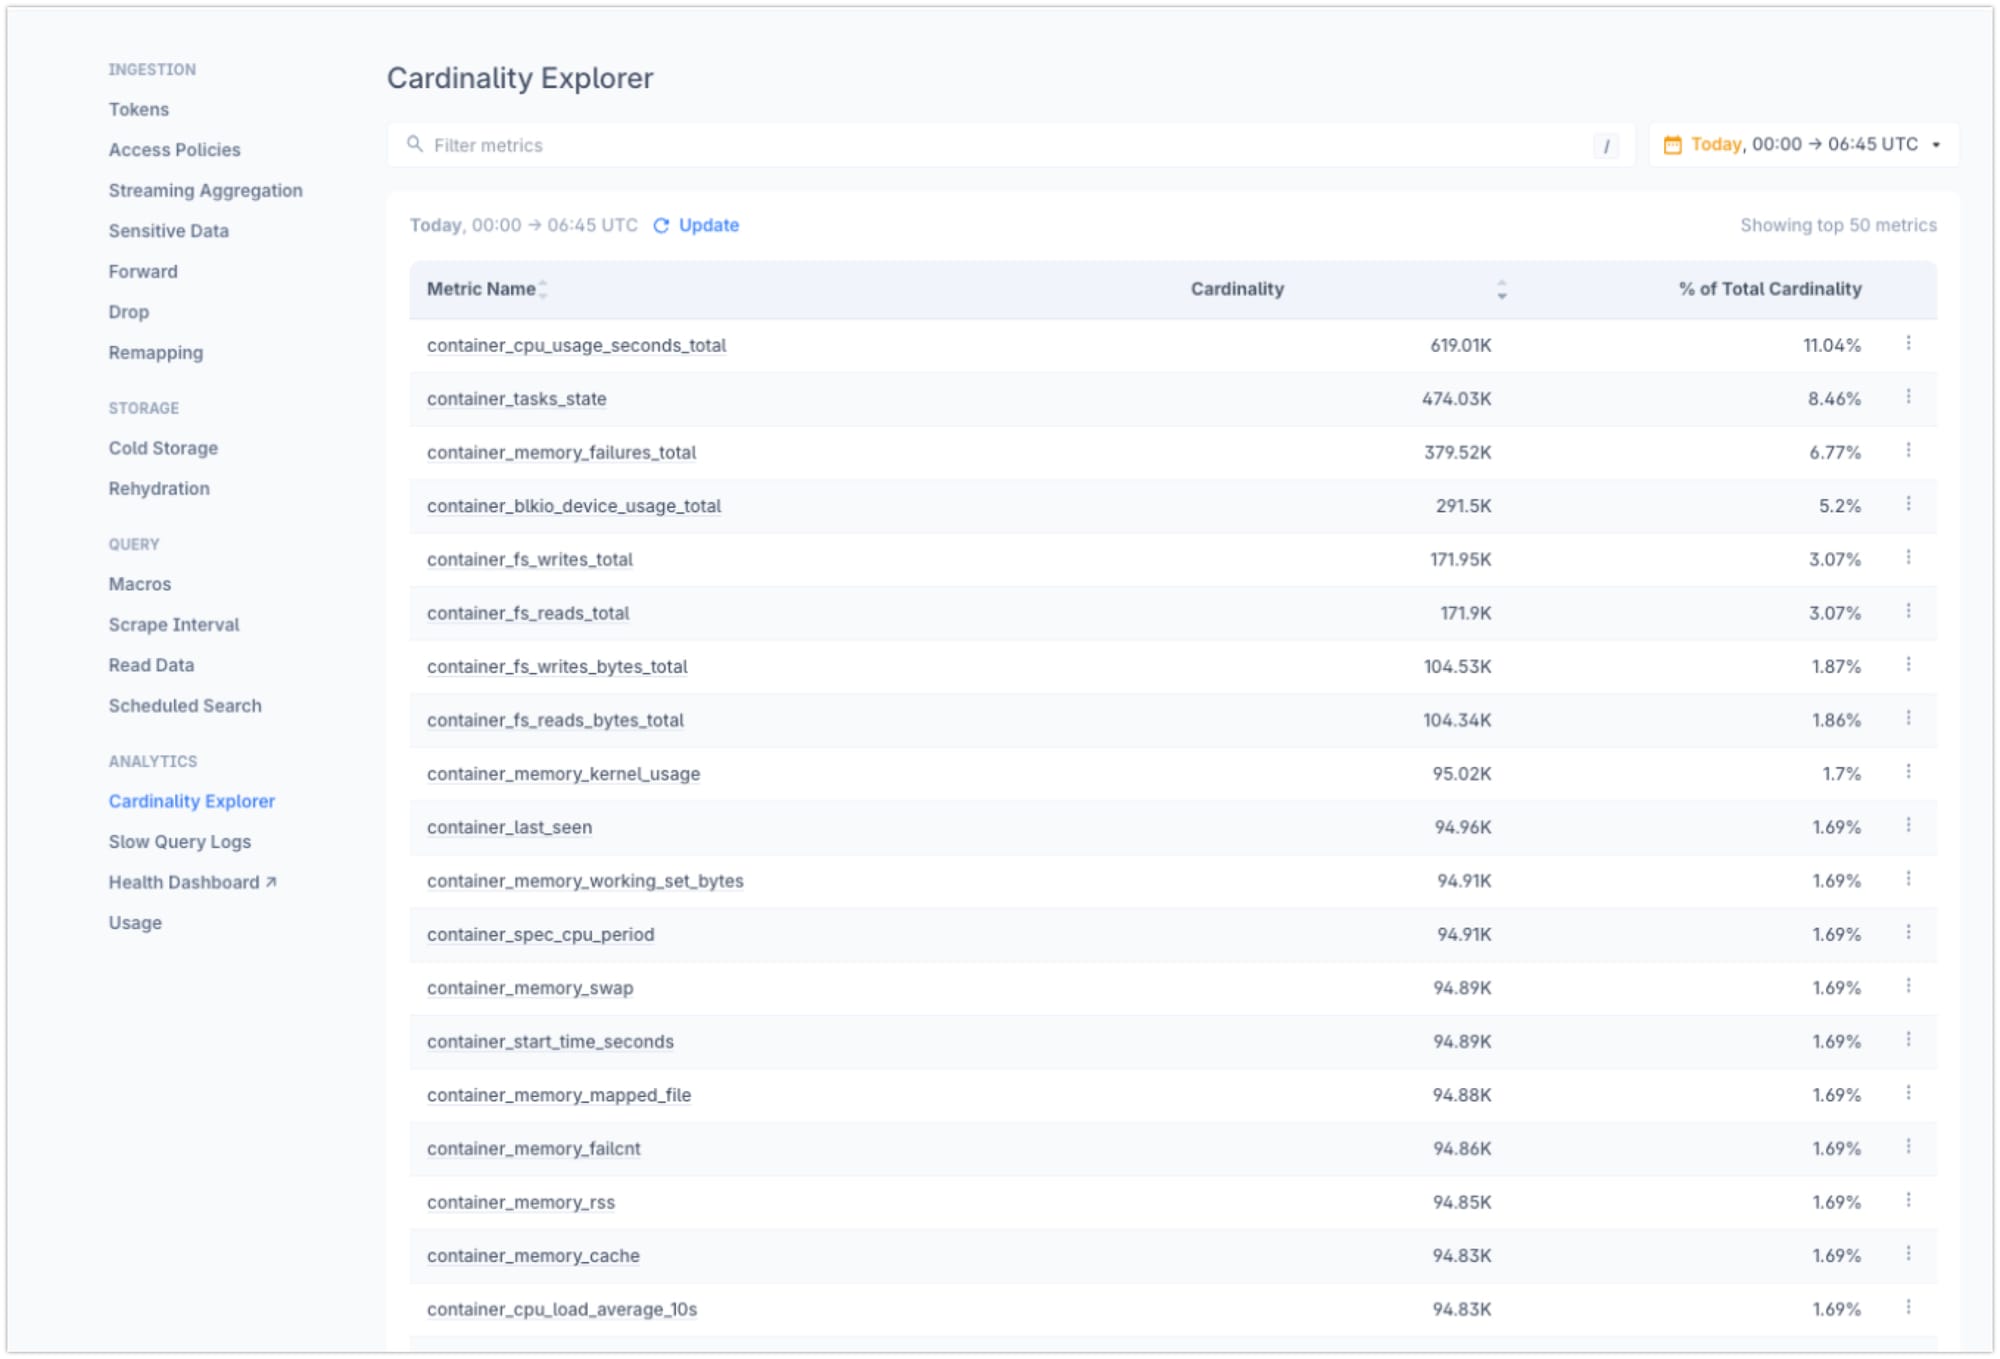
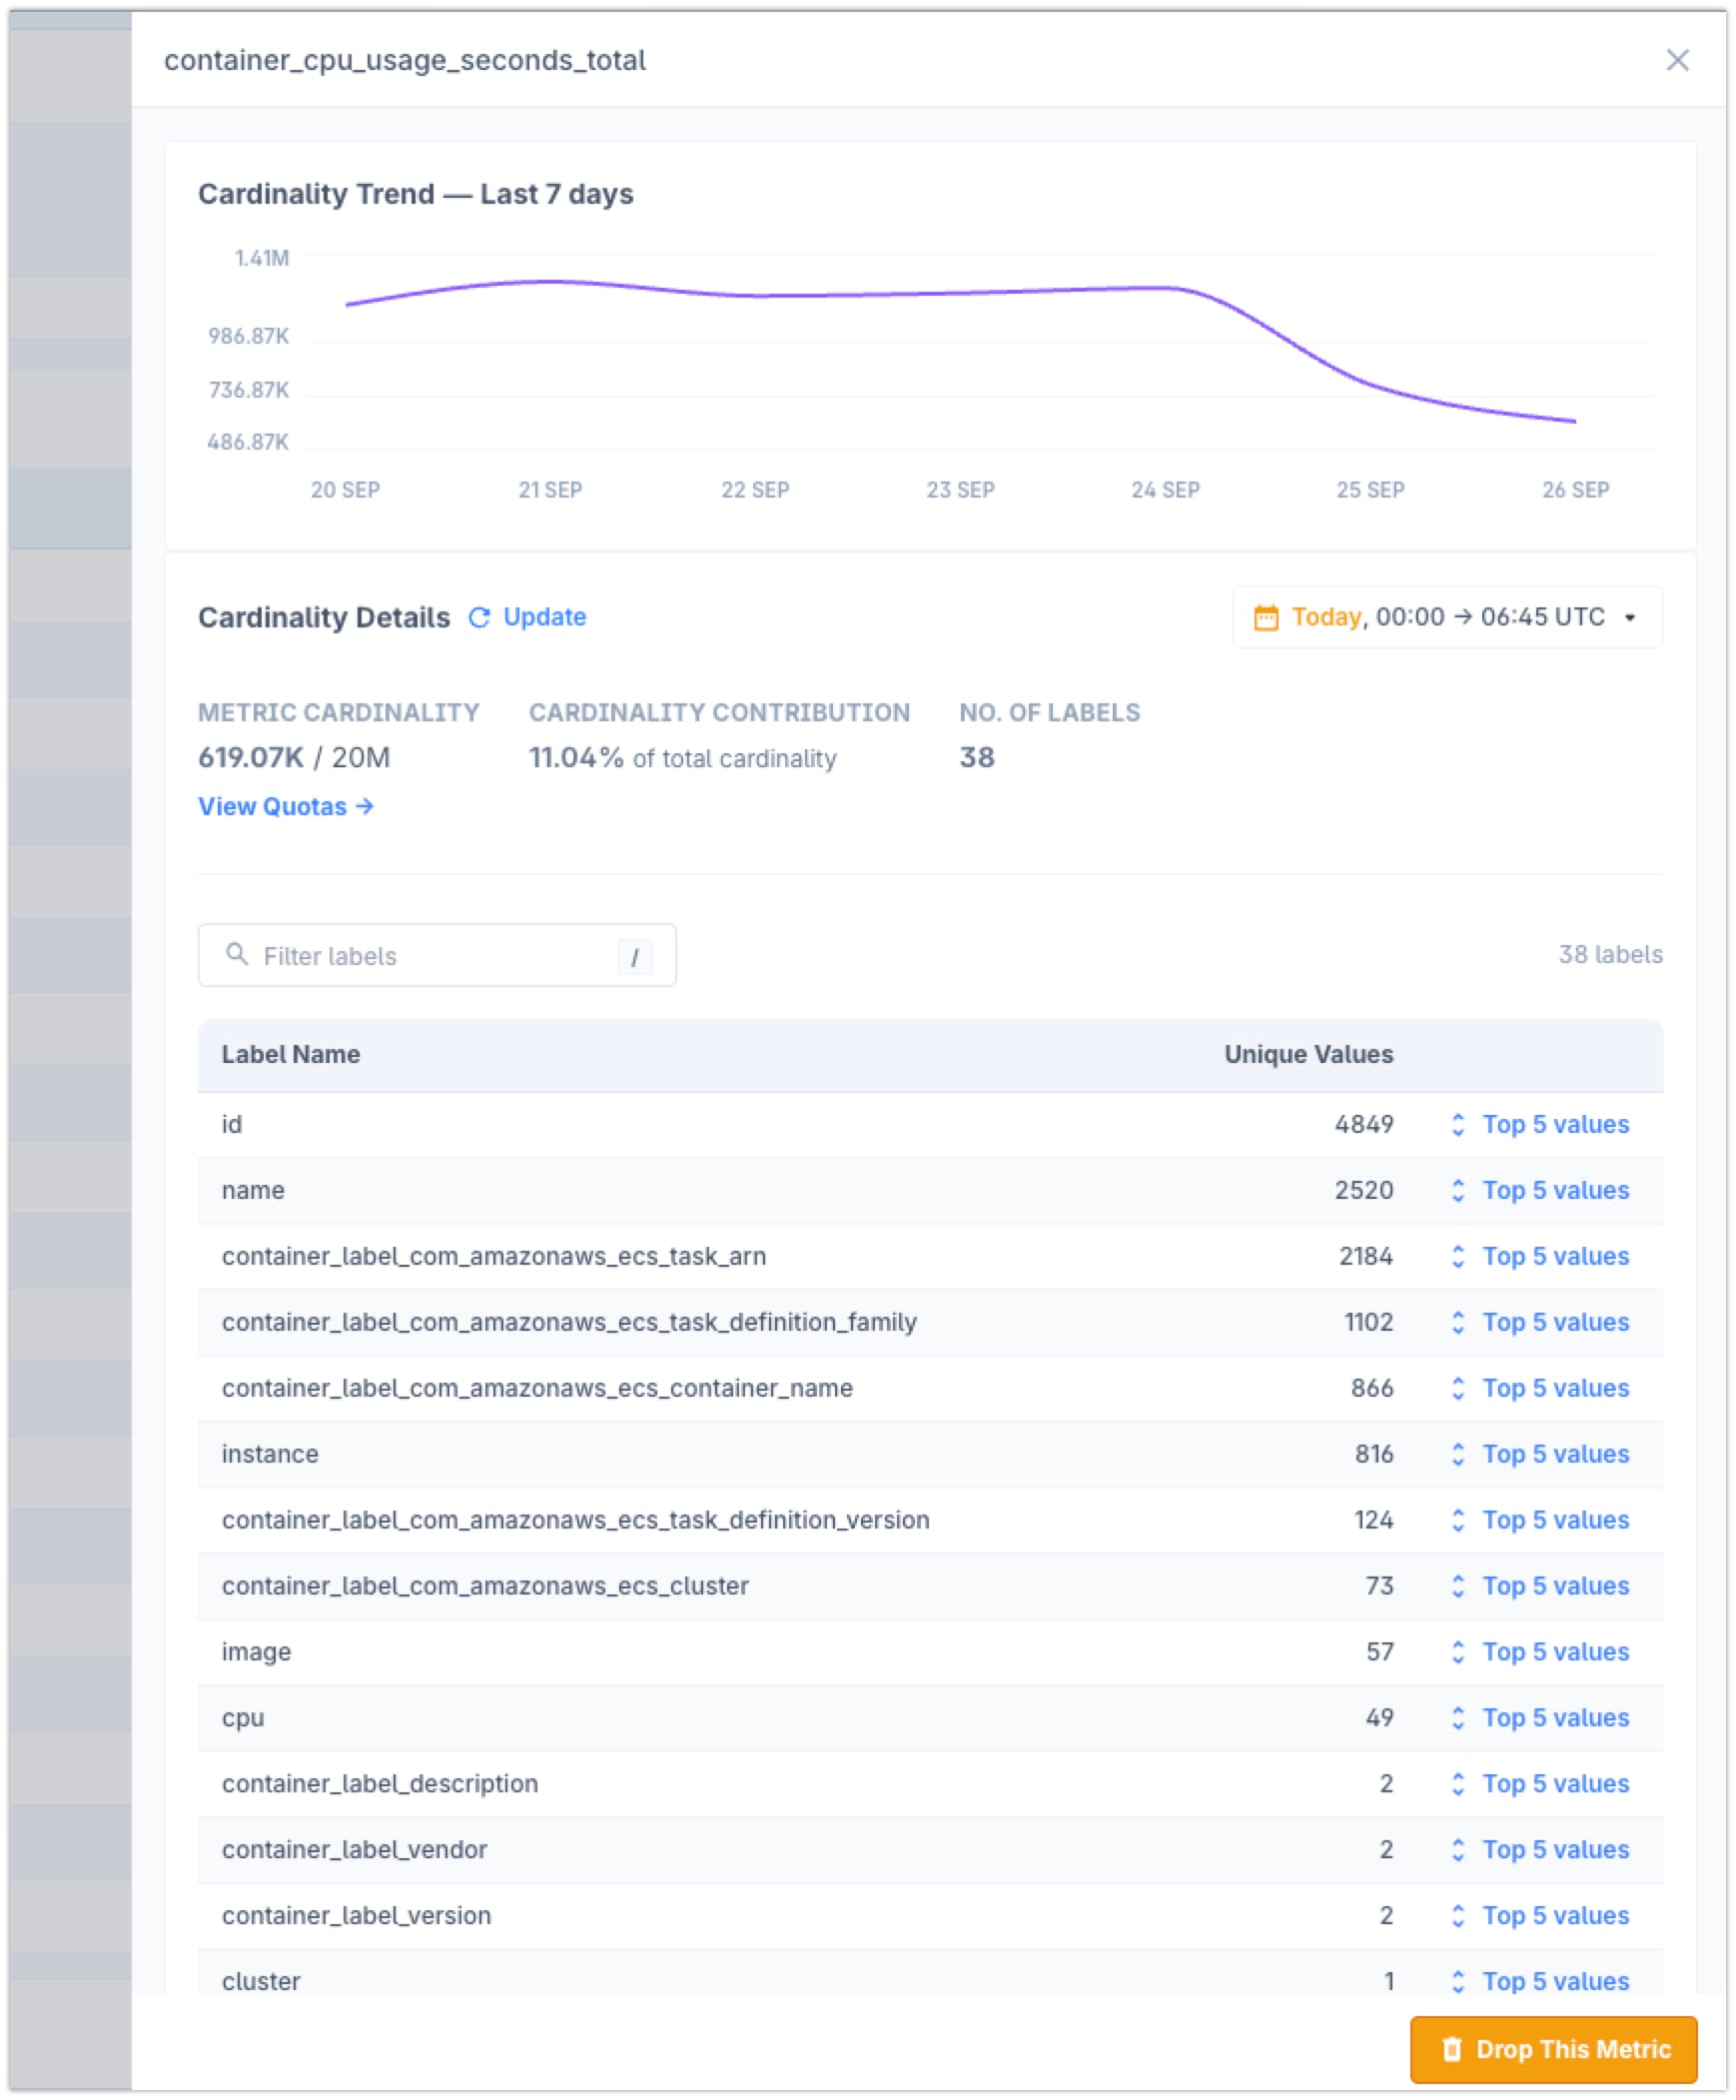
Metric: container_cpu_usage_seconds_total
Total Series: 619.70K

Label Cardinalities:
- id: 4849
- name: 2520
- ecs_task_arn: 2184
and more...
This UI would show that while container_label_version and container_label_description have low cardinality, name and especially id are contributing to an explosion in the number of time series.
Using Recording Rules to Aggregate High-Cardinality Metrics
To address this, we can use Recording Rules to pre-aggregate this data, reducing cardinality while still preserving useful information.
Here's an example:
groups:
  - name: container_cpu_usage_seconds_total
    rules:
      - record: job:container_cpu_usage_seconds_total:sum_rate5m
        expr: sum by (name, container_label_version, container_label_description) (rate(container_cpu_usage_seconds_total[5m]))
This Recording Rule does a few important things:
- It uses
sum byto aggregate across all paths and client IPs, significantly reducing cardinality. - It preserves important labels like
container_label_nameandcontainer_label_descriptionfor analysis. - It calculates the rate over 5 minutes, giving us a more useful metric for dashboards and alerts.
Benefits of This Approach
- Improved Query Performance: With fewer time series, queries against this data will be much faster.
- Reduced Storage Requirements: Storing 80-time series instead of millions saves significant disk space.
- Easier Dashboard Creation: Working with pre-aggregated data makes it simpler to create meaningful dashboards.
- More Reliable Alerting: Alerts based on aggregated data are less likely to be noisy or miss important trends.
Using Recording Rules to manage high-cardinality metrics allows us to retain the necessary granularity for effective monitoring while minimizing performance and storage challenges associated with extremely high-cardinality data.
Best Practices for Recording Rules
Through trial and error, I've developed some best practices for working with Recording Rules:
- Use Clear Naming Conventions: I always use a consistent naming scheme for my Recording Rules. In the example above, I used
job:node_cpu_utilization:avg_5m. This instantly tells me it's aggregated by job, it's about CPU utilization, and it's an average of over 5 minutes. - Keep Rules Simple: It's tempting to create complex Recording Rules, but I've found that simpler rules are easier to debug and maintain. If you need complex logic, consider breaking it down into multiple rules.
- Monitor Your Rules: Just like any other part of your system, Recording Rules need monitoring. I always set up alerts to notify me if a Recording Rule stops updating.
- Use Recording Rules Judiciously: While Recording Rules are powerful, they do consume resources. I only create Recording Rules for queries that are used frequently or are particularly expensive to compute on the fly.
- Version Control Your Rules: I always keep my Recording Rules in version control alongside my application code. This makes it easy to track changes and roll back if needed.
Advanced Techniques
Once you're comfortable with basic Recording Rules, there are some advanced techniques you can use:
- Chaining Recording Rules: You can use the output of one Recording Rule as input to another. This is great for building up complex metrics from simpler components.
- Using Math in Recording Rules: PromQL allows for mathematical operations in queries. I often use this to create percentage-based metrics or to normalize values.
- Utilizing Subqueries: For some complex aggregations, subqueries can be incredibly useful. However, use these sparingly as they can be resource-intensive.
Common Pitfalls to Avoid
In my journey with Prometheus Recording Rules, I've encountered a few pitfalls that are worth mentioning:
- Rule Name Collisions: Be careful not to create rules with the same name, even in different groups. This can lead to unexpected behavior.
- Overlapping Evaluation Periods: If your Recording Rule evaluation interval is longer than the time range in your query, you might get gaps in your data. Always ensure your evaluation interval is shorter than your query range.
- Ignoring Rule Performance: While Recording Rules can improve query performance, poorly designed rules can put a strain on your Prometheus server. Always monitor the impact of your rules.
Integrating with Alerting Rules
One of the most powerful aspects of Recording Rules is how well they integrate with Prometheus Alerting Rules. By pre-computing complex metrics, you can create more sophisticated alerts without sacrificing performance.
Here's an example of an Alerting Rule that uses a Recording Rule:
groups:
  - name: example
    rules:
      - alert: HighCPUUsage
        expr: job:node_cpu_utilization:avg_5m > 0.8
        for: 10m
        labels:
          severity: warning
        annotations:
          summary: High CPU usage detected
          description: CPU usage for {{ $labels.job }} is above 80% for more than 10 minutes.
This alert uses our previously defined Recording Rule to check for high CPU usage, demonstrating how Recording Rules can simplify your alerting setup.
Conclusion
Mastering Prometheus recording rules is a journey that combines technical know-how with practical experience. As you've seen throughout this guide, these rules are powerful tools for optimizing query performance, managing high-cardinality data, and streamlining your observability workflows.
Remember, while this guide provides a deep dive into recording rules, it's just one piece of the Prometheus puzzle.
To truly excel in your monitoring efforts, make the prometheus documentation your constant companion. The official docs are a treasure trove of information, covering everything from basic concepts to advanced configurations.
FAQs
Q: What is the difference between recording rules and alerting rules in Prometheus?
A: Recording rules precompute and store new time series while alerting rules evaluate conditions to trigger alerts. Often, recording rules feed into alerting rules for more efficient processing.
Q: How do I create and manage Prometheus recording rules for efficient time-series data storage?
A: Create a rules.yml file, define your rules using the YAML format, and reference this file in your Prometheus configuration. Manage them using version control and conduct regular audits.
Q: Are Prometheus recording rules the right tool for streaming aggregation?
A: While recording rules can provide aggregated data, they are not real-time streaming aggregation. For true streaming, consider tools like Flink or Kafka Streams. Recording rules operate on a pull-based model with defined intervals.
Q: How can I monitor the performance of my recording rules?
A: Use built-in Prometheus metrics like prometheus_rule_evaluation_duration_seconds and prometheus_rule_group_iterations_missed_total. These will help you identify slow or problematic rules.
Q: What can be monitored using Prometheus beyond just recording rules?
A: Prometheus can monitor virtually any system metric – from CPU and memory usage to application-specific metrics like request rates, error counts, and business KPIs. The key is having exporters or instrumentation that expose these metrics in a format Prometheus can scrape.