
Analyze, transform, and streamline your telemetry data
A first-class experience for a single pane of glass with end-to-end telemetry management to control your observability data and its costs.
A no-compromise telemetry warehouse, with the control levers it deserves.
Spend under 10% of your cloud budget on observability.
No sampling, but backed by pre-ingestion workflows.
Don't make tradeoffs between visibility and cost.

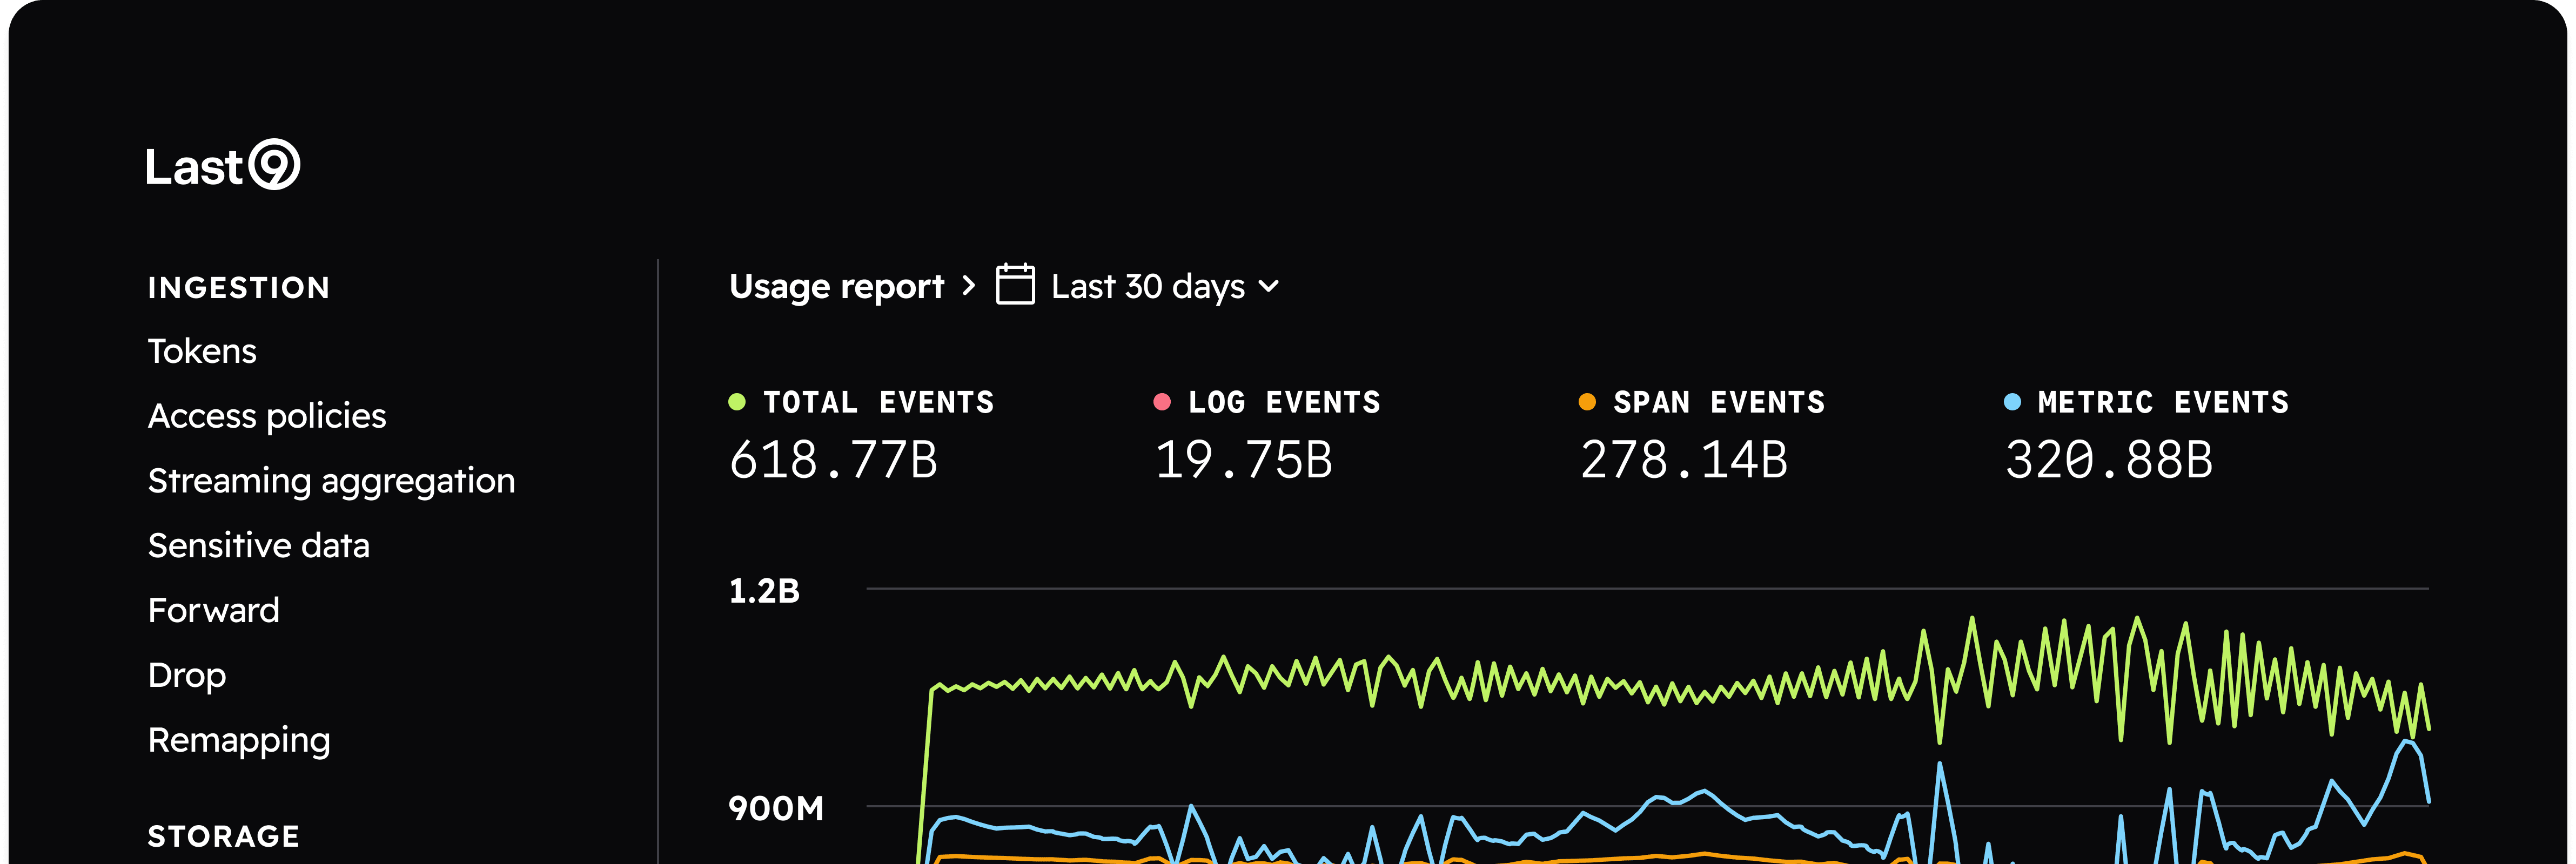
Ingestion
Shape telemetry data during ingestion, even before it is stored, without code changes or app redeployment.


Tokens & Access Policies
Define guard rails and limit data tier access only to authorized teams or query clients. Eg. Alerting workloads should be served only from the Blaze Tier.


Streaming Aggregations
Transform incoming data to control cardinality explosion by defining aggregated queries on a metric. Derive new metrics with reduced cardinality for specific cases.


Sensitive Information
Redact sensitive data from your telemetry data at time of ingestion, with pre-built templates for emails, phone numbers, and credit card numbers.


Filtering & Routing
Configure rules to forward without ingesting, drop, or extract and remap your telemetry data at runtime. Ingest only the data that you need.

Storage
Manage how your data is stored and accessed after the default retention periods.


Cold Storage
Post default retention periods, retain your data on your own AWS S3 in a cost-effective manner, always accessible as needed.


Rehydration
With on-demand rehydration, your telemetry data is never far away. 24-hours of data gets rehydrated in under an hour.

Query
Define and optimize how your data is interacted with at a query-level.


Macros
Write complex PromQL queries as reusable functions and use them as metric names across Alerting, Embedded Grafana or CLI.


Scheduled Search
Create periodic searches on telemetry data and set alerts when patterns are found or missing.

Analytics
Get visibility on usage with per-telemetry breakdown, cardinality quotas, and query performance.


Cardinality Explorer
Identify high cardinality metrics to refactor instrumentation or use Streaming Aggregations to optimize queries.


Slow Query Logs Search
Define aggregated queries to control cardinality explosion and derive new metrics with reduced cardinality for specific cases.
Using Last9's high cardinality workflows, we measured SLAs accurately, extracted system insights, and tracked customer impact proactively.
Ranjeet Walunj
SVP Engineering

Start observing for free. No lock-in.
OpenTelemetry · Prometheus
Just update your config. Start seeing data on Last9 in seconds.
Datadog · New Relic · Others
We've got you covered. Bring over your dashboards & alerts in one click.
Built on Open Standards
100+ integrations. OTel native, works with your existing stack.