Quickwork champions platform transparency for its customers with Last9
Key Points
90%
more cost-efficient than Datadog
High cardinality
Per-customer granular metrics
Reliability
Monitoring 50M transactions a day per customer
Talk to an expert
Talk to us to understand how Last9 can reduce costs, and manage cardinality.
Book a demoQuickwork is a no-code, enterprise-grade integration, and automation platform (iPaaS) that enables developers and companies to build workflows, publish APIs, and manage conversational interactions with customers, employees, and partners.
It integrates with over 1,500 applications across various domains, such as business, consumer, AI, analytics, messaging, and IoT, facilitating seamless data exchange to automate tasks in real-time without human intervention.
Many reputed enterprise customers like Axis Bank, Yes Bank, Unity Bank, Lupin, DMI Finance, Google Pay, and Samsung Pay use the Quickwork integration platform to process high volume transactions in real-time. Quickwork, with 10,000 workflows and 650 million transactions per day, wanted to provide transparency and visibility to their customers on the platform's performance for better platform capacity utilisation and provisioning.
Growing Pains
High Cardinality
Per customer monitoring of the platform
Scale
50M transactions per day across customers
Cost
Per customer visibility becoming cost-prohibitive
Reliability
Visualization and alerting high-cardinality data
The team at Quickwork is obsessed about customer satisfaction, and they wanted to resolve the above pain points by providing performance insights to their customers on certain KPIs related to workflows:
- Consumption
- Concurrency Quota
- CPU Quota
- Memory Quota
- Quality of Service and Latency
While putting together a plan for customer-level instrumentation of these metrics, the team also identified the challenges of dealing with the resultant high-cardinality data — leading to increased complexity in the use case, and with growing customers, their in-house setup was proving difficult to scale.
Prometheus' documentation discourages users from overusing labels; it is infamous for choking up when writing and reading high-cardinality data. Further, with serverless architecture, the container-based instrumentation of Prometheus runs into challenges like being unable to set up alerts for a large pool of ephemeral components. This leads to customers' lack of visibility into platform performance metrics.
Quickwork provides extra buffer capacity to help increase transaction volumes based on the customer's plan, and they wanted to eliminate the extra provisioning by giving customers visibility into how they use the Quickwork platform, giving insights into consumption patterns.
As they roll out monitoring for their customers, they intend to extend the observability from a per-workflow basis to a per-step basis, further increasing the cardinality of the data. With the plan to enable their customers to set up alerts on their data, the need for a purpose-built high-cardinality telemetry store that is efficient and cost-effective becomes more apparent.
The Last9 Advantage
Purpose-built for High Cardinality
Ground-up telemetry warehouse intended for high-dimensionality data
Proven Scale & Reliability
Cricket-scale traffic support for customers with 400M samples/min and 50M concurrent users
No Cost Surprises
Predictable single-metric billing mode based on the number of samples ingested
High cardinality data is essential for achieving granular observability. Hence, Last9 was built to ingest such data, and query and alert on it. Each metric has a default quota of 20M time series daily, which can be increased upon request. Last9 also has no limits on the number of metrics, while custom metrics in tools like Datadog inflate costs significantly, leading to teams adding instrumentation constraints.
Having powered monitoring for large-scale live streaming events, Last9 gave Quickwork confidence that their needs can be supported — to enable per-customer monitoring for their engineering team and provide visibility into per-workflow metrics for their customers.
Cardinality Explorer 's streamlined and unified experience for identifying impacted metrics and their label values, combined with Streaming Aggregation to control such metrics at the ingestion level, gives the Quickwork team unprecedented control of their telemetry without much instrumentation change.
Built to support Open Standards, starting the PoC on Last9 became as easy as changing a Prometheus configuration file for Quickwork.
The Quickwork team duplicated their existing Grafana dashboards, simply changed the source URL to point to Last9, and they were up and ready for review. Over the three weeks, as they reviewed performance and scale, they could start deprecating the monitoring infra on their end with bare minimum code changes.

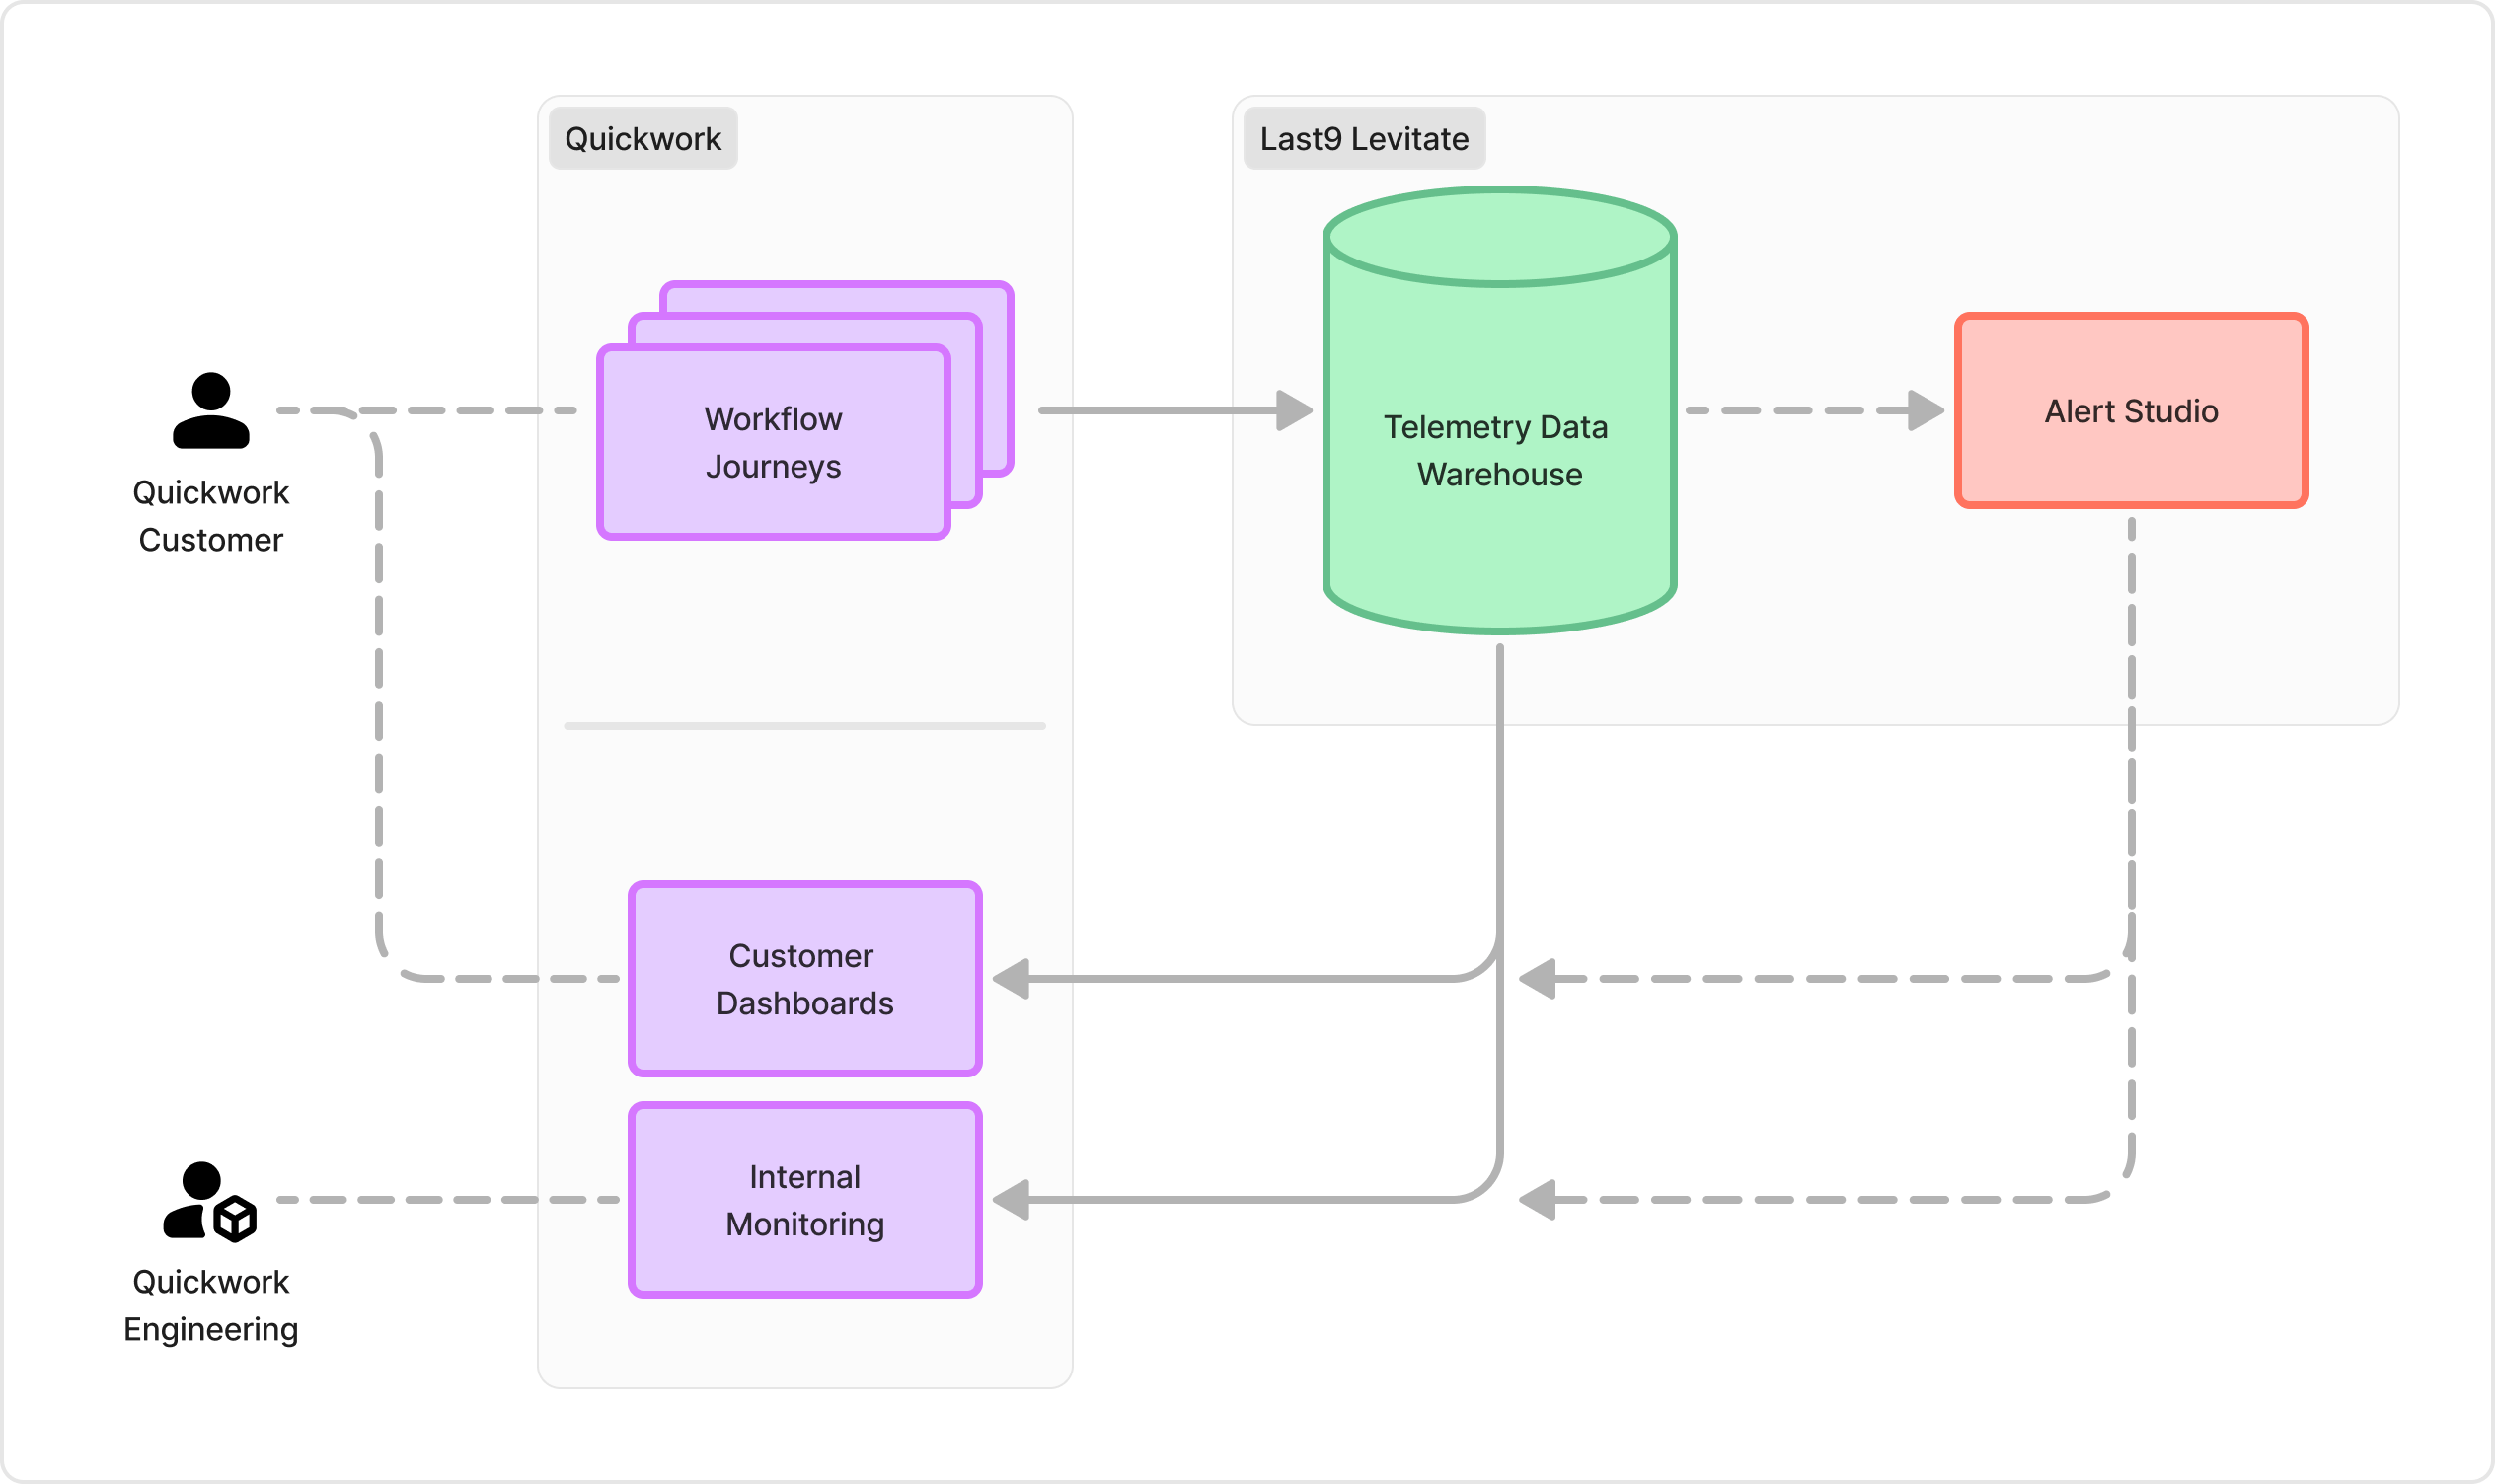
Quickwork's workflow journey metrics are scraped and pushed to Last9 to enable per-workflow monitoring for their customers. The Last9 API is then used to fetch metrics from the Telemetry Data Warehouse and configure & evaluate alert configurations from Alert Studio to power both:
- the Grafana dashboards and alerting used by Quickwork's engineering team, and
- the Quickwork iPaaS dashboard is used by its customers to monitor and set alerts on their workflow metrics

The ease with which Last9 does the heavy lifting for us with high-cardinality data at massive scale is phenomenal. Enabling per-customer monitoring and making the metrics visible to our customers in their dashboards to improve CSAT became a no-brainer.
Krish Advani
Co-founder & CTO
Key results
Per Customer Observability
Ability to provide real-time metrics to each customer
Improved Granular Monitoring
Workflow health metrics beyond successes and failures
Higher Customer Satisfaction
Better transparency of workflow health for proactive management
Increased ROI
Improved reliability, yet cost-effective, and ease of portability due to Open Standards support
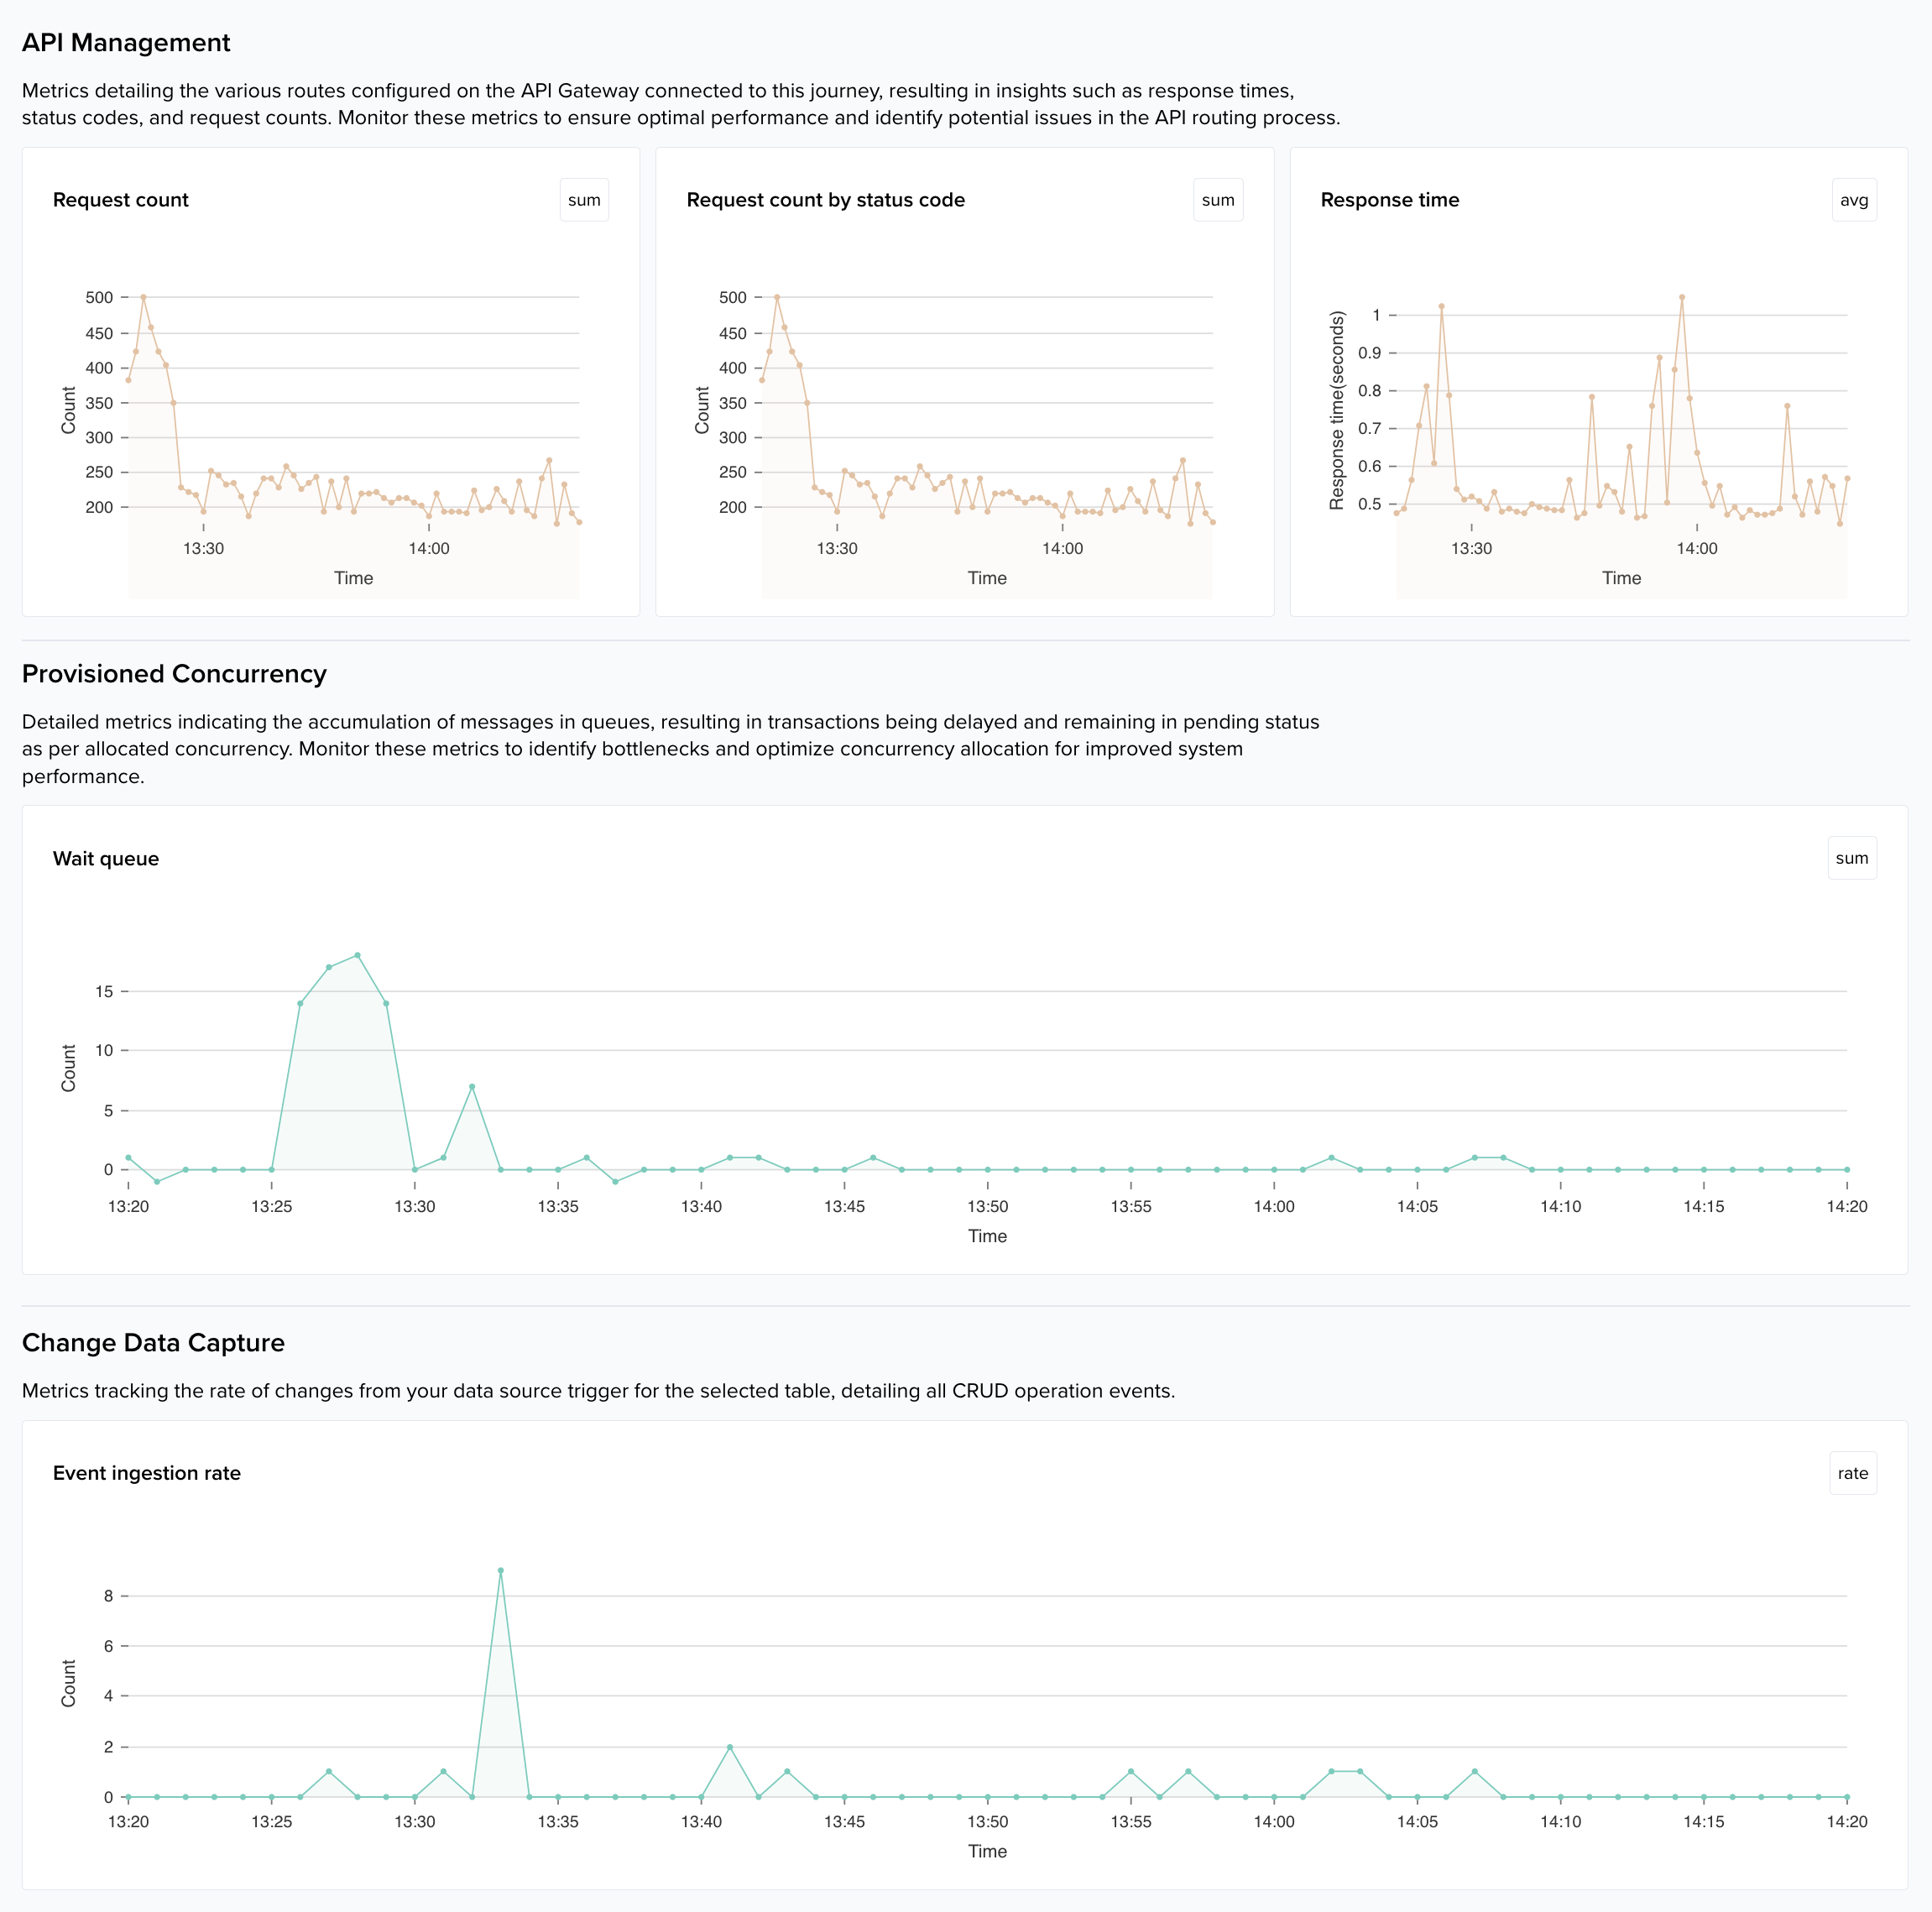
After a quick three-week POC, the Quickwork team was able to finalize Last9 as the solution to power their embedded monitoring on a per-customer level. Today, their customer dashboards go beyond transaction counts and workflow successes and failures to include concurrency, status codes, response time, and more, along with the ability to set up alerts to ensure customer satisfaction and higher CSAT scores.
Related posts

Understanding “Cricket Scale”
How does a DevOps/Site Reliability Engineer plan for "Cricket scale"? How do you warm systems' about to witness 30+ million concurrent users?
Aniket Rao

Observability—OSS vs Paid vs Managed OSS
The Reliability industry needs a managed, non-vendor lock-in answer to spiraling costs, high cardinality and the toil of managing a tsdb
Satyajeet Jadhav

Take back control of your Monitoring
Take back control of your Monitoring with Levitate - a managed time series data warehouse
Nishant Modak
Just update your config. Start seeing data on Last9 in seconds.
We've got you covered. Bring over your dashboards & alerts in one click.
100+ integrations. OTel native, works with your existing stack.
 Gartner Cool Vendor 2025