
Probo Cuts Monitoring Costs by 90% with Last9
Key Points
90%
more cost-efficient than New Relic and AWS Cloudwatch
Open standards
Prometheus and OpenTelemetry compatible
Automation
GitOps-based declarative workflows for Alerting
Talk to an expert
Talk to us to understand how Last9 can reduce costs, and manage cardinality.
Book a demoProbo is an opinion trading platform where users can invest based on their viewpoints on various topics such as sports, entertainment, economy, and finance.
The platform allows users to trade on real events, offering features like market orders and the ability to exit trades to manage losses and maximize profits. Probo emphasizes responsible trading, providing news and insights to help users make informed decisions.
Growing Pains
Lack of Single Pane
Single point of monitoring and correlation becomes difficult with multiple tools like New Relic and Cloudwatch
Vendor Lock-in
Proprietary layers in the stack make portability and experimenting with emerging technologies difficult
Prohibitive Pricing
Each tool with its multi-metric pricing model becomes expensive and unpredictable
With a growing user base, Probo's monitoring stack was getting expensive for the engineering team to maintain. While traffic on a normal day would hover around 200K requests per minute, the platform would see jumps of >2.5x in short durations and reach 2.5M requests per minute during peak moments of an IPL cricket match. While New Relic's volume-and-user-based pricing is predictable, it can go out of hand very quickly. And, AWS Cloudwatch's per-query pricing would make them optimize their dashboards when they should ideally be focusing on their system health and scaling components like RDS, Elasticache, and EKS.
As they looked at options to optimize their costs, they were also keen to move to a platform built on Open Standards that allows them to have a single pane of observability in the future. As a small SRE team managing the infrastructure, making developers self-sufficient was another goal the Probo team was trying to achieve. This means the monitoring tool should be embraced by everyone in the team instead of being controlled by only a few.
The Last9 Advantage
No Cost Surprises
Predictable single-metric billing mode based on the number of samples ingested
Open Standards
Prometheus and OpenTelemetry compatible data warehouse
GitOps Workflows
Declarative workflow for alerting and dashboard automation for every team
Excellent Support
An engineering team that talks to its customers and is aligned with their outcomes
Embracing Open Standards from day one and building Last9 to be compatible with Prometheus and OpenTelemetry allows us to not only be cost-effective but also support a large ecosystem of integrations and tools for our customers. Getting started with Last9 takes only 5 minutes with the OpenTelemetry integrations support.
Last9 took away the toil of setting up monitoring that works flawlessly at scale, and that too, with high cardinality data. We had one less thing to worry about and could focus on serving our user base during the peak moments.
Ashish Garg
CTO
Seeing engineering teams optimize for cost instead of granular monitoring pains us at Last9. This is why we have a simple single-metric billing model based on the number of events ingested. That's it. No per-user charge. No per-query charge. We want you to be able to freely read the data that you've written and use it for alerting.
Our existing customer base, including Disney+ Hotstar and Clevertap, which uses Last9 to monitor large-scale live-streaming events like the Indian Premier League and Cricket World Cup tournaments, also faces the same challenges of sudden spikes in traffic as seen by Probo's platform. This gave their engineering team the confidence to go ahead with Last9 as their monitoring and alerting tool.
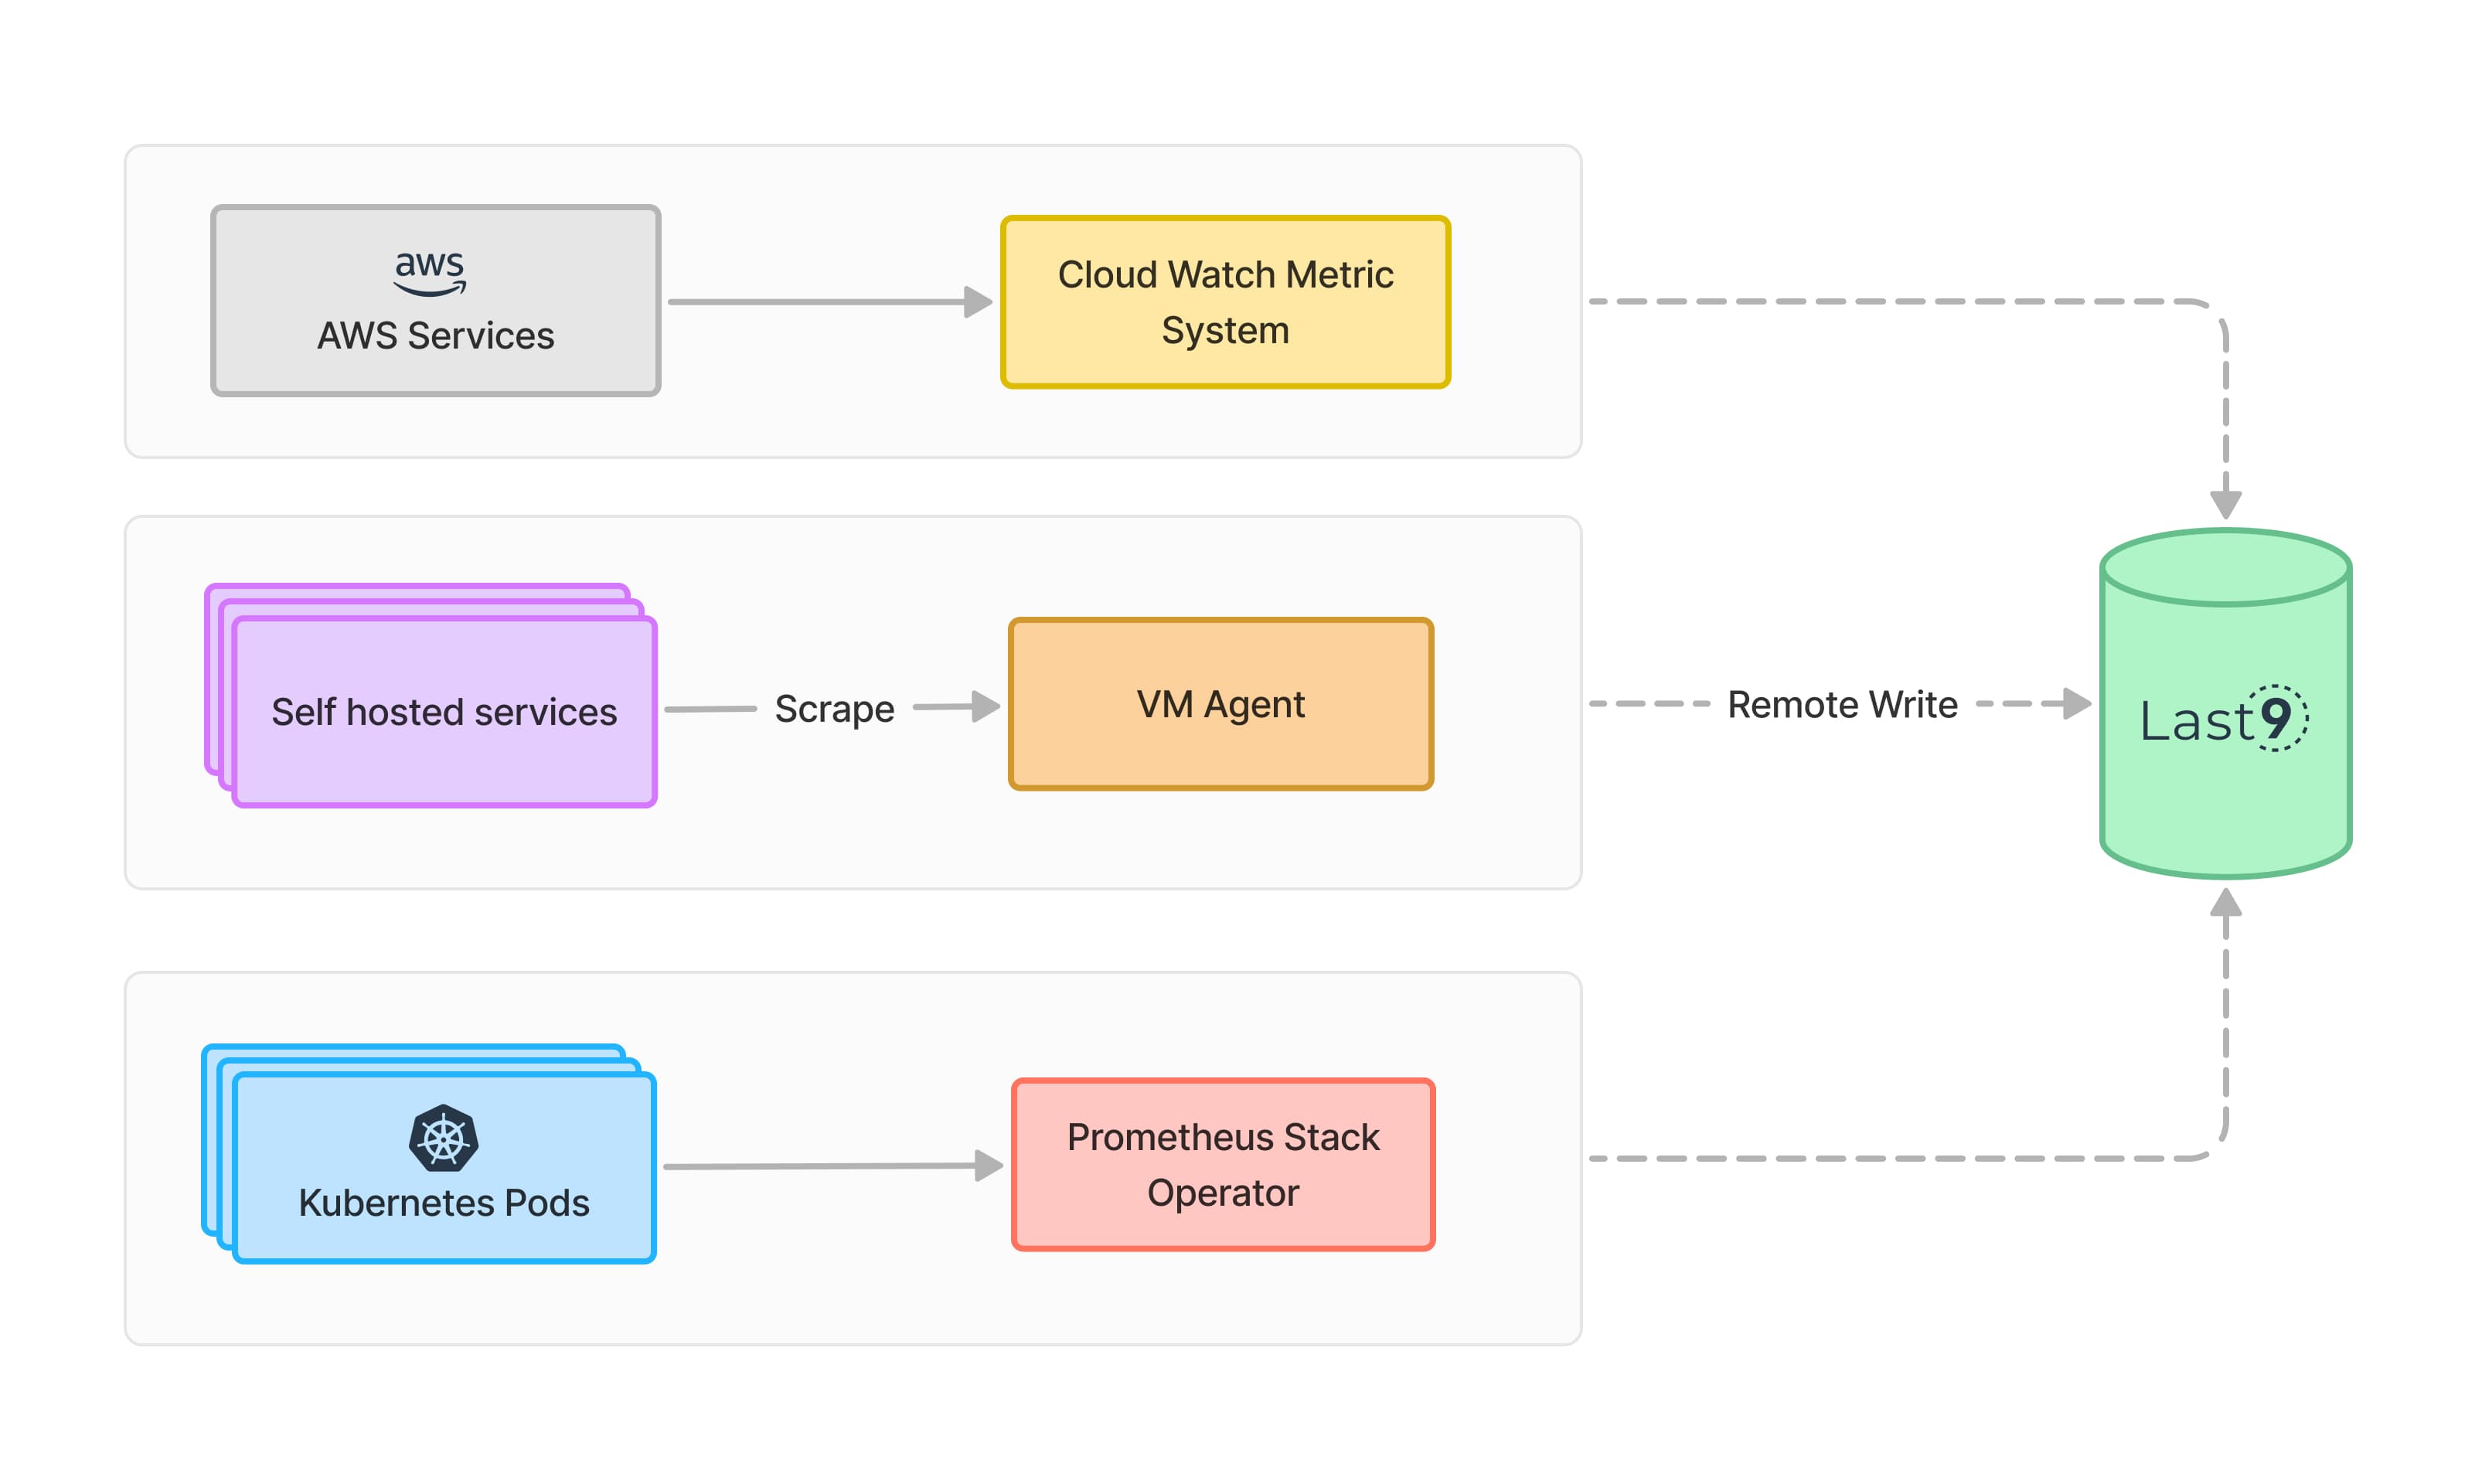
Their AWS services send data to Last9 via CloudWatch Metric Stream, while vmagent scrapes the self-hosted services and remote writes the metrics data to Last9. A Prometheus Operator spins up and manages service discovery and ingestion from Kubernetes.
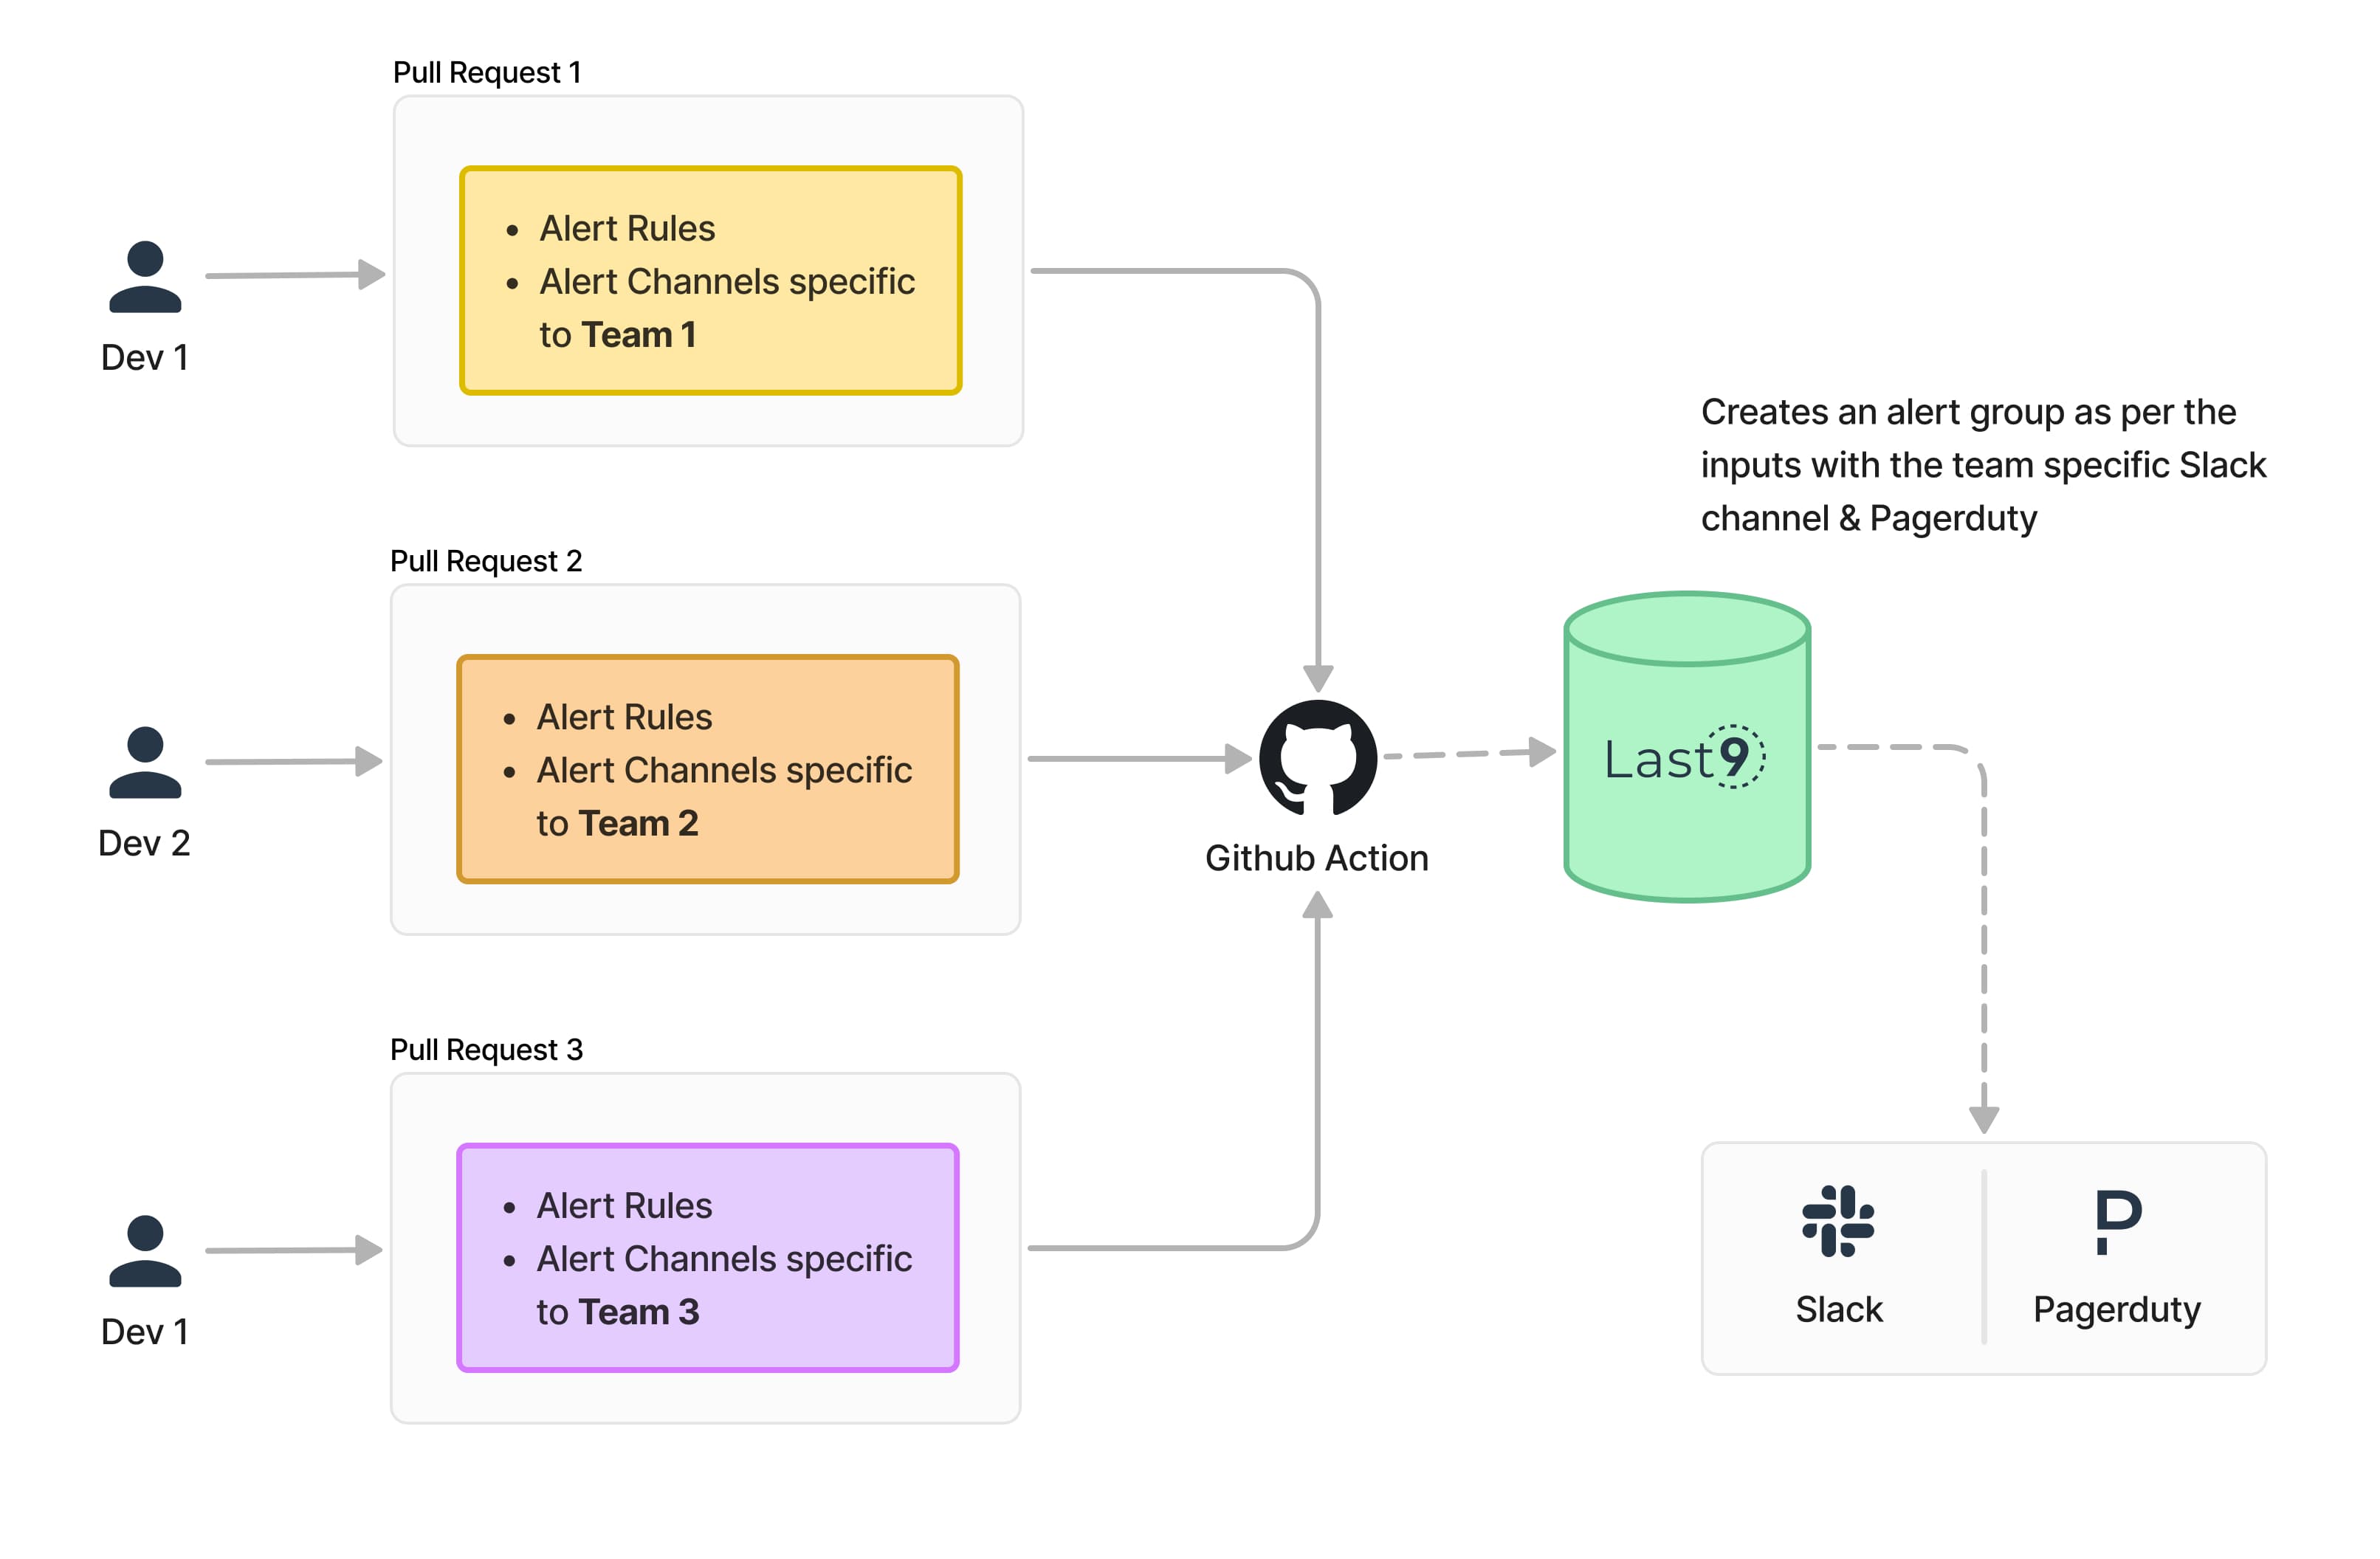
Each team uses Declarative Alerting via IaC to automate alerting and keep it updated via service discovery — a pull request is raised and changes are applied via GitHub Actions. As part of the automation YAML, the teams are also able to declare team-specific Slack and PagerDuty channels. One of the principles listed on their engineering blog is "high agency, always" and this allows them to democratize alerting across the engineering team and not be limited to the platform team.
Automation, automation, automation. That's how we work at Probo and Last9's alerting just fits like a glove into that workflow. Reliable, easy to integrate, and exceptional customer support.
Aditya Chowdhry
Platform Lead
Key results
Cost Effective
Ability to scale monitoring to peak traffic and get granular without pricing headaches
Single Pane of Observability
Reduced MTTD by correlation of data between services from across platforms
Democratized Alerting
GitOps workflow seamlessly fits in existing developer experience
With all relevant data coming into Last9, the Probo engineering team now has a bird's eye view of their system's main components in a master dashboard, allowing them to get to the root cause faster. Maintaining a large set of alerting rules, especially in today's ephemeral cloud environment, is improved by automating the rules to be created and deleted as the service discovery is updated.
Having replaced Probo's current stack for infrastructure monitoring, Last9's compatibility with OpenTelemetry now unlocks application performance monitoring as well as the next phase of a single pane of observability.
Related posts

Understanding “Cricket Scale”
How does a DevOps/Site Reliability Engineer plan for "Cricket scale"? How do you warm systems' about to witness 30+ million concurrent users?
Aniket Rao
Observability—OSS vs Paid vs Managed OSS
The Reliability industry needs a managed, non-vendor lock-in answer to spiraling costs, high cardinality and the toil of managing a tsdb
Satyajeet Jadhav

Take back control of your Monitoring
Take back control of your Monitoring with Levitate - a managed time series data warehouse
Nishant Modak

Just update your config. Start seeing data on Last9 in seconds.
We've got you covered. Bring over your dashboards & alerts in one click.
100+ integrations. OTel native, works with your existing stack.