
Real User Monitoring Enhancements
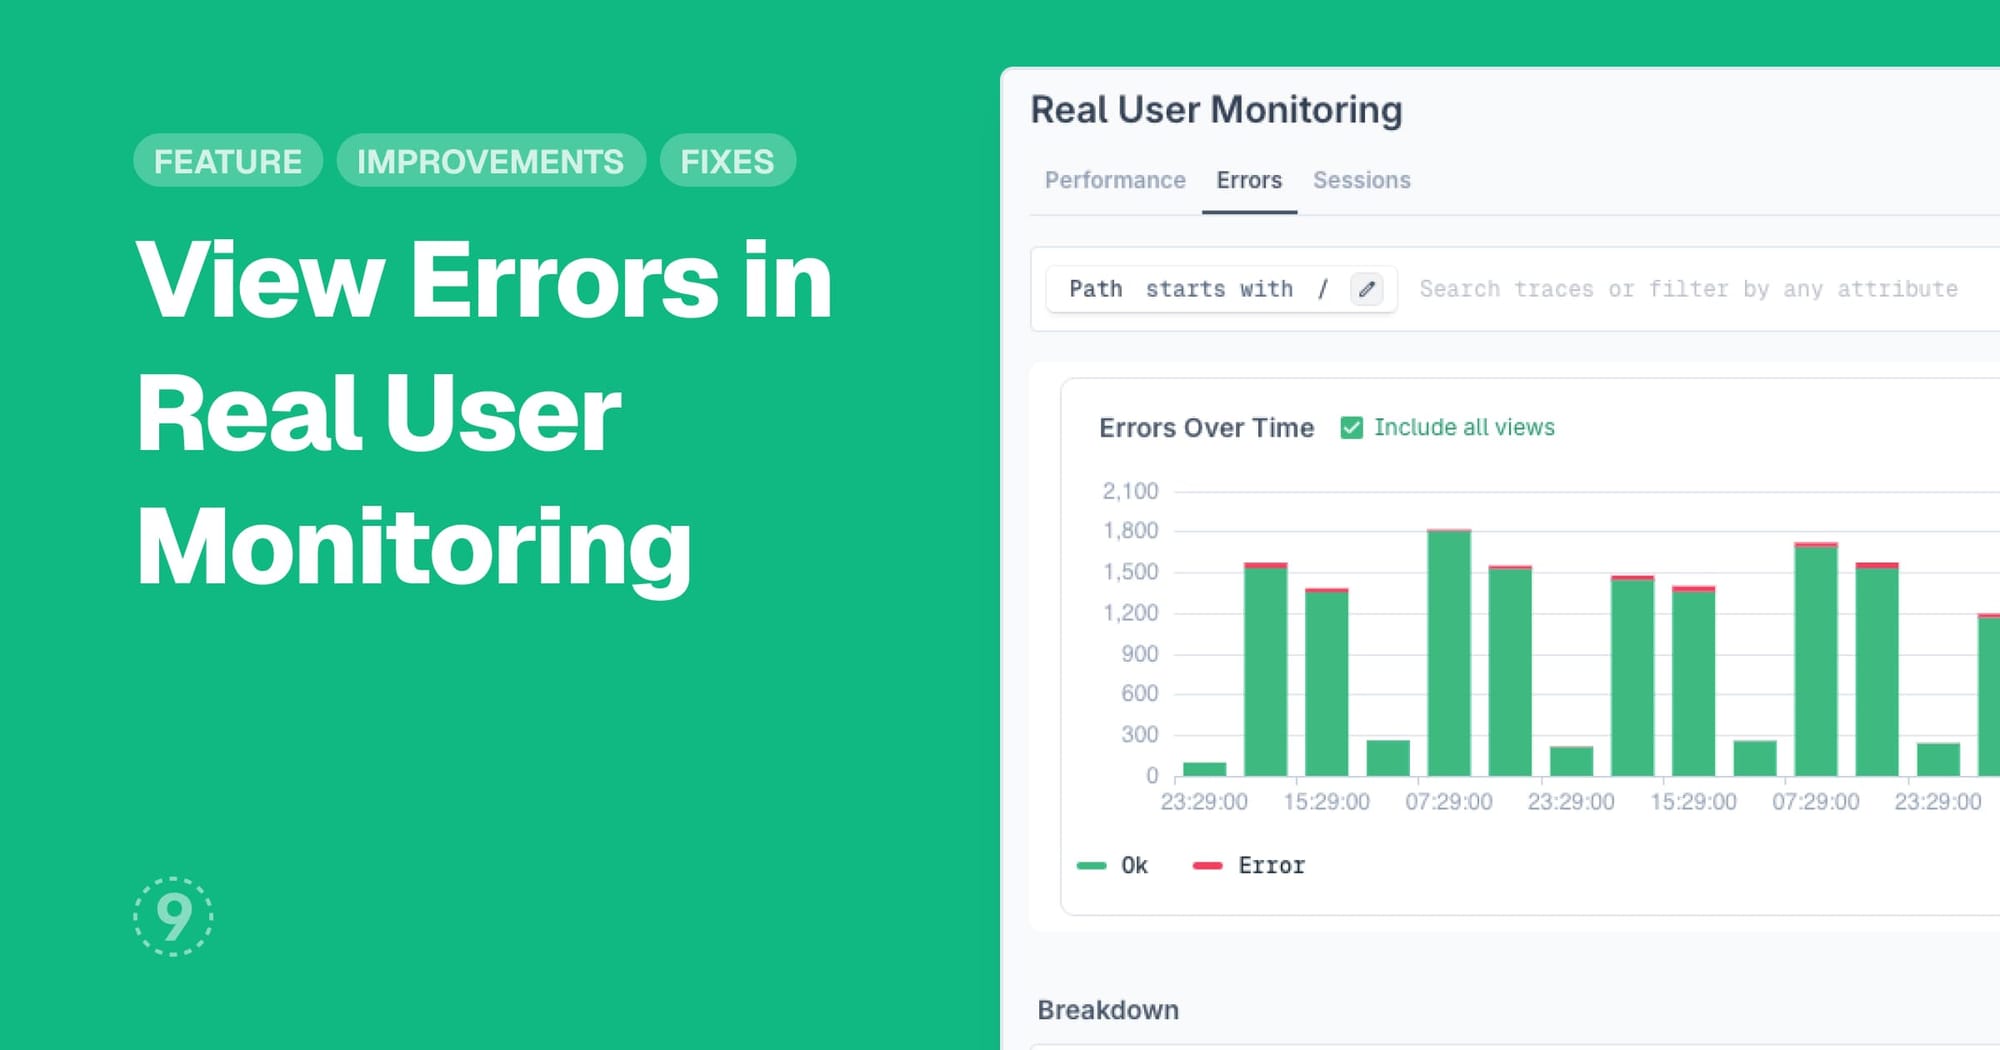
Monitor and analyze frontend errors directly within your RUM dashboard, now with enhanced grouping capabilities for deeper performance insights. Track JavaScript errors, network failures, and user experience issues alongside performance metrics.
- Complete error analytics with count and trend visualization over time
- Breakdown analysis by browser, screen size, network type, and device type
- Top error paths identification for faster troubleshooting
- Group by support added to RUM Performance tab for data segmentation by browser, device, network conditions, or custom attributes
- Color-coded visualizations for comparative analysis across user segments
Traces Explorer Query Builder
Build complex trace queries through an intuitive interface without writing aggregation syntax manually. The new trace builder mode transforms how you analyze distributed tracing data.
- Drag-and-drop interface for creating filters and aggregations
- Full operation support including parse (JSONP, Regexp), filter, aggregate (Sum, Min, Max, Average, Count, Median, Standard Deviation, Variance, Quantile), and transform functions
- Real-time query preview as you build
Improvements
- Discover Services:
- Added time spent column to operations table for better performance insights
- Improved memory usage pie chart percentage calculations for accuracy
- Discover Kubernetes:
- Fixed data persistence issues when refreshing StatefulSet pages
- Updated row content vertical alignment in StatefulSet tables
- Improved browser title and page title reflection for StatefulSet selection
- Better URL parameter handling by moving selected StatefulSet from query params to URL path
Fixes
- Discover Kubernetes:
- Charts in StatefulSet metrics tab no longer stop showing data after zoom-in operations