
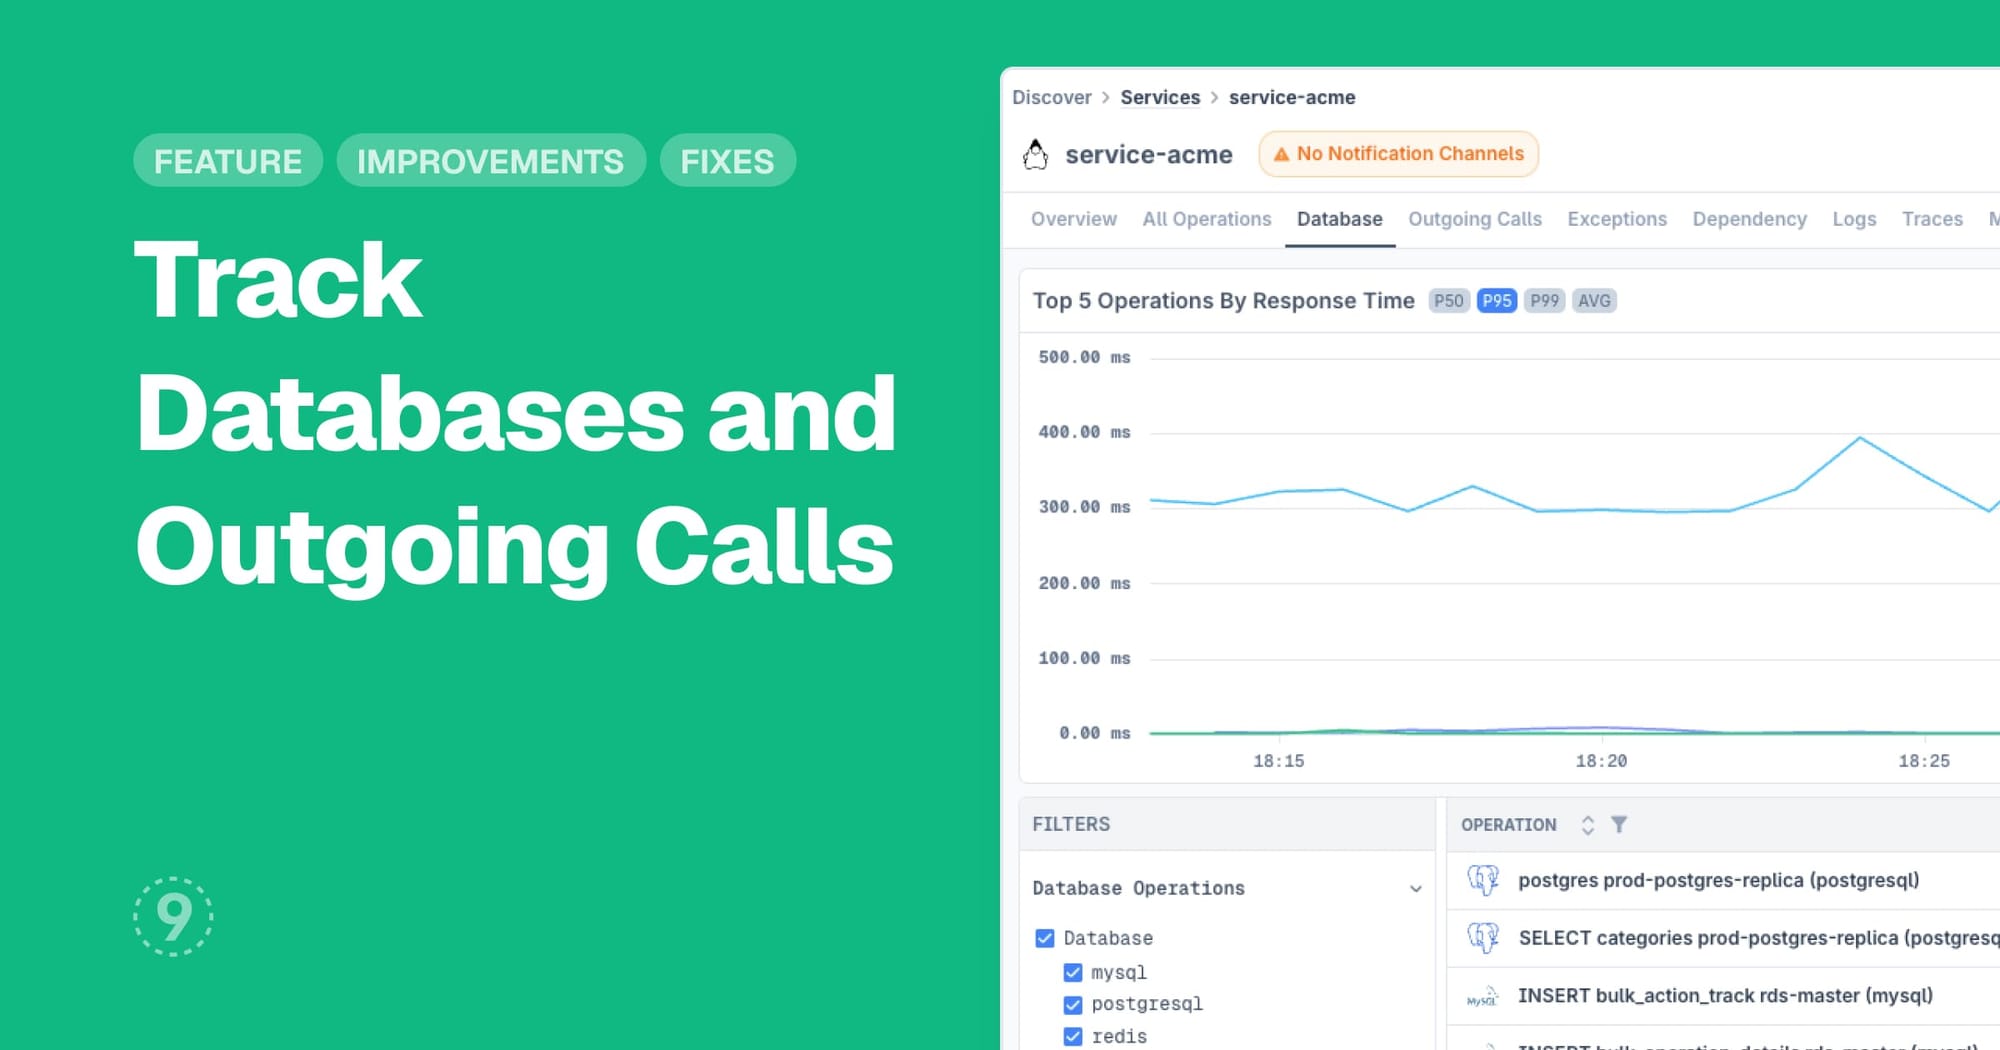
Discover Services now provides dedicated views for different types of operations, making it easier to understand how your applications interact with databases and external APIs. Plus, you can now create alerts directly from any service chart.
- Database Operations: Track MySQL, PostgreSQL, Redis, and other database performance with dedicated filtering and response time analysis
- Outgoing Calls: Monitor HTTP client calls and third-party API dependencies with throughput and error rate tracking
- Streamlined alert creation: Set up monitoring rules directly from service charts with preview functionality and built-in templates
- Enhanced operations breakdown: Response time columns provide immediate performance insights
For more, read our docs.
Improvements
- Discover Services:
- Added response time columns to operations breakdown tables for faster performance analysis
- Better URL persistence maintains your selected filters when navigating between service tabs
- Improved dependency graph visualization with better zoom defaults and clearer connection indicators
- Traces Explorer:
- Enhanced span details in traces now display span types and HTTP status codes
Fixes
- Dashboards:
- Tooltip display issues with bar charts were not showing values correctly
- Panel flickering when changing time ranges in dashboard views was causing display problems
- Query validation errors in dashboard panel editor were preventing proper configuration