
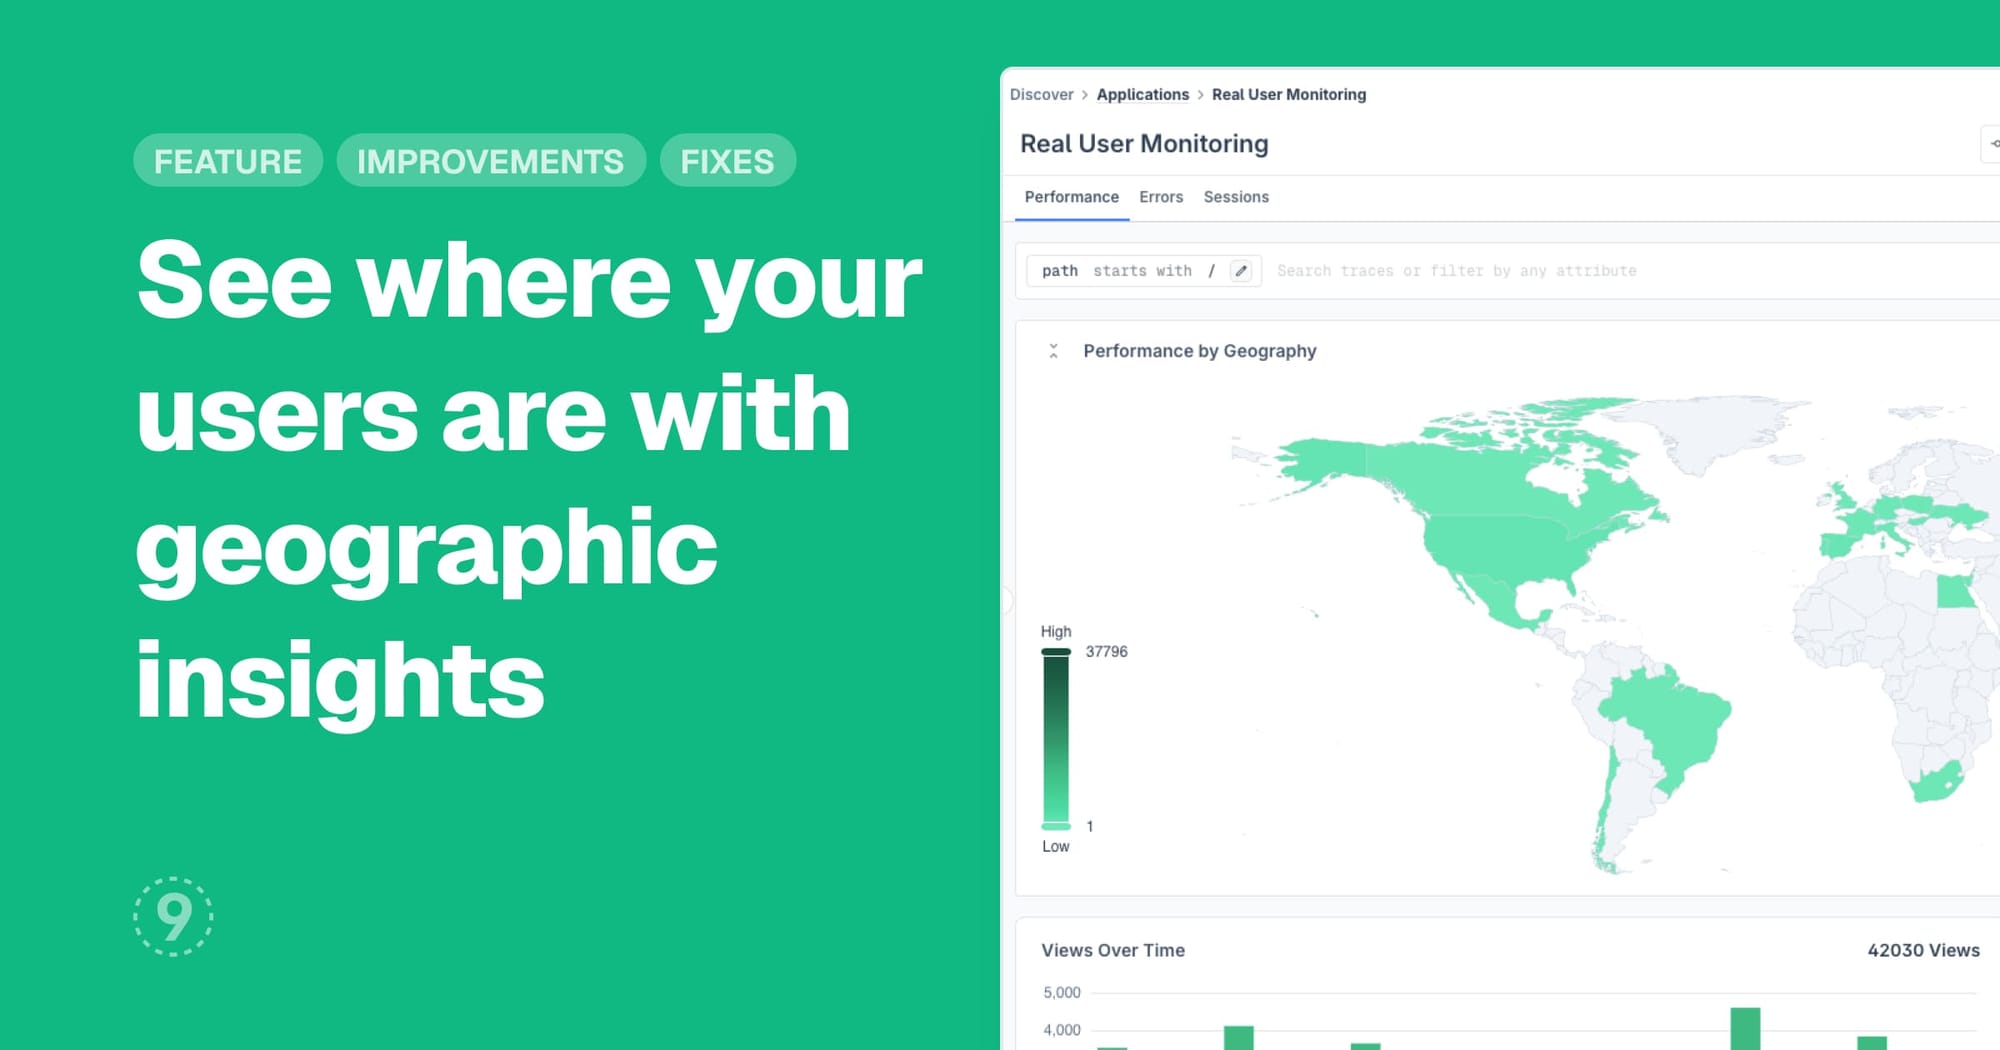
Discover Applications (Real User Monitoring) now includes geographic distribution maps that show how your application performs across different regions. You can visualize error rates and session volumes by country and city, helping you identify location-specific performance issues.
Key benefits:
- View error and session distribution on interactive maps
- Filter by connection type (4G, 3G, 2G, WiFi, Slow 2G) to understand network-related patterns
- Group data by ISP and ASN for deeper network analysis
- Identify regional performance bottlenecks at a glance
Improvements
- Dashboards: Click on any data point in charts to access contextual links for Related Logs and Related Traces, plus direct access to service details and exception information
- Discover Services: Dependency Graph now displays response times in appropriate units (seconds, minutes, hours, days) instead of always showing milliseconds, with clearer formatted values and unit labels
- Discover Applications: Browser SDK now requires explicit opt-in for geolocation data collection through the
geoIpEnabledconfiguration flag, disabled by default to enhance user privacy - Traces: Trace Details View now displays the 'Target' field in span details, showing HTTP target paths for more comprehensive trace analysis
Fixes
- Date picker in the Control Plane rehydration index page was getting cropped at the edges
- Traces Details side panel was showing a loading state instead of displaying "No traces found" message when a valid trace ID wasn't present in the queried time range