
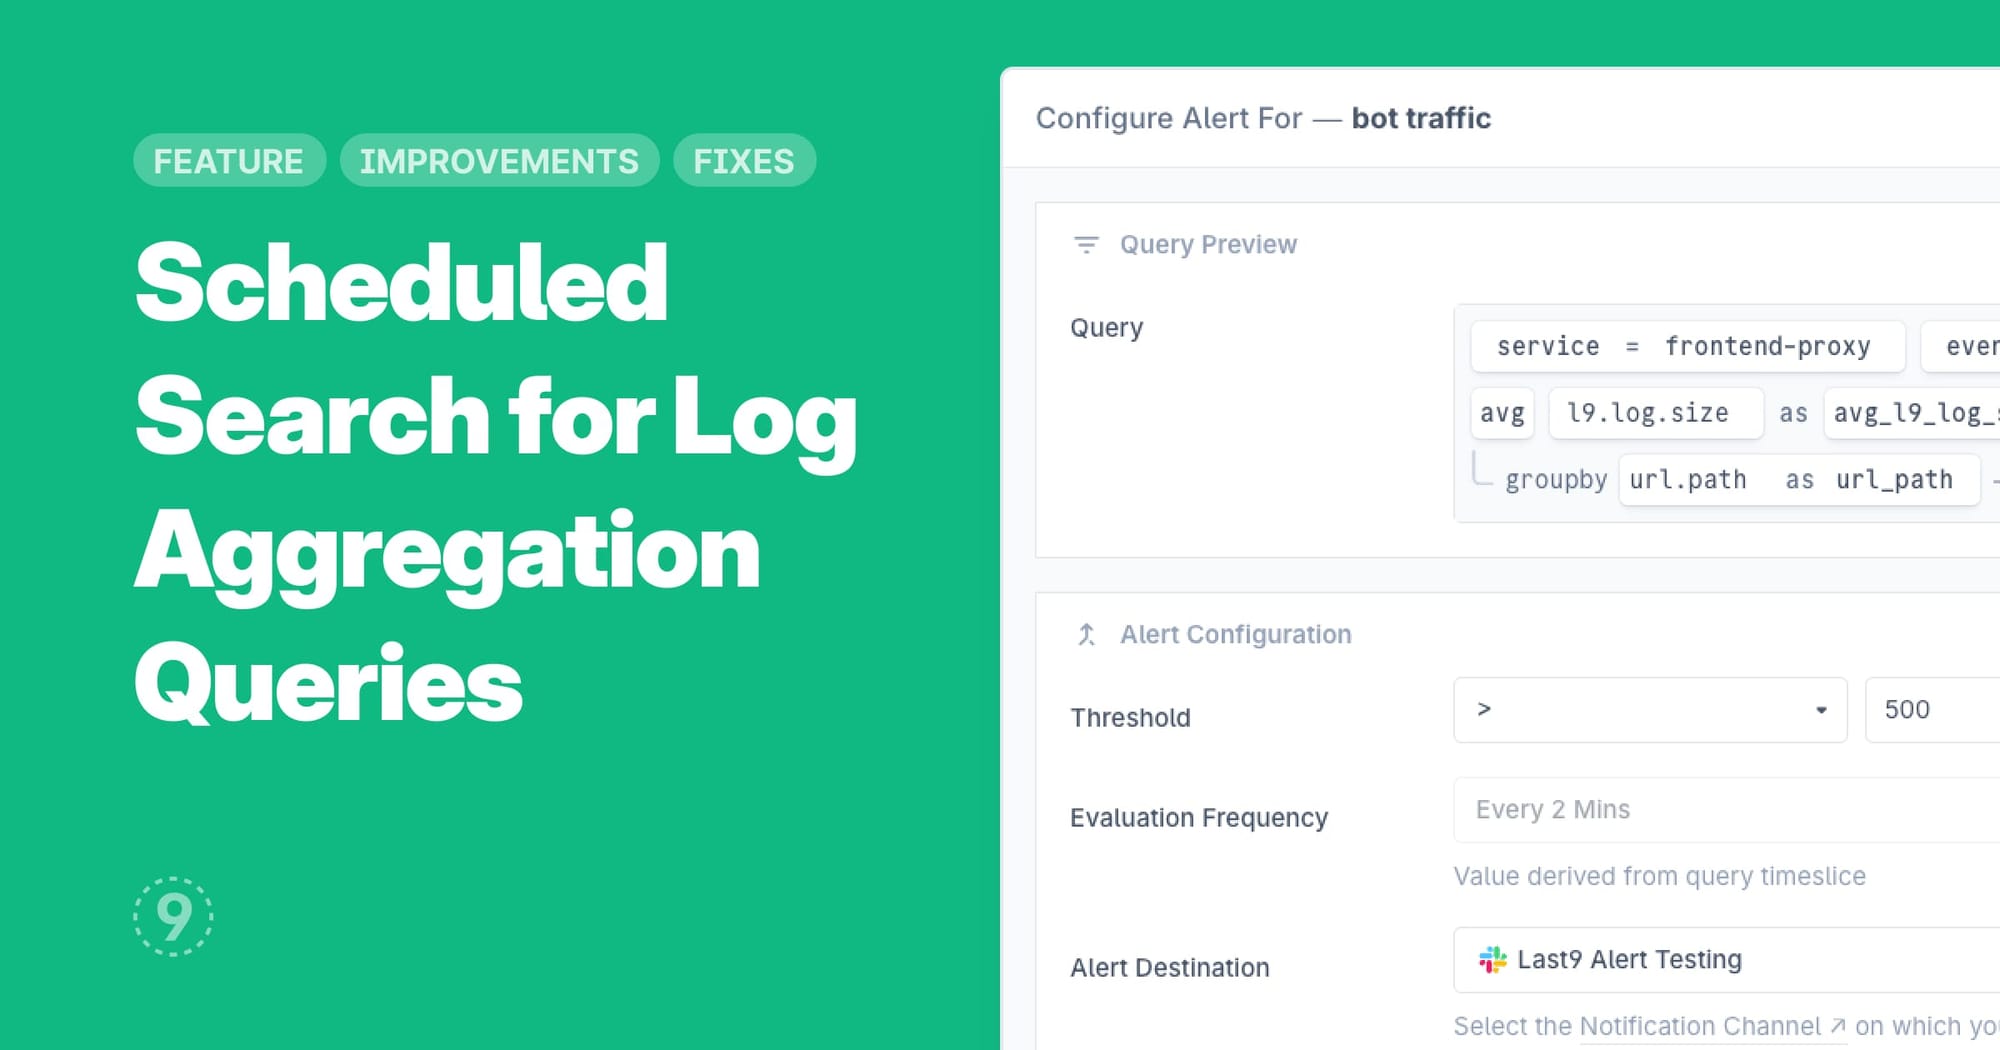
With this update to Scheduled Search, you can now set threshold-based alerts on aggregation queries, extending our log alerting capabilities beyond simple "found/not found" queries. This leverages ongoing improvements to our logs-to-metrics pipeline to bring advanced alerting capabilities to teams that primarily rely on logs.
Benefits for logs-focused teams:
- Metrics-style alerting without a metrics pipeline: monitor critical thresholds directly from your logs
- Unlock hidden insights in your existing log data without changing your instrumentation
- Simplify your observability stack by eliminating the need for separate metrics collection for basic alerting
- Reduce MTTR by correlating numerical patterns with detailed log context in a single platform
Example use cases:
- Track when HTTP 5xx errors exceed 5% of total requests using only your web server logs
- Alert when application response times in logs show p95 latency crossing 200ms
- Detect authentication anomalies by counting failed login patterns across distributed services
- Monitor infrastructure health using log-based resource utilization indicators
We’ve got some more updates to our logs-to-metrics pipeline lined. Meanwhile, read the docs for full setup details and best practices.
Improvements
- API Catalog:
- Selected tab in the details side panel is now persisted in the URL for easier sharing with teammates
- Improved availability chart display when error rate data is missing but throughput data is present, and 0% availability now aligned to bottom of chart instead of center
- Usage: Selected date view and telemetry type selections are now preserved in the URL for easier sharing
Fixes
- Related Metrics in Logs Explorer would not display for users with single cluster configurations