
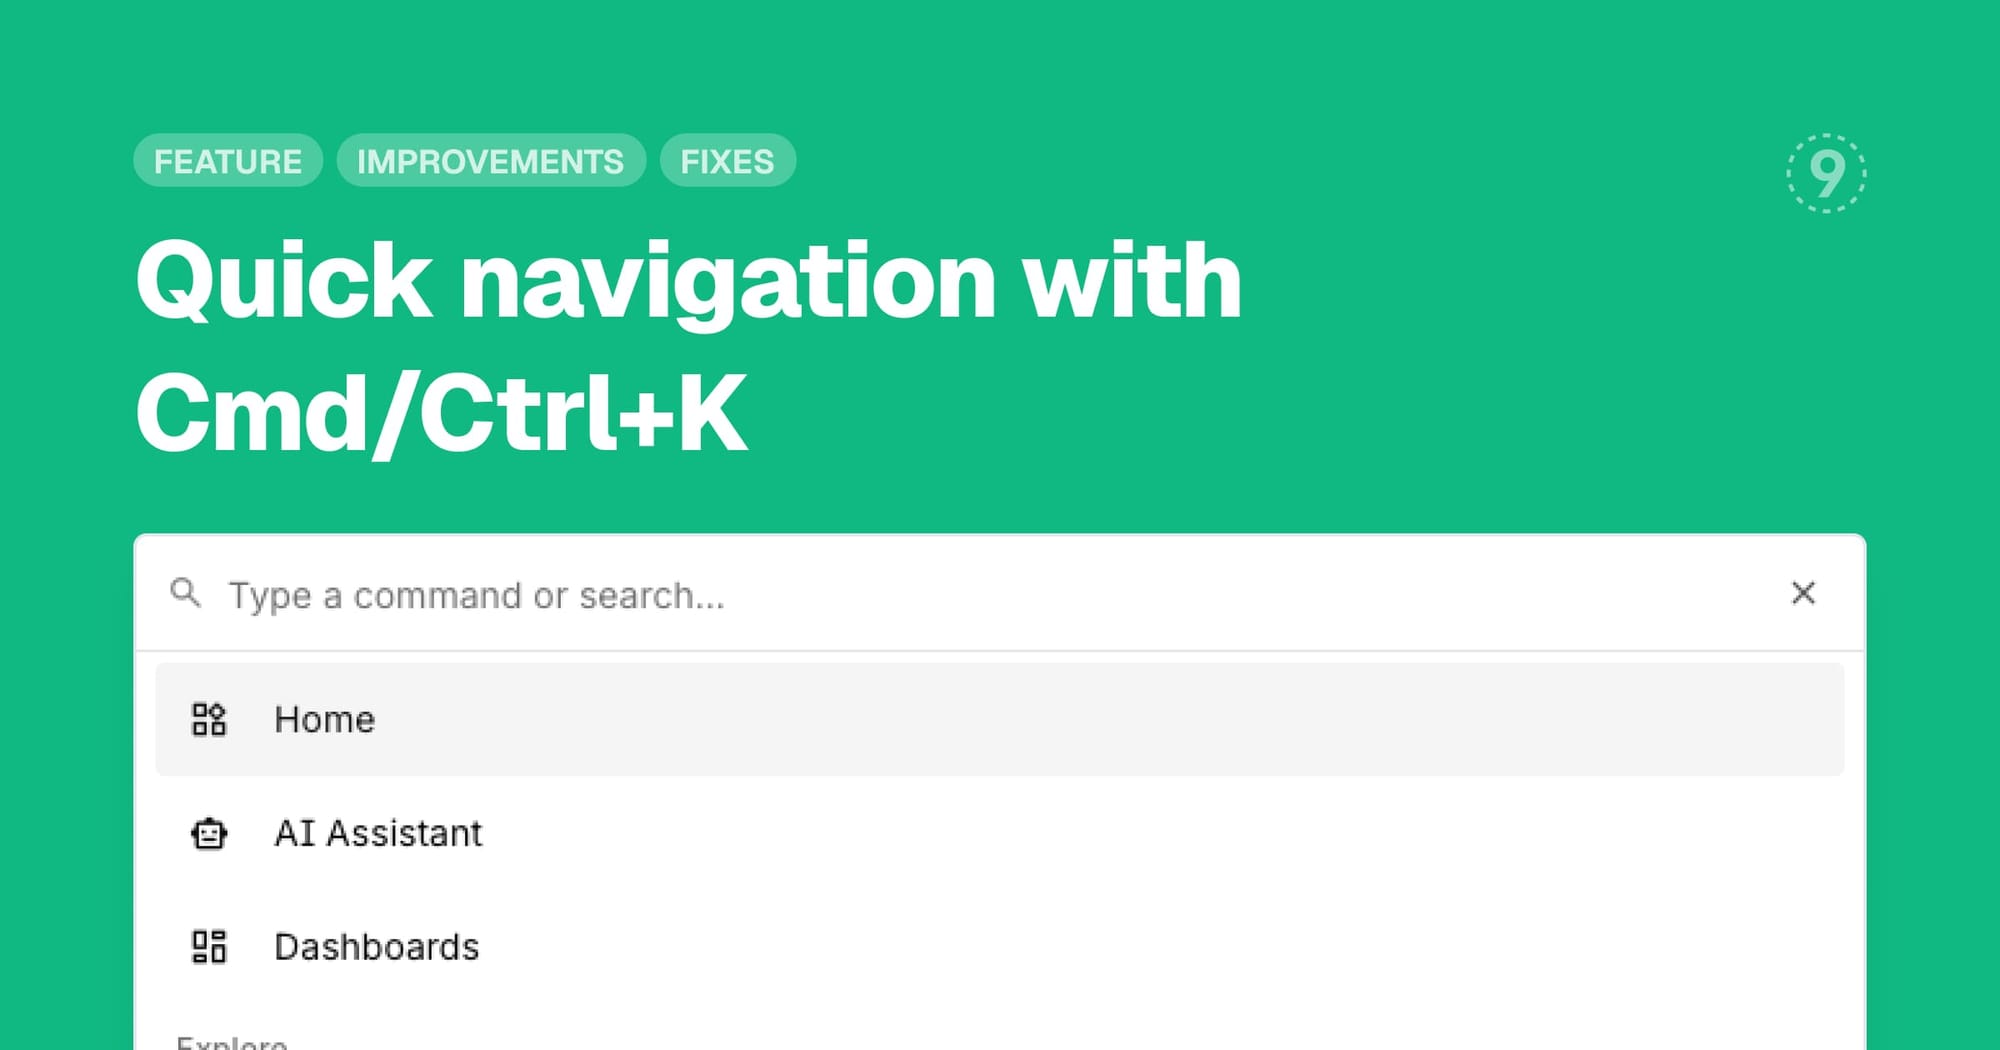
Navigate Last9 faster with our new keyboard-driven command palette. Press Cmd+K on Mac or Ctrl+K on Windows/Linux to open a quick search interface that lets you jump to any feature, page, or setting without clicking through menus.
Key benefits:
- Instant access to any feature or page with keyboard shortcuts
- Search across Control Plane and Settings routes
- Faster workflow for power users who prefer keyboard navigation
Improvements
- LLM Monitoring: Environment selector now available on the LLM monitoring page, with new filters for Model, Provider, and Service, plus improved session and conversation management for better analysis of your LLM usage
- Dashboards: Search dashboards by name and author, move panels between sections via drag-and-drop, reorder sections within dashboards, and duplicate entire dashboards or individual panels
- Discover Kubernetes: Health overview panel displays aggregated status counts (Healthy/Warning/Critical) across deployments, pods, and statefulsets with clickable status cards for filtering, CPU and memory utilization metrics with color-coded thresholds, and global search that filters resources by name, namespace, or cluster
- Browser SDK: Interaction tracking now captures comprehensive user interactions including clicks, scrolls, keyboard events, form inputs, and touch events with configurable options for each type, plus richer accessibility, label, and data attribute context on interaction targets following OpenTelemetry semantic conventions
- Logs Explorer: JSON log view now highlights filter search terms within nested JSON string values, making it easier to locate relevant log entries in formatted JSON displays
Fixes
- Scheduled Search inspect queries were not displaying properly in Query Builder when opening logs page via alert notification links
- Physical index parameter was not being passed to logs builder page when navigating from logs overview
- Service filters were not enforcing case-sensitive matching consistently
- Logs table body column was not resizable with proper size constraints
- Attributes chip filters in logs results table were getting cropped at table edges
- Logs view controller header was overflowing on smaller viewports
- Duplicate attribute options were appearing in remapping extract modal dropdown
- gRPC status codes were not included in trace-to-metrics conversion