
Context switching between dashboards, logs, and traces creates friction in your troubleshooting workflow. When spotting an anomaly in a dashboard, you often need to manually construct queries to find relevant logs and traces.
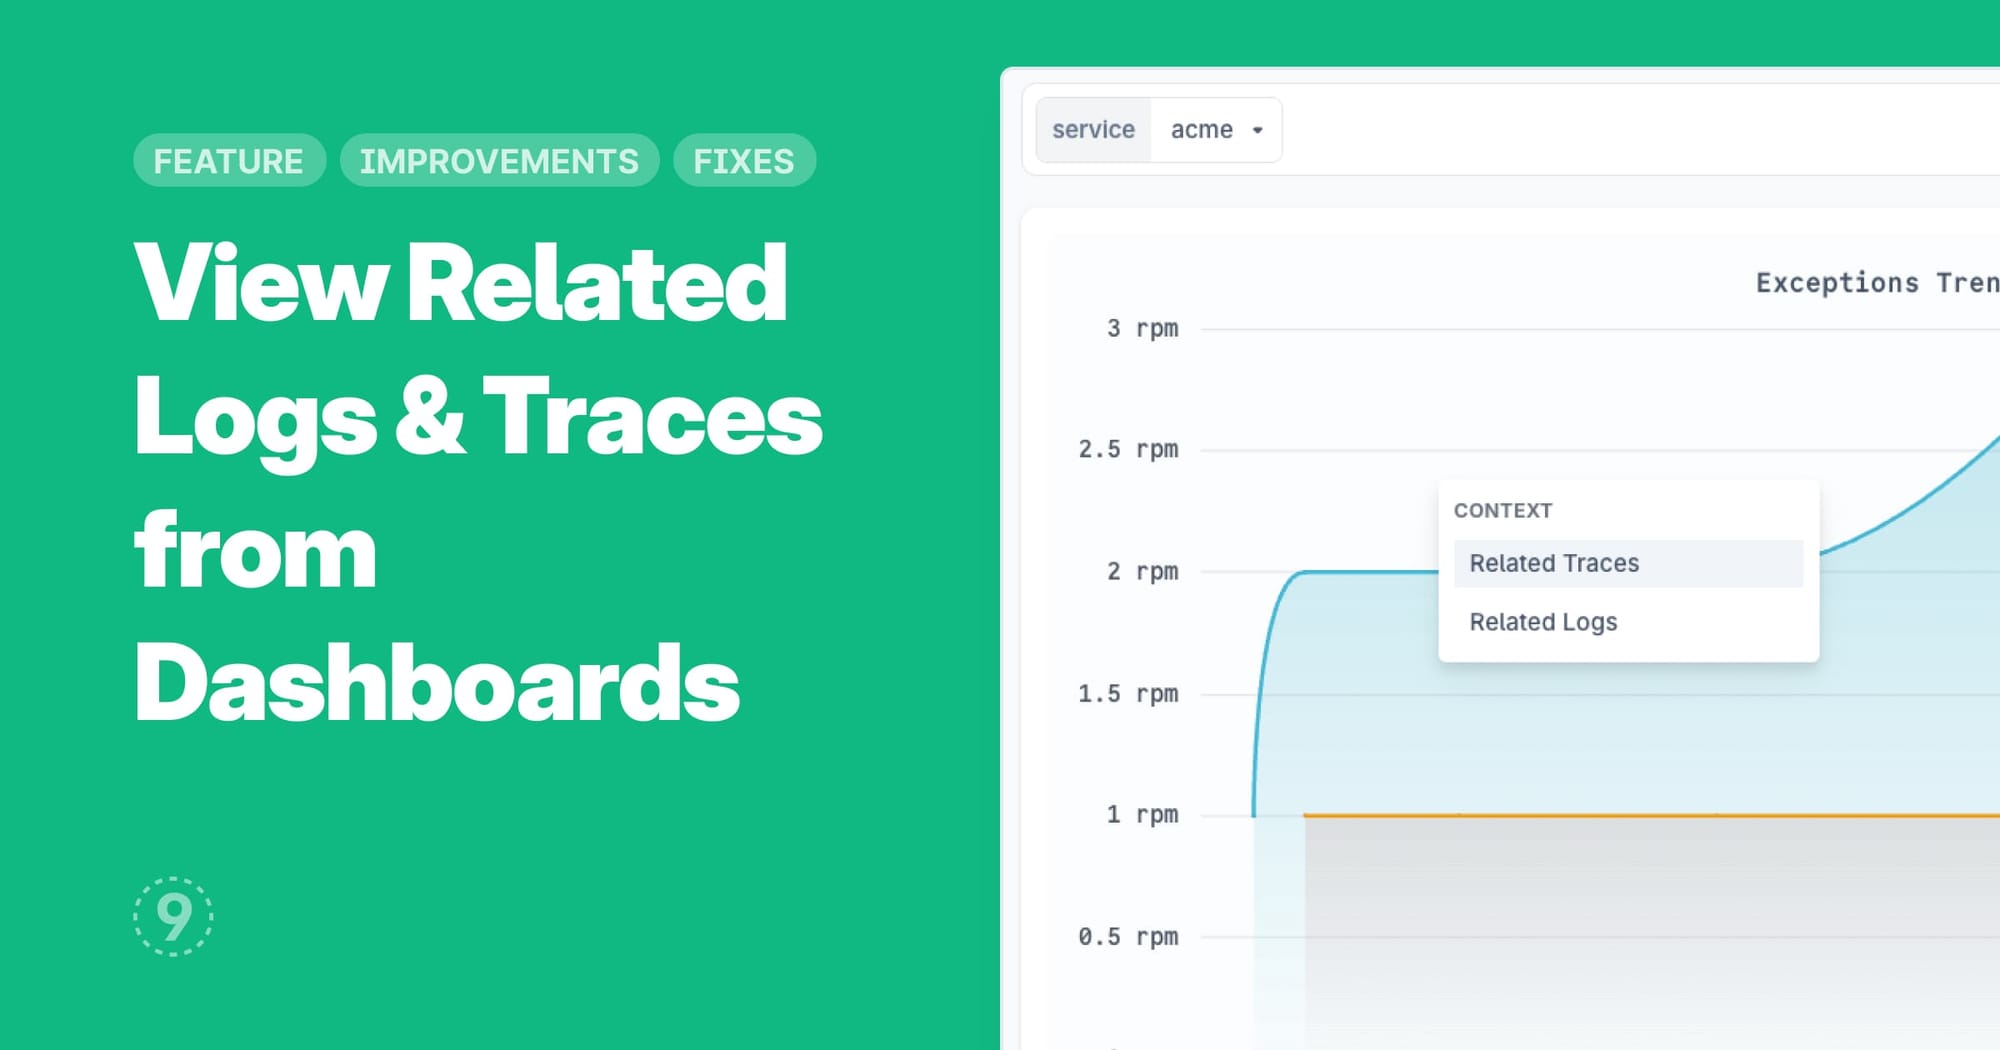
You can now view related logs and traces directly from any panel in your dashboard by clicking on the panel. This feature requires a service variable to be defined in the dashboard, creating a seamless path from metrics visualization to detailed diagnostic data.
Improvements
- Logs Explorer: Your preferences for “show volume chart,” “show filters,” and “wrap lines” in the logs explorer are now locally saved, providing a more consistent user experience
Fixes
- Dashboards:
- Panels would remain in loading state even when no variable value was selected
- Duplicate calls while loading variables and charts impacted performance
- Control Plane: Health dashboard in embedded grafana when opened via control plane would show undefined as the data source