
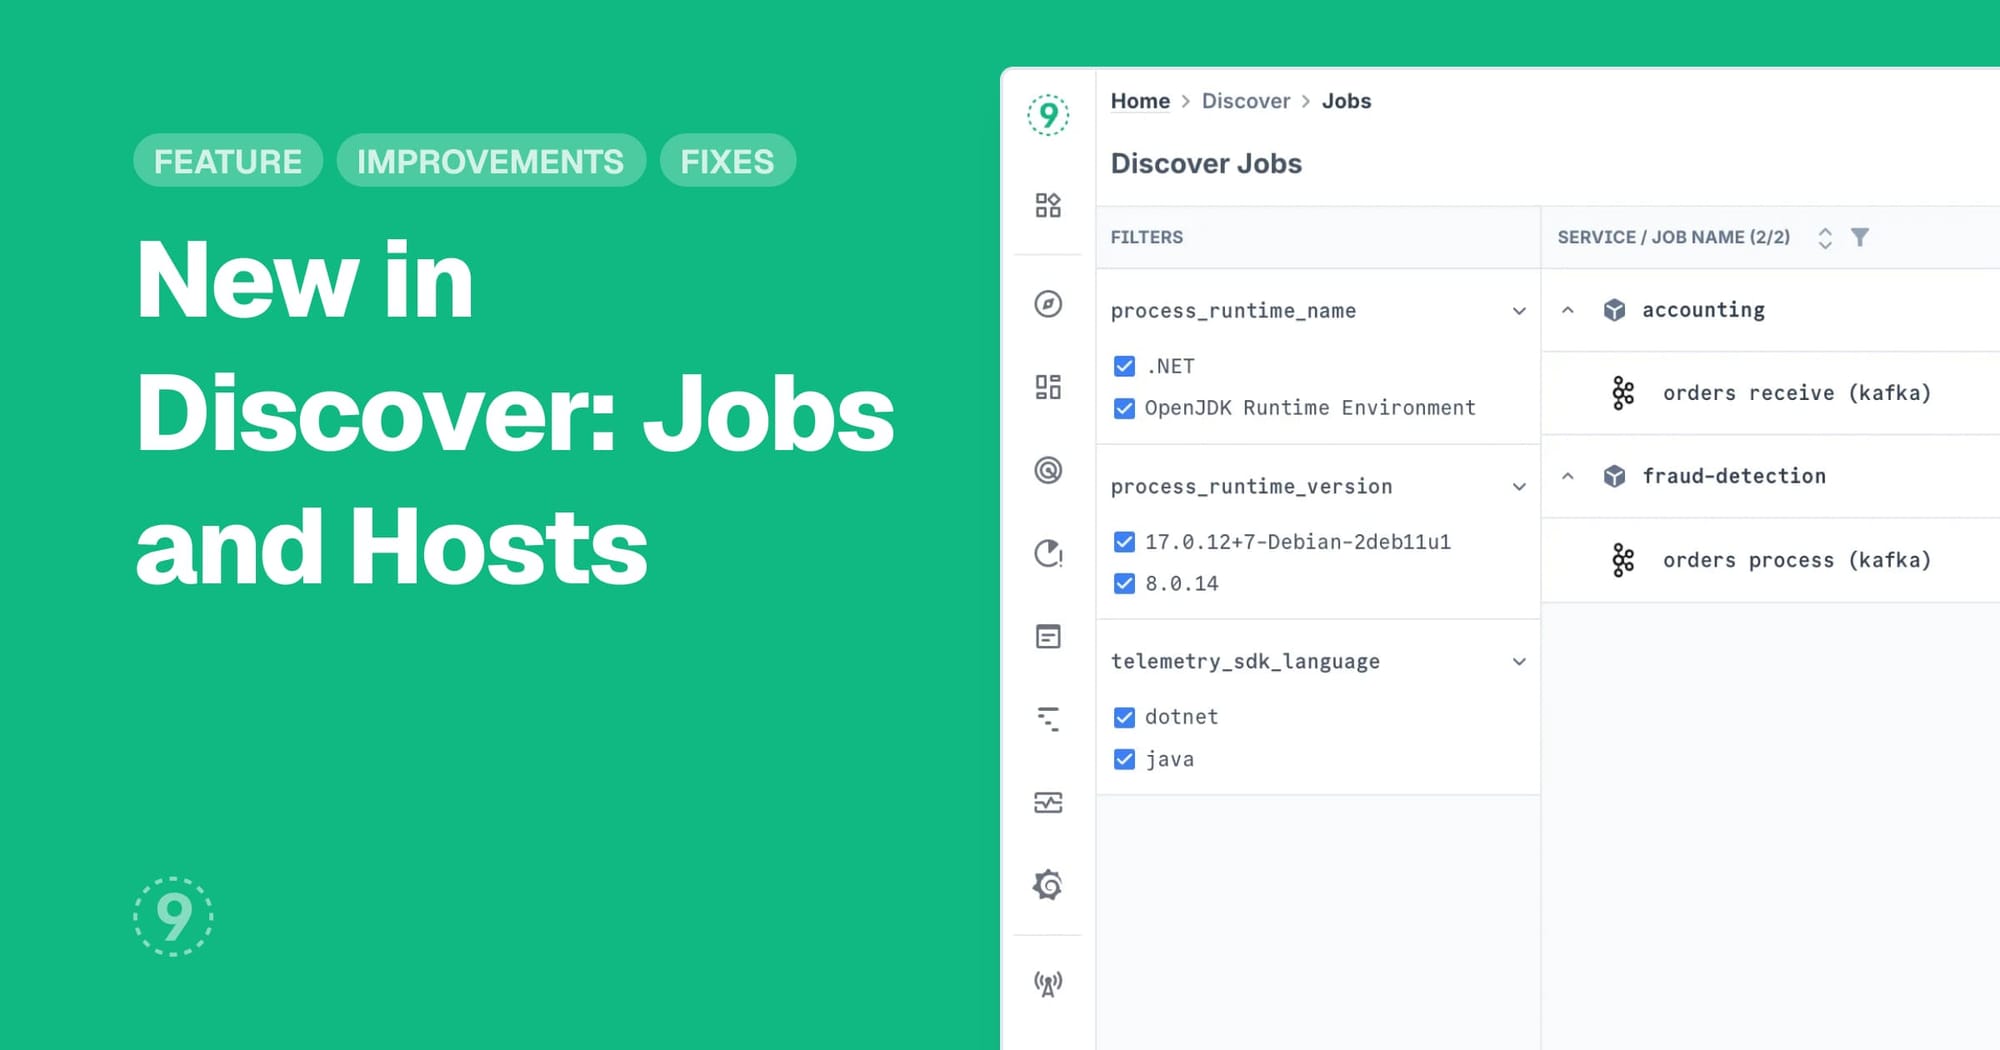
Discover Jobs
Monitor background jobs across your infrastructure with comprehensive performance insights. View job execution patterns, identify bottlenecks, and track error rates to ensure your background processes run smoothly.
- Complete job performance metrics including throughput, error rates, and duration
- Service-based job organization with full job name visibility
- Detailed job breakdowns with operation-level performance analysis
- Exception tracking with error trend visualization and filtering
- Messaging system integration in job names for better identification
For more, read our docs.
Discover Hosts
Get complete visibility into your host infrastructure with detailed performance monitoring. Track resource utilization across CPU, memory, storage, and network to optimize your infrastructure.
- Host-level performance metrics with CPU, memory, and storage utilization
- Network bandwidth monitoring with detailed I/O statistics
- Individual host drill-down with comprehensive resource charts
- Real-time host status tracking with uptime information
- Root Volume (Used/Allocated) card renamed from Disk (Used/Allocated) for clarity
Improvements
- Discover Services:
- Service operations zoom functionality added to All Operations, Database, and Outgoing Calls charts for detailed time range analysis
- Exception tracking improvements with operation type columns and error trend analysis
- Discover Kubernetes:
- Stateful sets support in Kubernetes monitoring with dedicated detail pages
- Dashboards:
- Query type support for LogJSON, PromQL, and LogQL in dashboards with zoom capabilities
- Sections support for better organization and panel management
- Dashboard query names now support horizontal scrolling for better visibility
Fixes
- Discover Services:
- Wrong caller distribution issue in service operations was not displaying accurate metrics
- Exception navigation from Discover Services to trace view was not working properly
- Service operation query corrections for error rate calculations were showing incorrect values
- Discover Kubernetes:
- Memory usage percentage calculations in Kubernetes pod monitoring were displaying inaccurate data
- Dashboards:
- Data display issue when same query shows data in Grafana but not in Last9 was resolved