
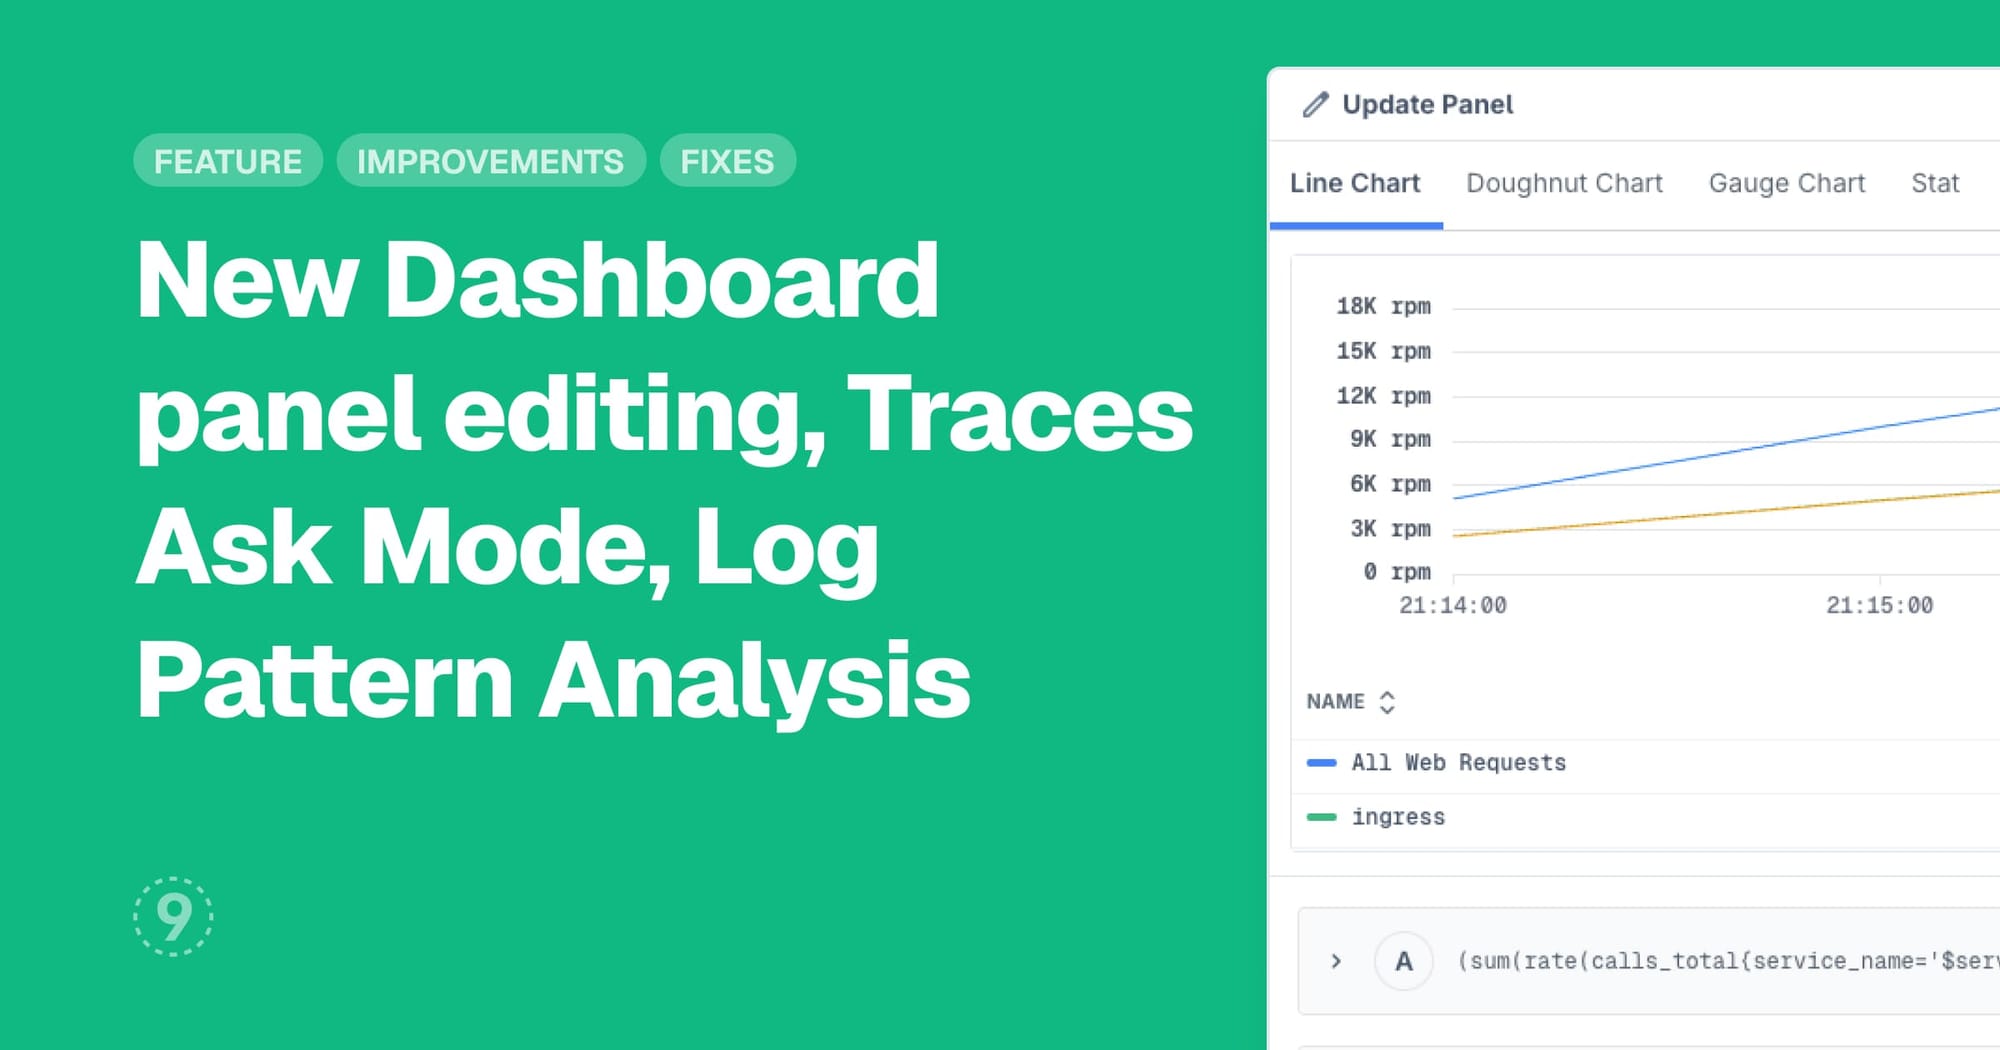
Redesigned Dashboard Panel Editor
We've rebuilt the panel editor to make creating and configuring dashboard visualizations more intuitive and efficient. The new design organizes settings into clear sections with improved navigation.
- Organized layout with tabs and collapsible sections for easier navigation
- Auto-generated panel names based on your query names
- Duplicate queries to speed up panel creation
- Unsaved changes protection prevents accidental data loss
- Independent preview time range for testing without affecting your dashboard
Traces Explorer Enhancements
Traces Explorer now includes natural language querying and a comprehensive overview to help you start investigations faster.
Ask Mode lets you describe what you're looking for in plain language, and Last9 generates the appropriate query. Your natural language queries are saved in the Query Library alongside your manual queries for easy reuse.
Overview provides a starting point for trace investigations with quick start templates, recent queries, key metrics like total traces and active services, volume charts, and top services by trace count.
Log Pattern Analysis
Last9 now automatically detects recurring patterns in your logs. When you run a logs query, patterns are identified and displayed in a visualization panel showing frequency, severity, service metadata, and example logs.
- Sort patterns by frequency or recency
- View statistics including log count and percentage
- See which services and severity levels are associated with each pattern
- Currently available in limited alpha rollout
Improvements
- Discover Hosts: Add filters sidebar to filter hosts by type (Kubernetes Nodes, Cloud VMs), and clusters, when available
- Discover Applications:
- Browser SDK network tracking can now be configured with enable/disable toggle, URL ignore patterns for full URL/pathname/hostname, and localhost hosts ignored by default
- Browser SDK now sends errors and custom events as both logs and traces for improved observability, with logs dynamically configured from provider settings
- Control Plane > Scheduled Search: Evaluation now supports 1-minute frequency for more frequent automated query execution
- Control Plane > Remapping: Pattern extraction in log remapping rules no longer includes automatic JSON detection checks, giving you full control over when pattern extraction applies
- Settings: Admins can now mark users as deactivated
Fixes
- Logs Explorer: Related Traces page in was crashing when trace details returned null
- Traces Explorer: Spans in timeline view were overlapping
- Dashboards: Related Logs/Traces via Context Menu were showing up blank when clicking on datapoints in panels with
groupbyattribute transformations