We are releasing the health dashboard for all Levitate clusters. The health dashboard will help in understanding the performance and state of each Levitate luster. It will give you a complete picture of the Levitate cluster performing in real-time.
Consider it same as status page for each Levitate cluster, but one that you can customize, set alerts on and can take full advantage of!
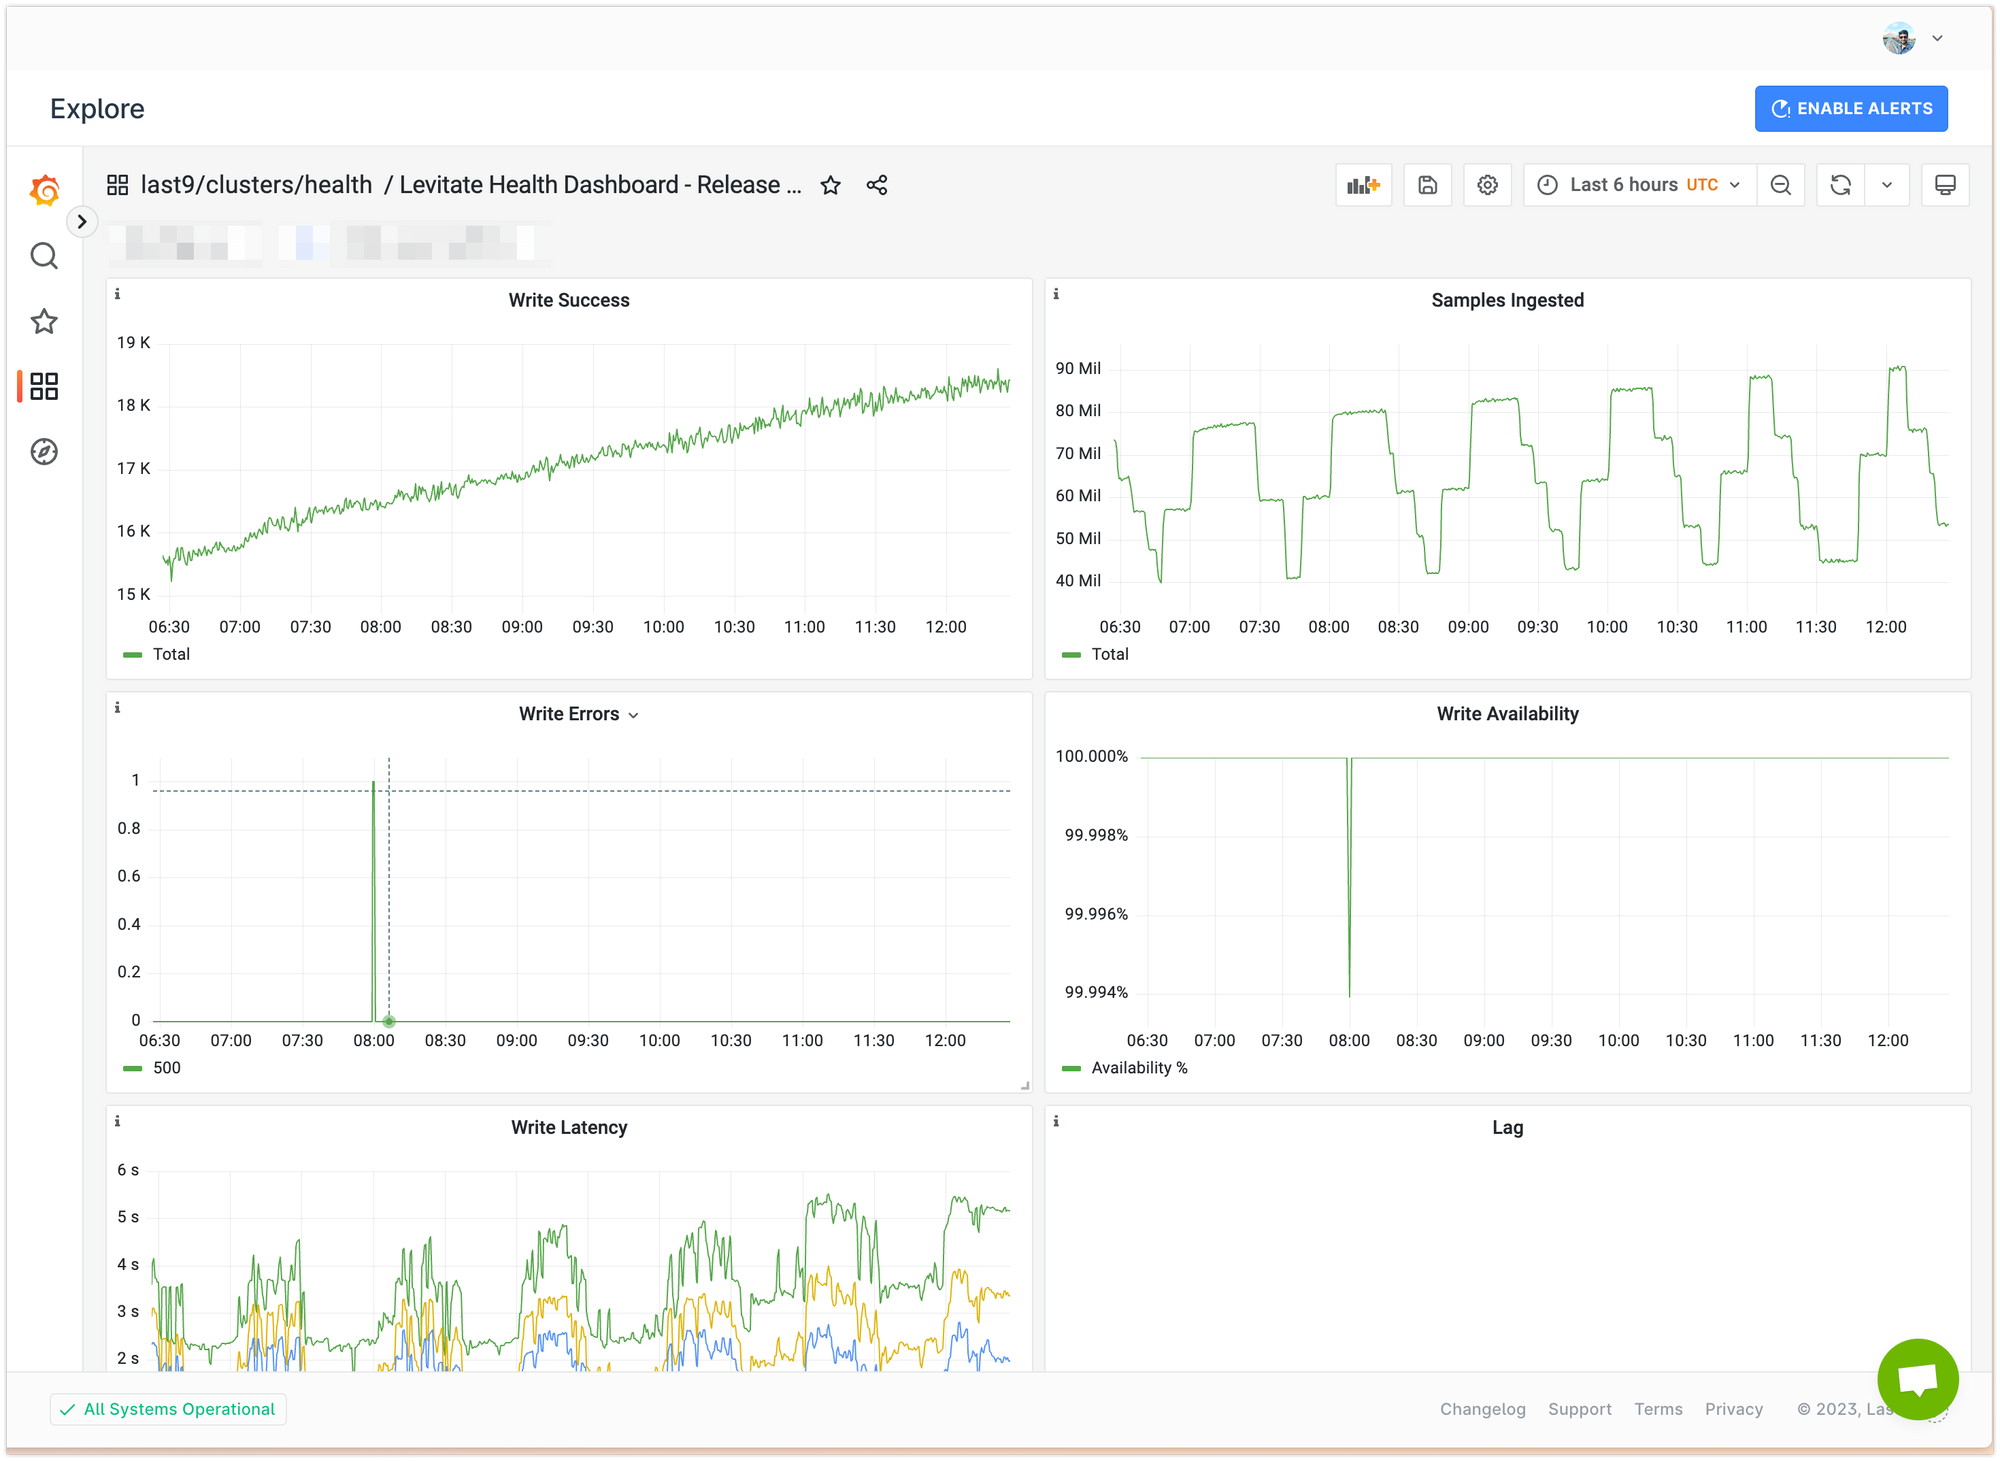
The health dashboard contains information such as
- How many write requests are succeeding?
- Rate of sample ingestion
- Read and Write availability
- Ingestion lag and latency
- Cardinality limits
- …and many more failure modes.
The complete list can be found here.
| Metric | Panel Name | Aggregation | Panel Type | Comments |
|---|---|---|---|---|
| Write Success | Write | sum | Time Series | |
| Ingestion TPS | Samples Ingested | max | Time Series | |
| Write Errors | Write | sum | Time Series | |
| Write Availability | Write Availability | sum | Time Series | % of write requests that failed |
| Write Latency | Write Latency | 0th → 10th Decile | Histogram | |
| Ingestion Lag | Lag | avg | Time Series | |
| Read Success | Read | sum | Time Series | |
| Read Errors | Read | sum | Time Series | |
| Read Latency | Read Latency | 0th → 10th Decile | Histogram | |
| Cardinality Limited Metrics | High Cardinality | metric cardinality > 1M | Time Series | |
| Cardinality Limiter early warning | High Cardinality | suspicious metric cardinality > 60M | Time Series | Metrics that might hit the cardinality limit |
| Ingest Errors | Bytes dropped | sum | Time Series | Samples permanently failed to ingest |
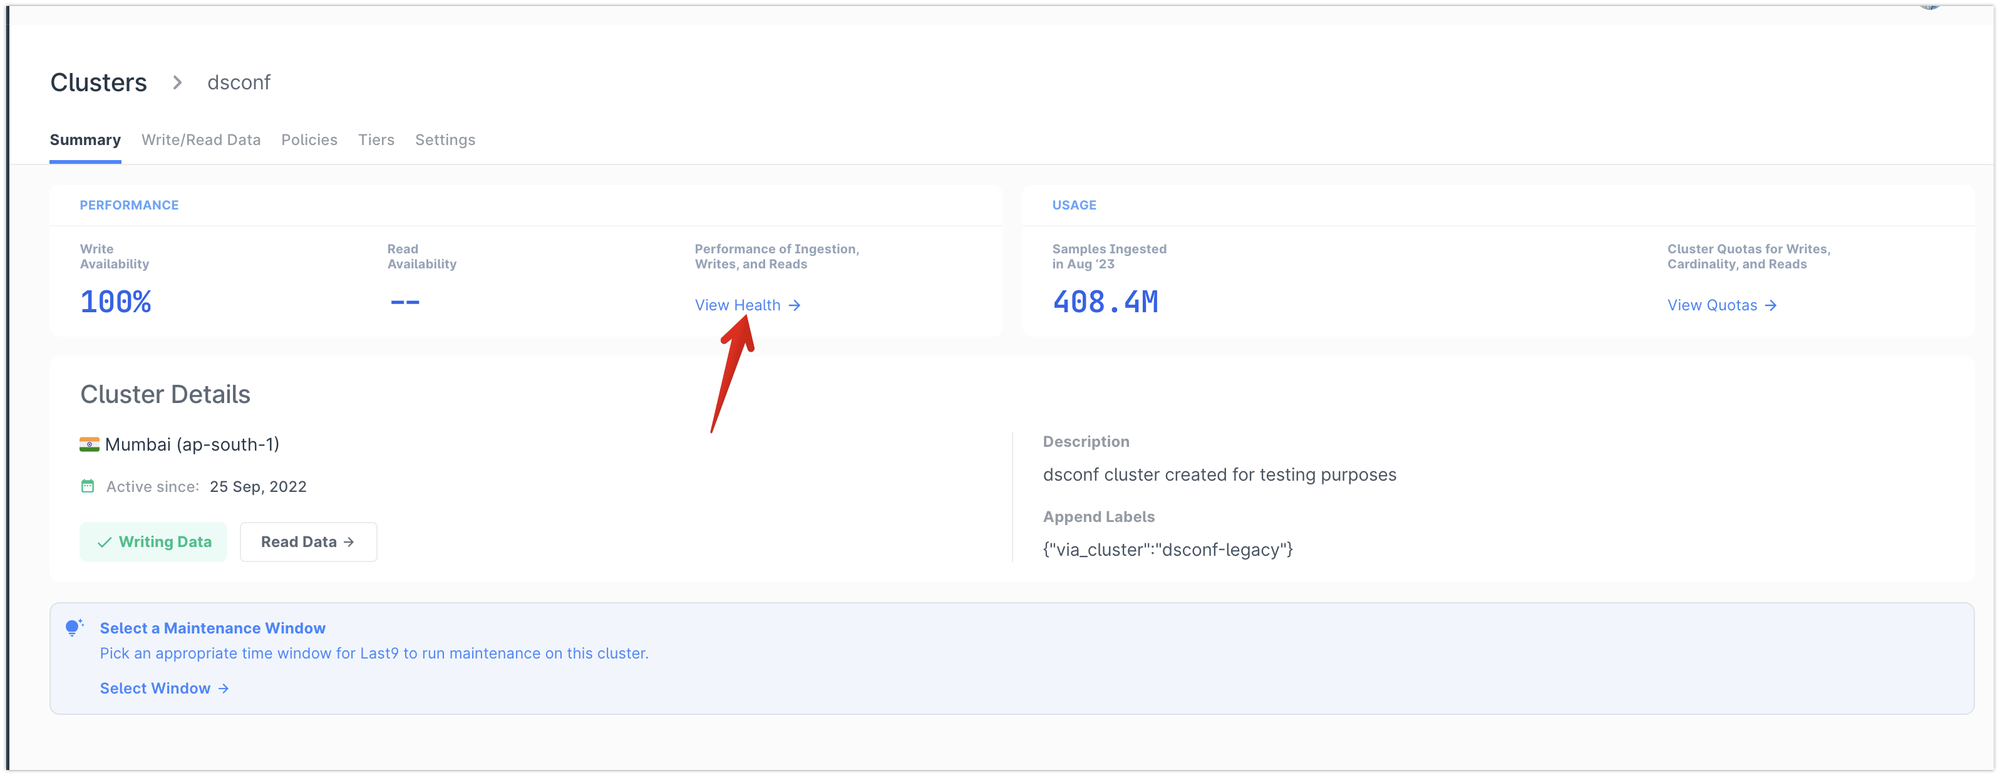
Levitate health dashboard is available for all Levitate clusters in the Embedded Grafana automatically; click on View Health.