
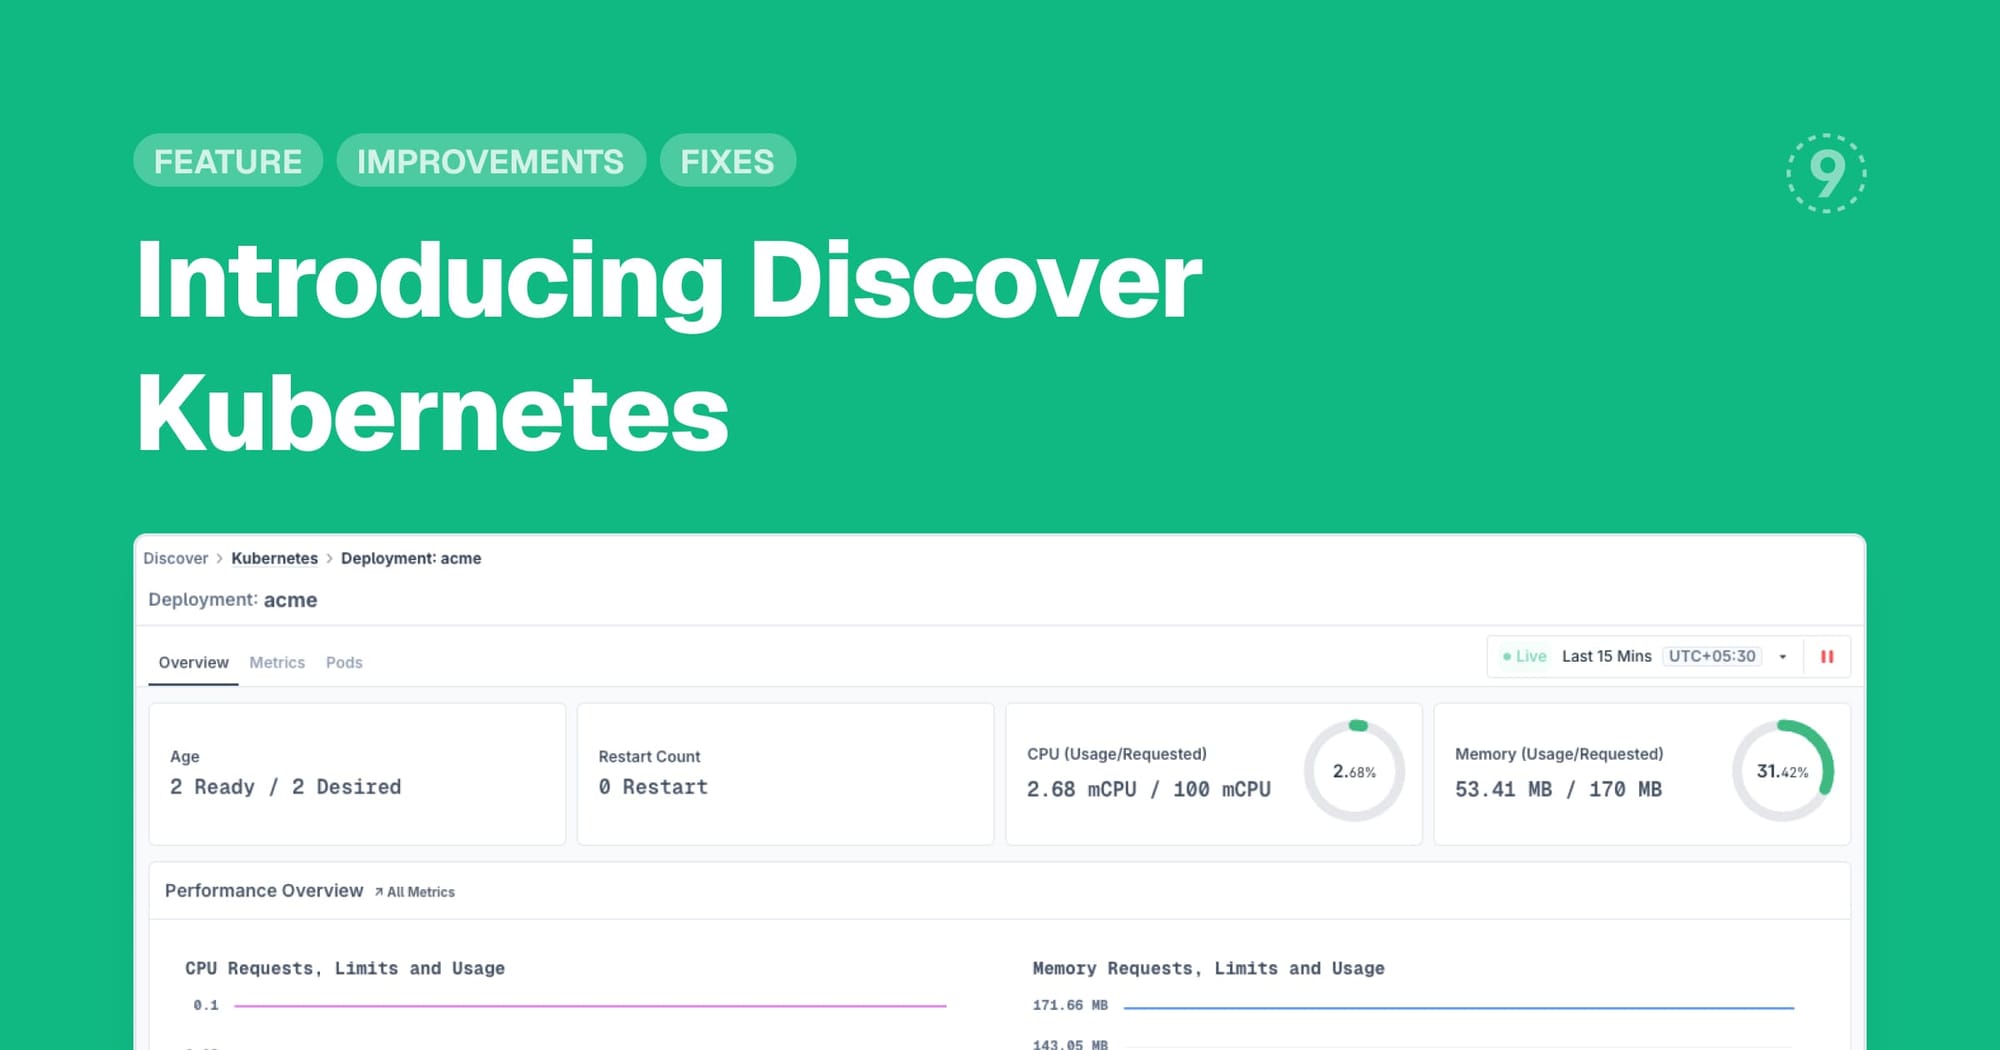
Our new Kubernetes discovery dashboard brings full visibility into your containerized infrastructure. Navigate through your clusters, deployments, and pods with detailed performance metrics and resource utilization tracking.
- Complete deployment and pod overview with status monitoring
- Real-time CPU and memory usage tracking with visual indicators
- Drill-down capabilities from cluster level to individual pod metrics
- Resource request and limit analysis for capacity planning
- Pod termination and restart tracking for reliability insights
Learn more about Discover Kubernetes.
Improvements
- Discover Services:
- Services catalog page loads significantly faster with optimized throughput metrics and fewer API calls
- Performance panel charts now use enhanced queries for more accurate service and operation data
- Physical index dropdown added to service logs tab for precise log filtering
- Alerting:
- Webhook channel now automatically detect Google Chat URLs and format incident alert payloads appropriately
Fixes
- Discover Services:
- Top 10 Operations were not loading properly when navigating from operation overview
- Services View response time data was not applying environment filtering correctly and now uses dedicated p95 metrics