
Teams often prefer different visualization environments, with some favoring embedded Grafana while others work primarily in native Last9 Dashboards. This inconsistency makes it difficult to establish standardized workflows across your organization.
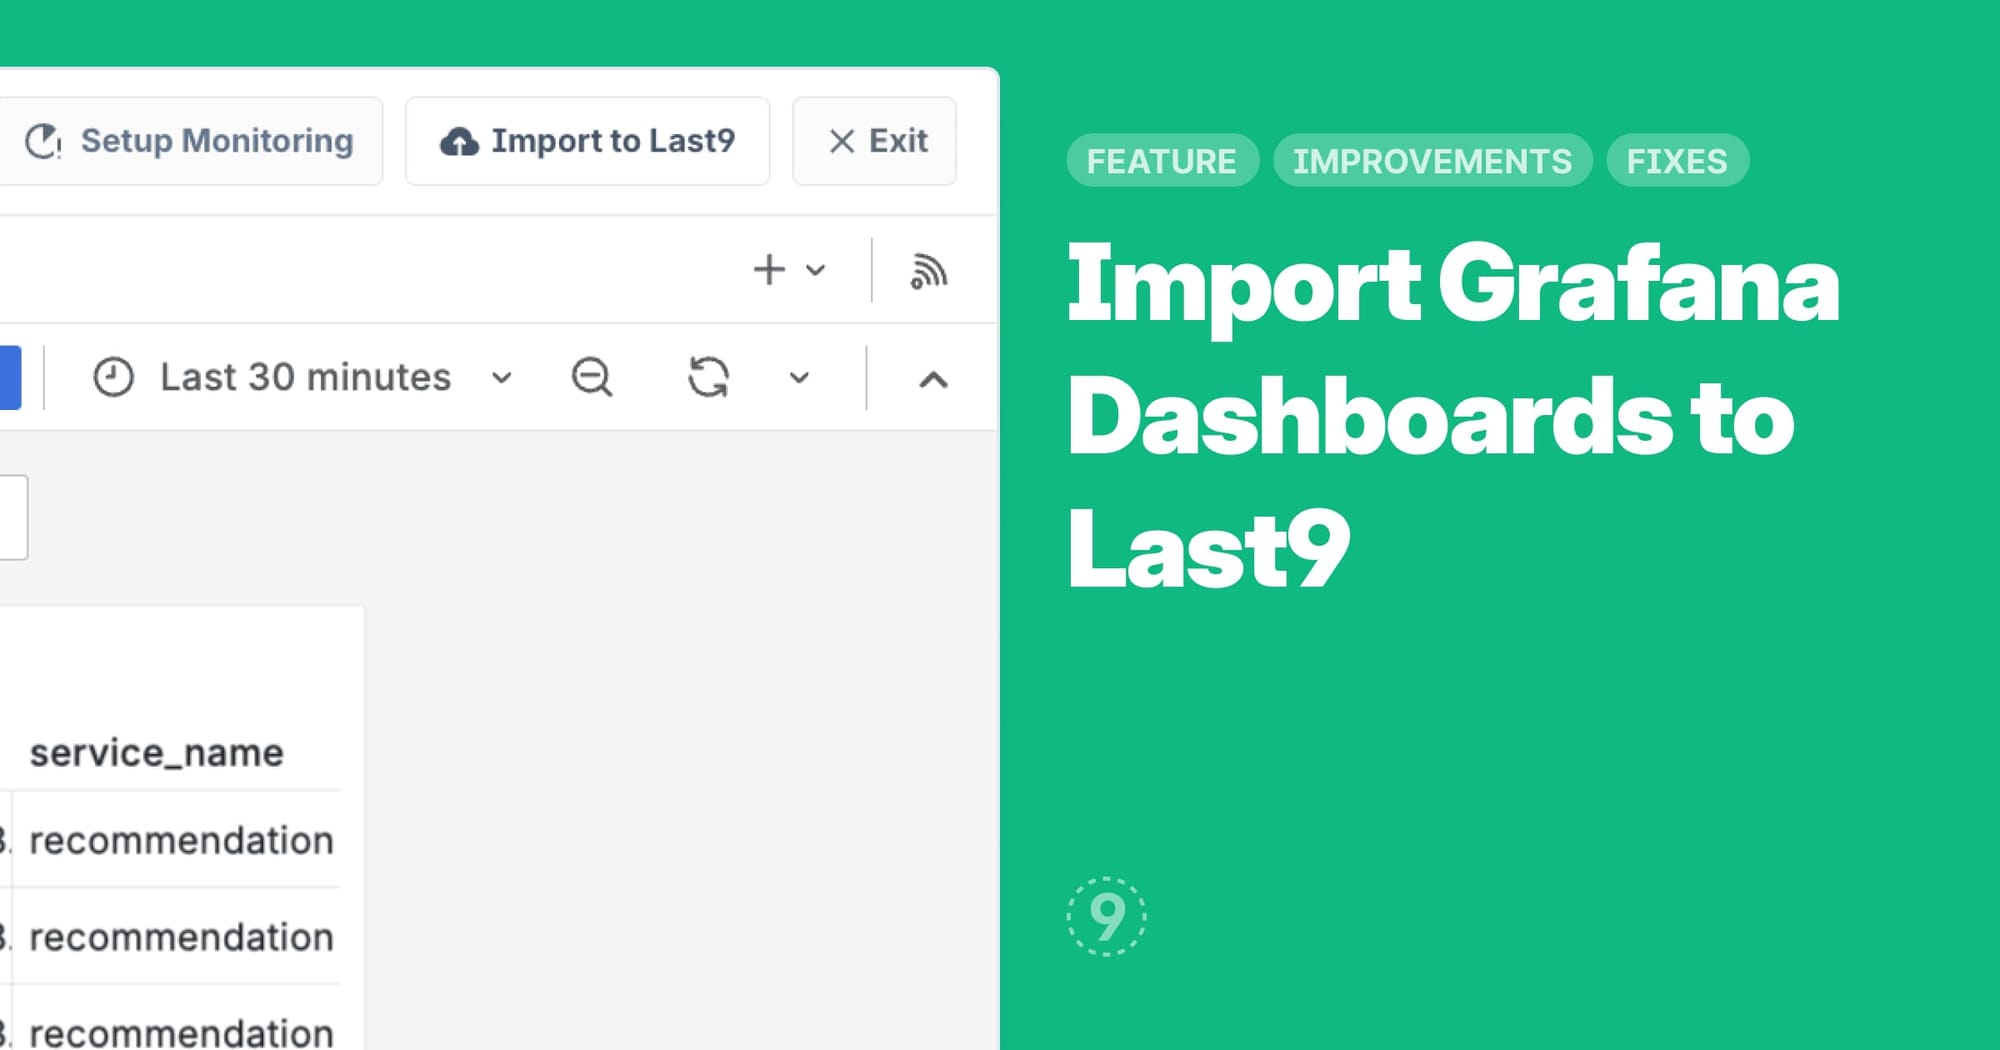
You can now import dashboards directly from embedded Grafana into Last9 dashboards. This provides a consistent monitoring experience for all teams, regardless of their dashboard preference. Additionally, this integration sets the foundation for the upcoming ability to view related logs and traces directly from dashboard panels in our next release — a capability that's cumbersome to achieve in Grafana alone.
Improvements
- Added support for Drop rules for logs going to non-default physical indexes
- Related Logs filtering tabs now only appear when the corresponding filter attribute is present in logs, creating a cleaner interface
Fixes
- Dashboards:
- All panels in Dashboards reload when any panel is resized or repositioned
- Selected legend in panel gets deselected when user zooms into the panel's chart
- Sensitive Data: PII redaction templates for a data type was matching non-data type information as well