
This release of Last9 is all about close collaboration with other Observability tools and workflows you already use in day-to-day work. We bring support for Embedded Grafana within the Last9 Dashboard and first-class support for InfluxDB integration with Last9. Let’s dive in.
📉 Embedded Grafana
A brand new Explore the tab is added in Last9, where you will find — guess what — an embedded Grafana Dashboard where you can create Dashboards on top of your Last9 Clusters.
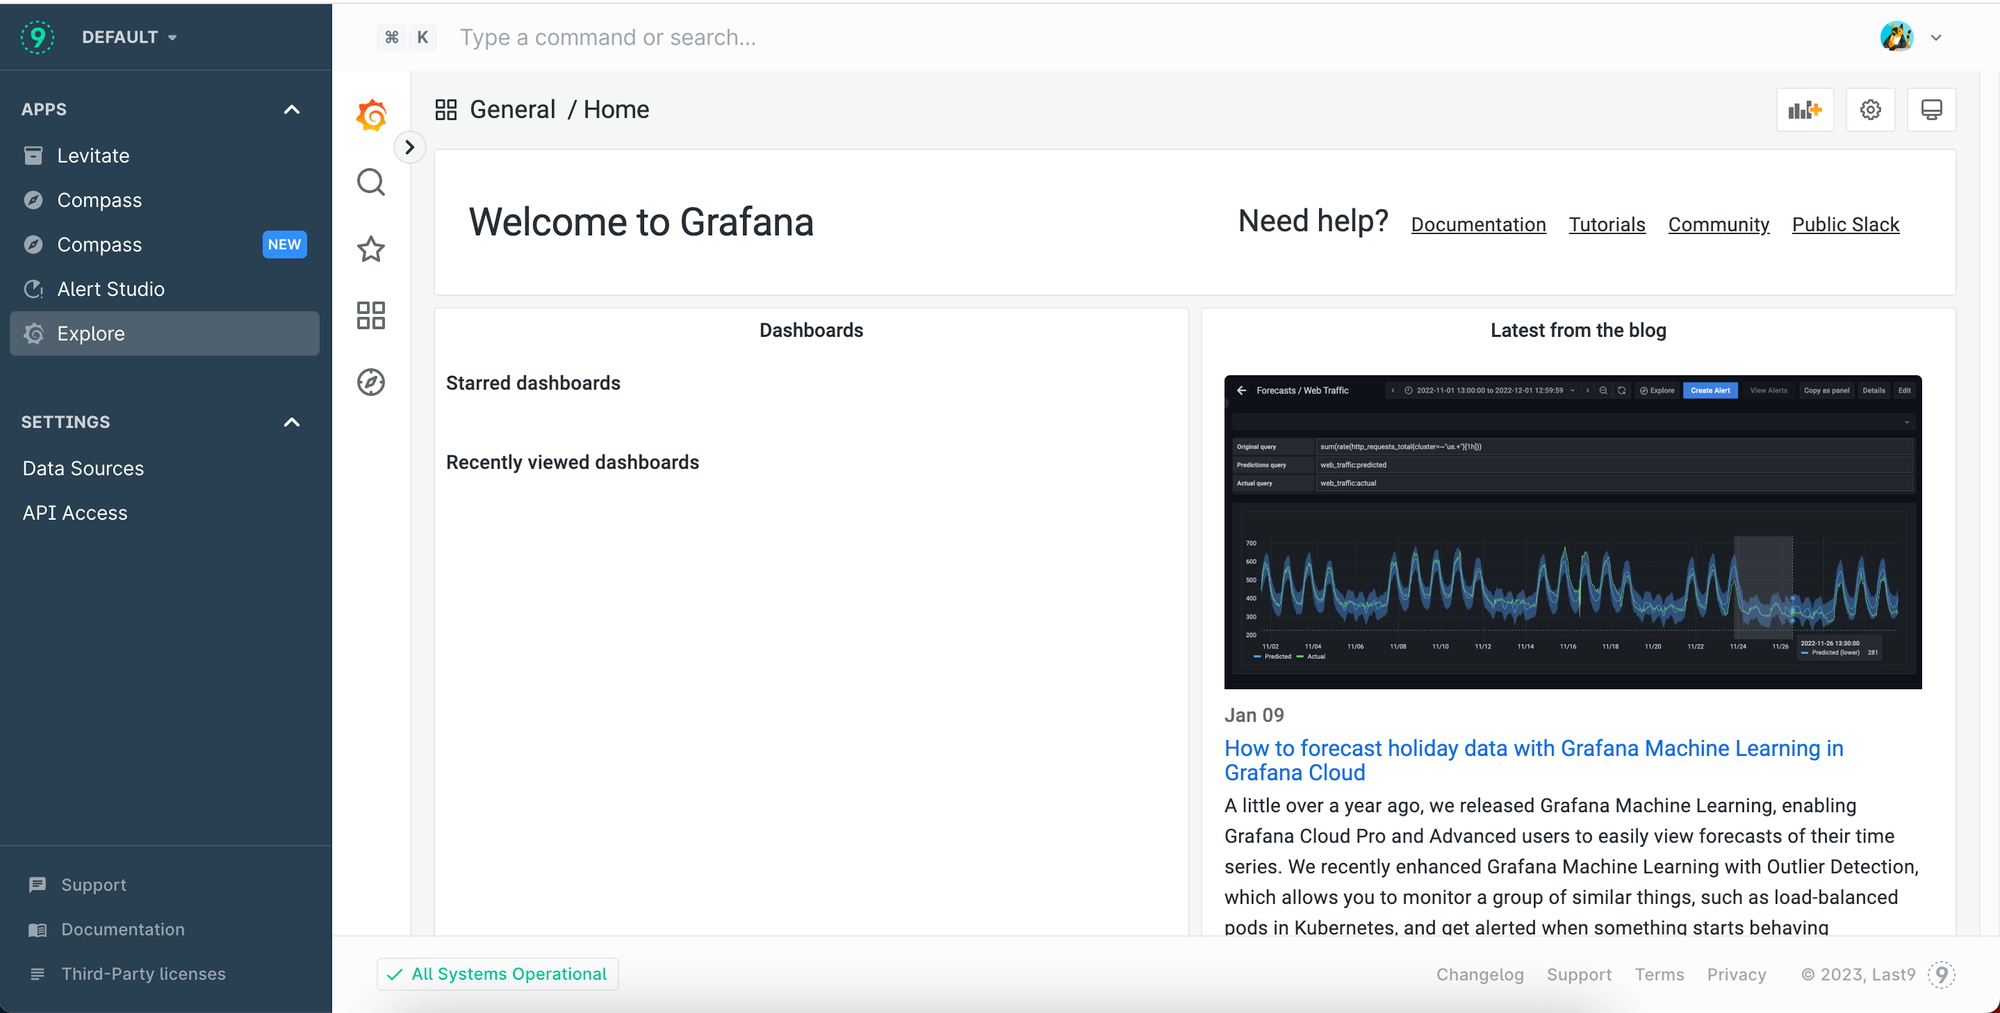
👷🏻♀️What’s possible and what’s not?
- Explore your metrics with built-in grafana
- Works out of the box with your Last9 clusters
- Create observability dashboards and panels using PromQL
- Alerting and SLOs on top of grafana dashboards are coming soon
🐯 InfluxDB <> Last9
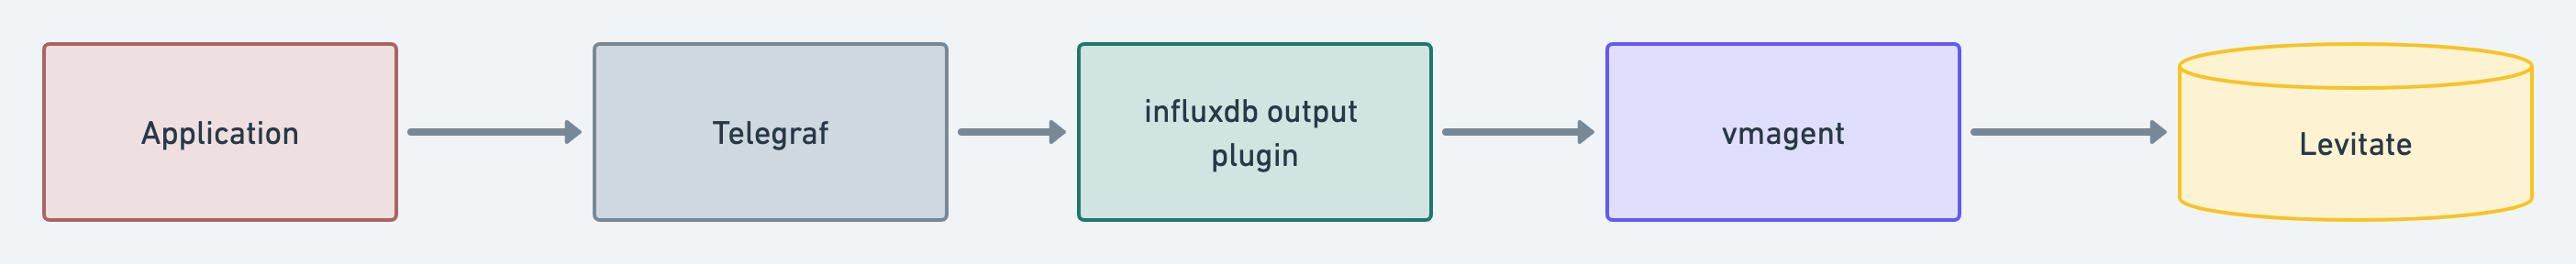
Integration support for getting data from InfluxDB into Last9 using a push-based approach via vmagent. Forget the hassle of pull-based models.
The flow is as follows:
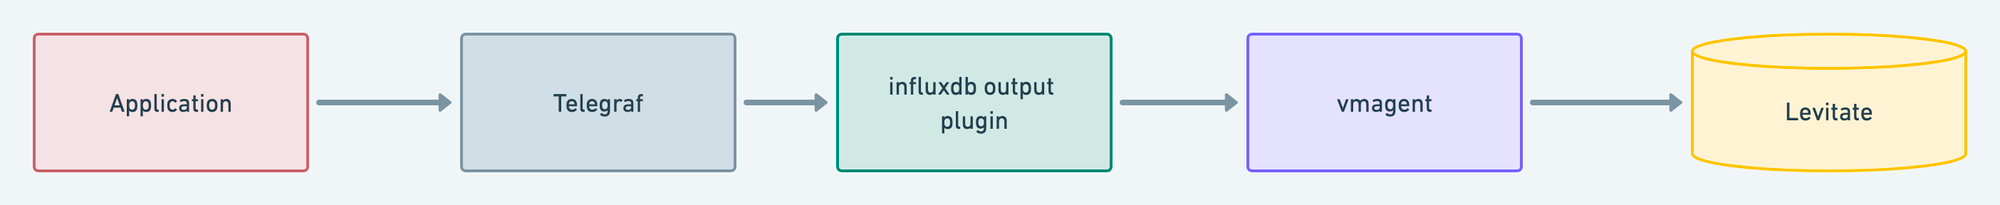
Detailed integration documentation, alternatives, and working code samples are below.

This approach supports dual writes in case someone wants to write to Prometheus and InfluxDB.