
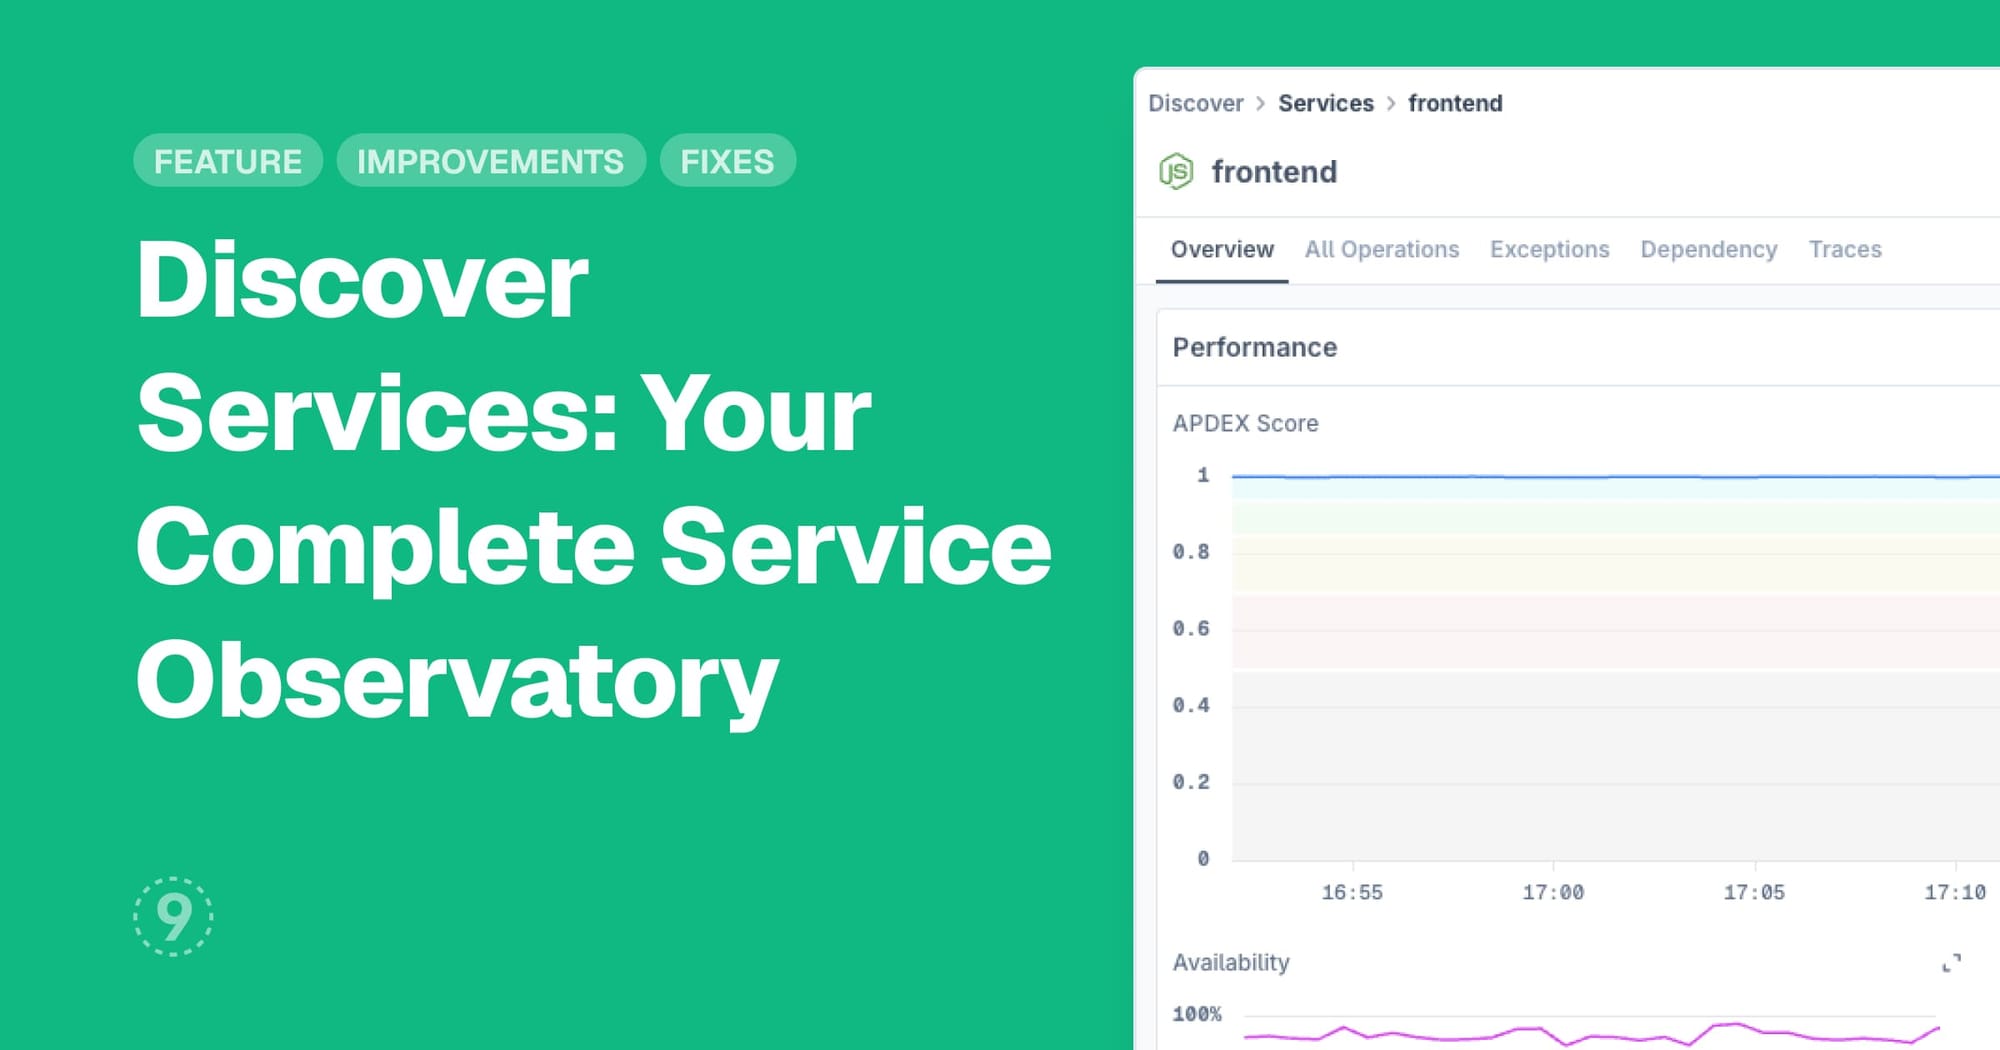
We've transformed how you explore and monitor your services with the introduction of Discover Services. This new interface replaces our previous API-focused catalog with a complete service-centric view that gives you comprehensive visibility into every service in your infrastructure.
- Complete service inventory with real-time health metrics including throughput, error rates, availability, and response times
- Detailed service pages with performance charts, operation breakdowns, error analysis, and dependency mapping
- Streamlined navigation between service overview, operations analysis, exceptions tracking, and dependency relationships
- Centralized service discovery that scales from individual service deep-dives to full architecture understanding
Learn more about Discover Services.
Improvements
- Enhanced time picker in dashboards now includes both date and time selection through dropdown menus, making precise time range selection much easier than the previous manual input requirement.
- Dashboards: Better visibility for single data points in dashboard charts through increased symbol sizes, ensuring important isolated metrics stand out clearly in your visualizations.
- Rehydration: Zstandard compression support added for S3 to OpenTelemetry pipeline log processing, improving data transfer efficiency in your rehydration workflows.