
Synthetic Monitoring
Proactive uptime monitoring is here. Create checks that run continuously from multiple regions to catch issues before your users do. Synthetic monitoring supports HTTP/HTTPS, TCP, DNS, and ICMP checks with custom assertions for response validation and timing thresholds.
- HTTP/HTTPS checks with custom headers, authentication, and response assertions
- TCP checks for verifying port connectivity to databases, caches, and internal services
- DNS checks to validate resolution and record values
- ICMP checks for traditional ping-based network monitoring- Multi-region execution across geographic locations
- Custom assertions on response codes, body content, headers, and timing thresholds
Discover Service Map
An interactive topology map automatically built from your trace data shows how your services communicate. See request flows, latency and error indicators between services, and identify bottlenecks — all without any manual configuration.
- Auto-discovered topology built from trace data with no manual setup- Request flow visualization showing traffic movement between services- Latency and error rate indicators on connections to identify bottlenecks
- Click any service node to see its dependencies and drill into detailed metrics
- Focus on a service to highlight upstream and downstream connections
- Double-click a node to navigate directly to its Discover Services page
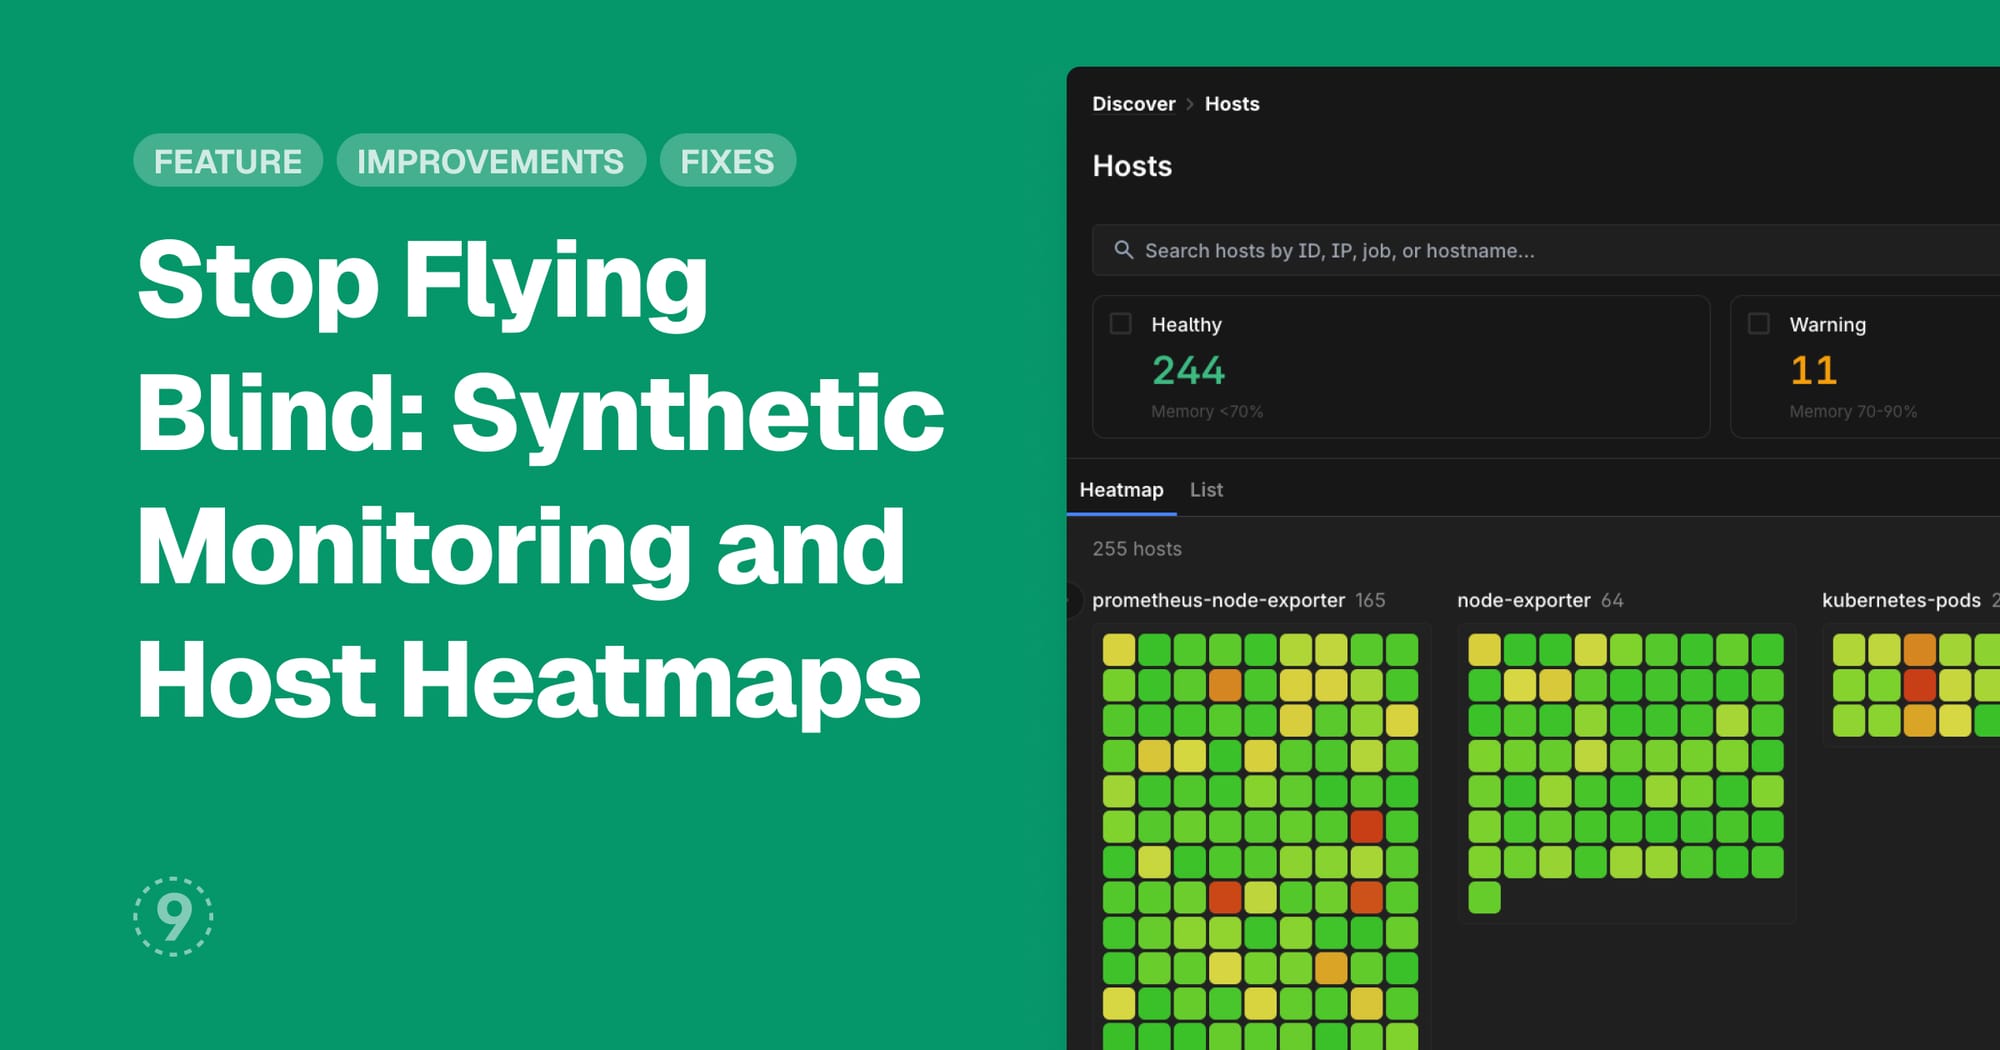
Host Health Heatmap
Discover Hosts now includes a visual heatmap that shows the health of all your hosts at a glance. Instead of scrolling through tables, see color-coded health indicators across your entire fleet and drill down into any host with a single click.
- Color-coded health indicators — green for healthy, yellow for warning, red for critical
- Search and filter by host name, tag, or status- Group by any attribute such as environment, region, team, or custom tags
- Click any cell to drill down into detailed host metrics
- Toggle between heatmap and list views
Improvements
- Discover
- Per-process metrics on host detail pages with CPU, memory, and resource usage by individual process
- RUM session filtering by page views and user actions in Applications
- Kubernetes pod views include CPU and memory trend charts
- Dashboards
- New heatmap, bar chart, and status history widgets with configurable thresholds and saved sort preferences
- Legend placement configurable with left, right, or bottom positioning for line and donut charts
- Logs
- All JSON attributes indexed by default with full nested field search and "Filter By" on every field
- Related logs from traces now support filtering and time range changes
- AI Assistant: New chat interface with improved streaming and semantic search-based context engineering
- Control Plane: Trace attribute remapping with sequenced rules applied at ingestion time to normalize naming across services
- Settings: Removed the 5-user limit on free plan accounts
- Platform: Hosted MCP server for connecting AI tools to observability data
- General
- Keyboard shortcuts throughout the app — `?` for help, `Cmd/Ctrl+K` for command palette, `j`/`k` for vim-style navigation, `1`/`2`/`3` to switch query modes, and toggle controls like `t f` for filters and `t w` for line wrap. View all shortcuts.
- Dark mode with theme switching from the command palette
- Command palette dynamically fetches dashboards, supports new-tab links, and triggers from the navbar
Fixes
- Discover: RUM backend correlation with DataDog was not working with forceOverwrite enabled
- Dashboards
- Label filters were only applying to one metric instead of all metrics in a chart
- Panel edit preview was not shown until switching widget types
- Logs
- Related logs view was ignoring the trace ID filter and showing all logs
- JSON tree view was not rendering arrays correctly
- Volume chart was showing incorrect data in certain conditions
- CSV exports were not including the full timestamp with year
- Control Plane: Otel collector config had a regex typo causing CrashLoopBackOff in collector pods
- Settings: Token generation modal was not functional in dark mode
- General: Left sidebar was defaulting to collapsed for first-time users