
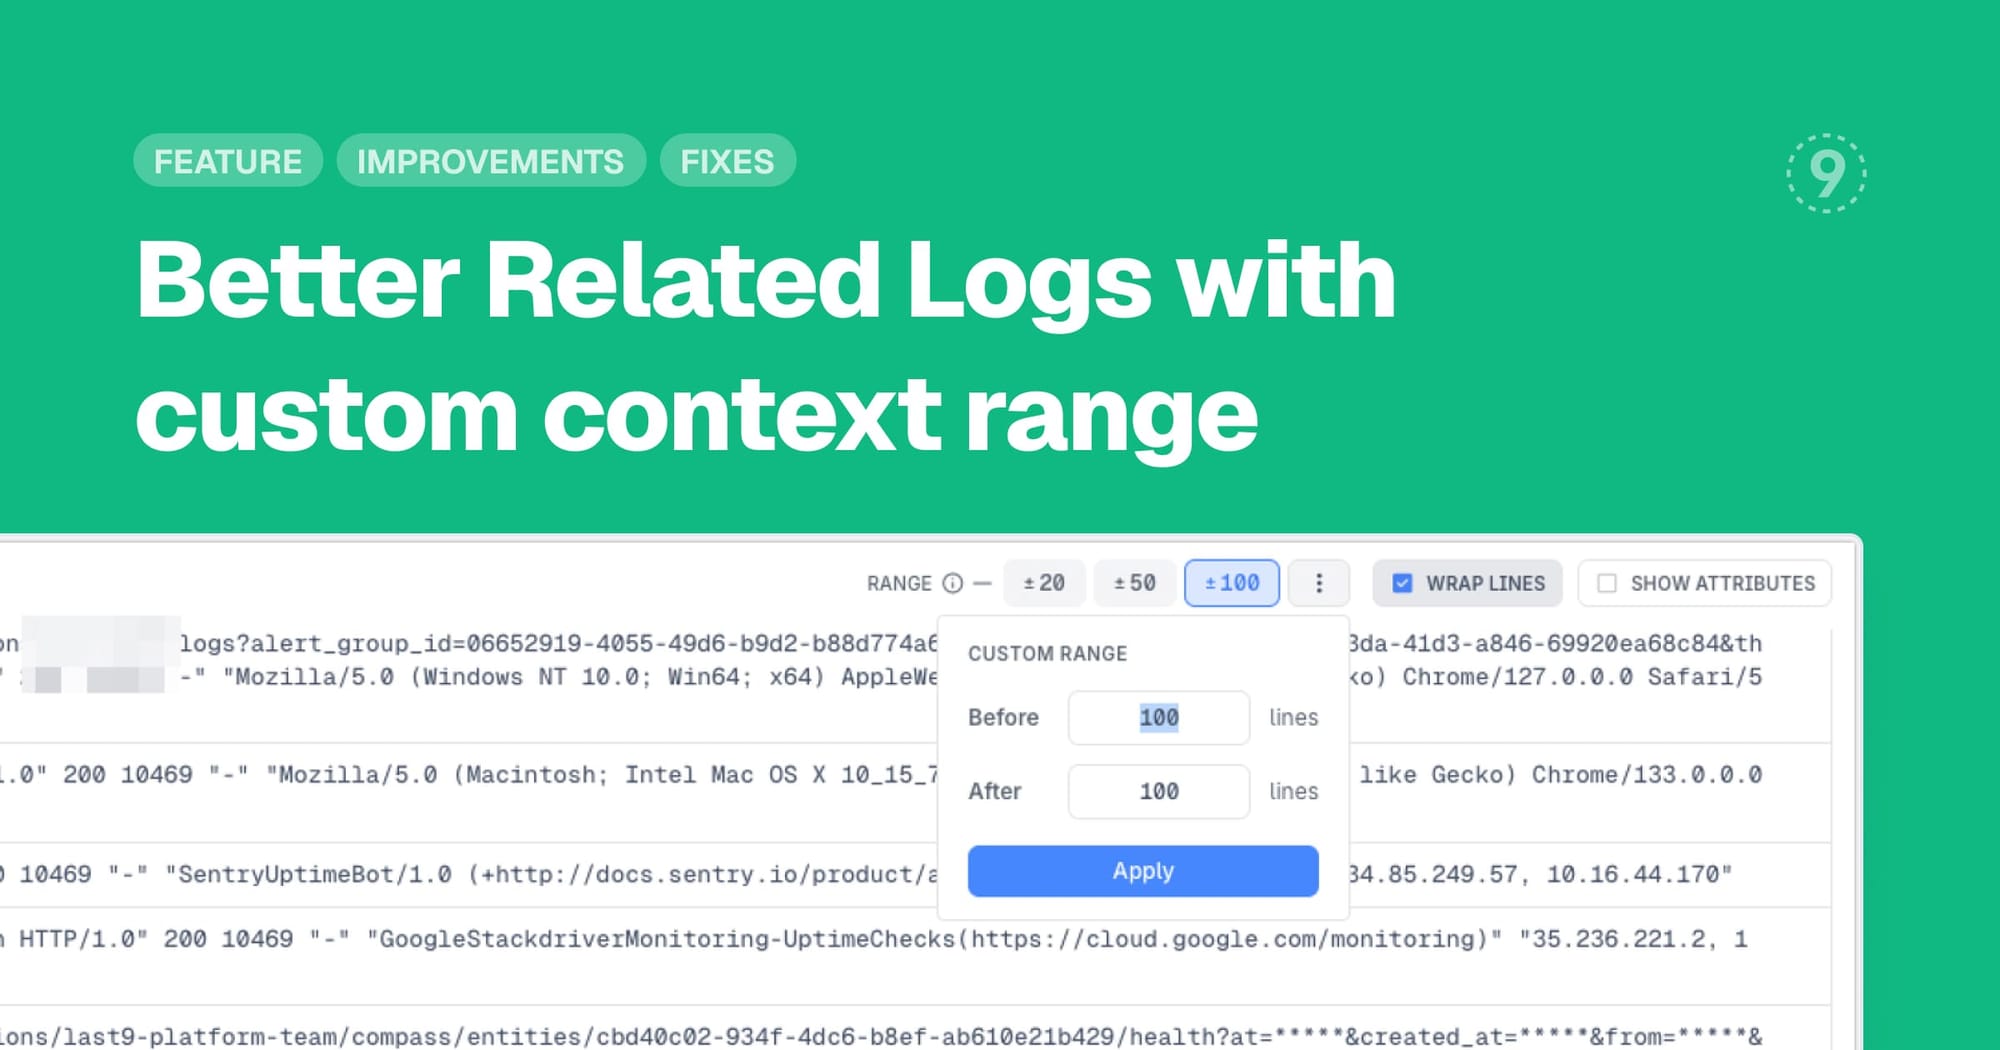
When investigating an issue in Log Details, Related Logs now gives you much more control over how much context you see. Instead of a fixed window, choose from preset ranges or define your own to see exactly the right amount of surrounding log activity.
- Preset context options: ±20, ±50, or ±100 lines around the selected log entry
- Custom range support up to 1,000 lines in each direction
- Better contextual information and navigation in the Related Logs view
Improvements
- Settings: RBAC now enforced at the API layer — all write APIs require Admin or Creator roles, integration credentials are redacted for Viewer and Editor roles, and admins can revoke ingestion and API tokens directly
- Logs
- New "contains words" operator for exact word matching in log body search, with "contains all words" and "contains any word" variants
- Query performance improved with smarter chunking when body search filters are applied
Fixes
- Discover
- Network metrics on host detail pages were showing cumulative values instead of rates due to a missing rate() wrapper
- gRPC metrics were shown as "gRPC=0" in charts for customers who do not use gRPC
- Dashboards
- Save button was not enabled after updating filters or changing queries
- Related traces were incorrectly injecting the quantile attribute into trace filters
- Logs: Export was not completing for large datasets, hanging for more than 5 minutes
- General: Breadcrumb collapse behavior was making navigation harder and has been reverted