
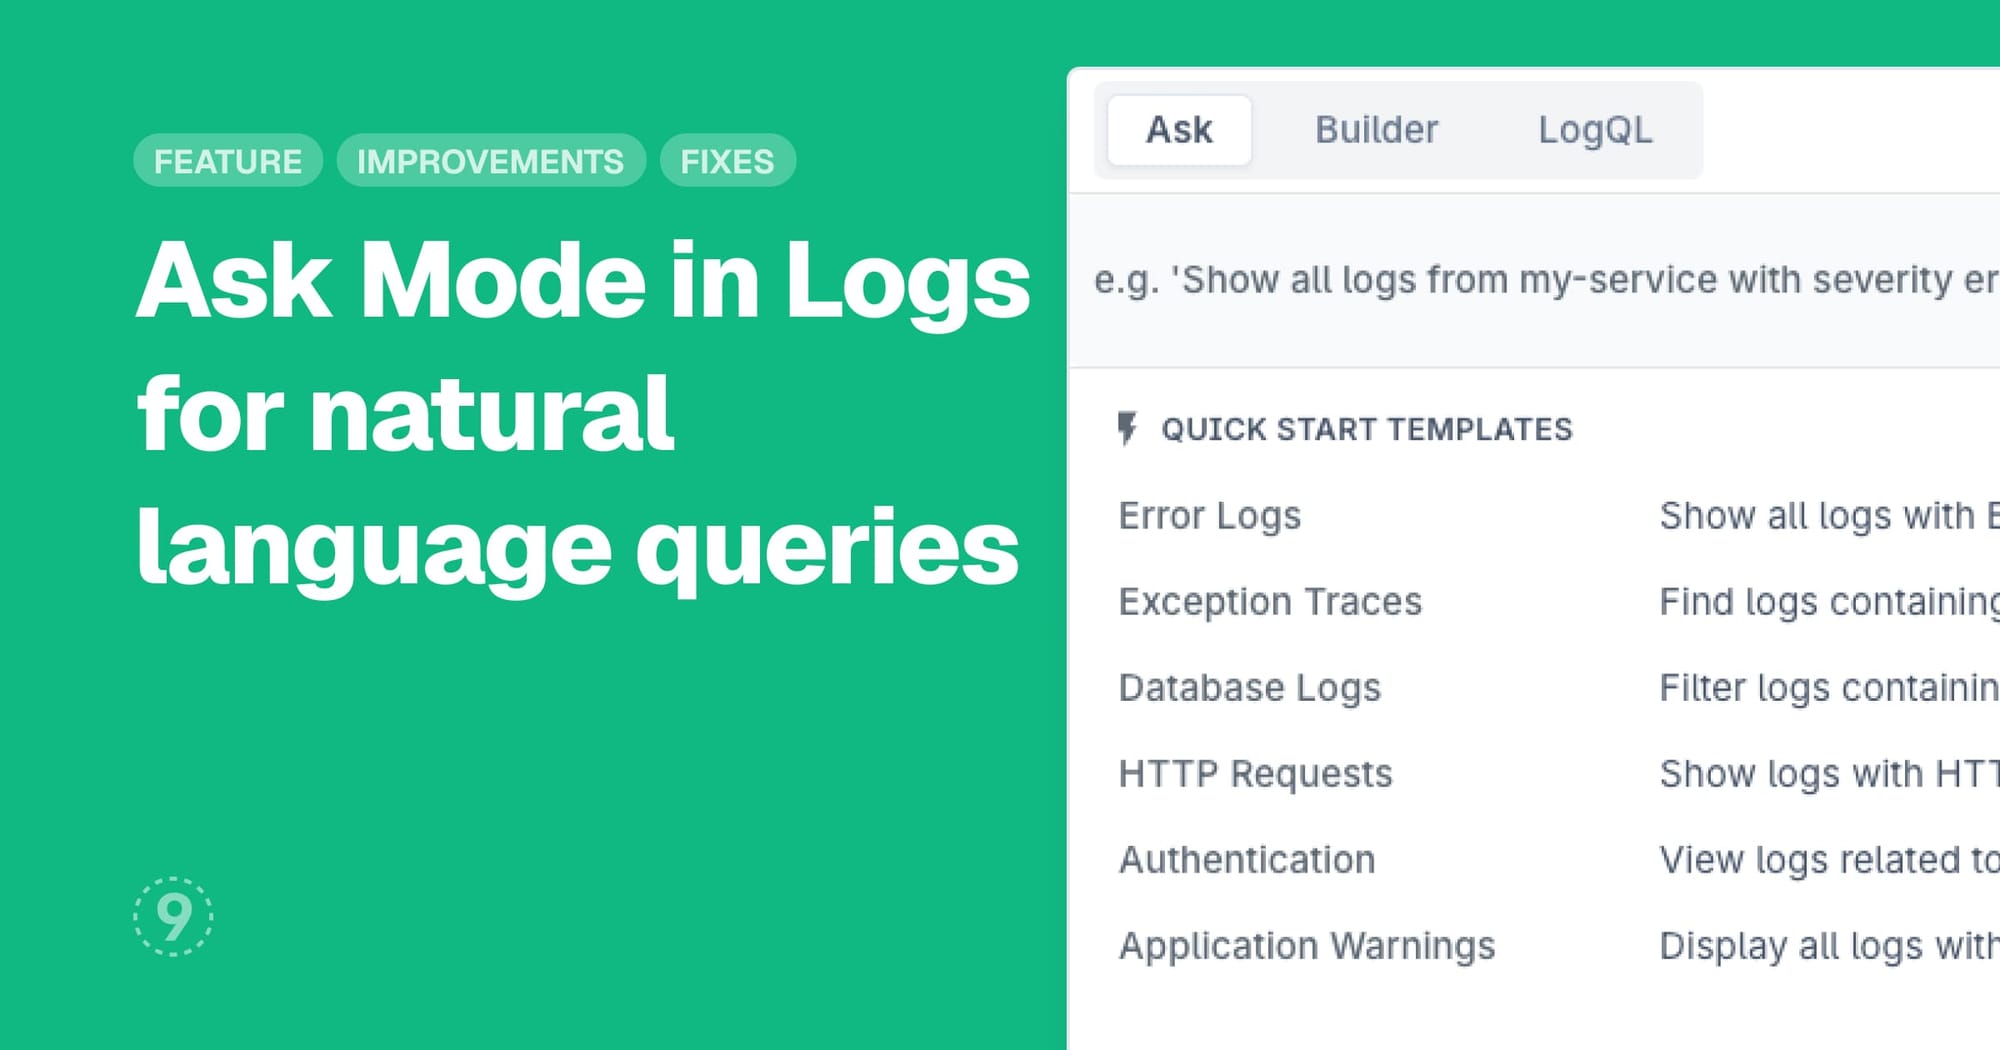
Ask Mode for Logs
Describe what you're looking for in plain language and let Last9 generate the query for you. Ask mode translates natural language questions into both Builder and LogQL formats, removing the need to build complex queries or memorize syntax.
- Natural language interface for log exploration
- Generates queries in both Builder and LogQL modes
- Overview widgets showing metrics, volume, and top services integrated directly into the query screen
- Generated queries you can review, modify, and save for future use
Table Visualizations for Dashboards
Present your metrics and time-series data in tabular format with our new table visualization panel. Configure how your data appears with flexible layout options, adjust density for information-rich or spacious views, and apply thresholds to highlight values that need attention.
- Transpose mode to switch between row and column organization
- Summary rows showing aggregated values (P50, P95, averages)
- Column visibility controls to focus on relevant metrics
- Threshold highlighting with customizable colors for at-a-glance status checks
Improvements
- Discover Applications: Sessions now include backend request correlation showing API calls, SQL queries, and resource loading for each view. Proactive problems detection surfaces critical issues like JavaScript errors, failed API requests, and slow performance at both session and view levels with severity-based alerts.
Fixes
- Creating LogMetrics with long pipeline queries was failing
- Trace Details was not displaying exceptions that had Error status codes but no exception events
- Log Volume chart tooltips were getting clipped at the edges of the viewport
- Throughput and error rate tooltips in Discover Service Summary charts were being hidden behind other panels