
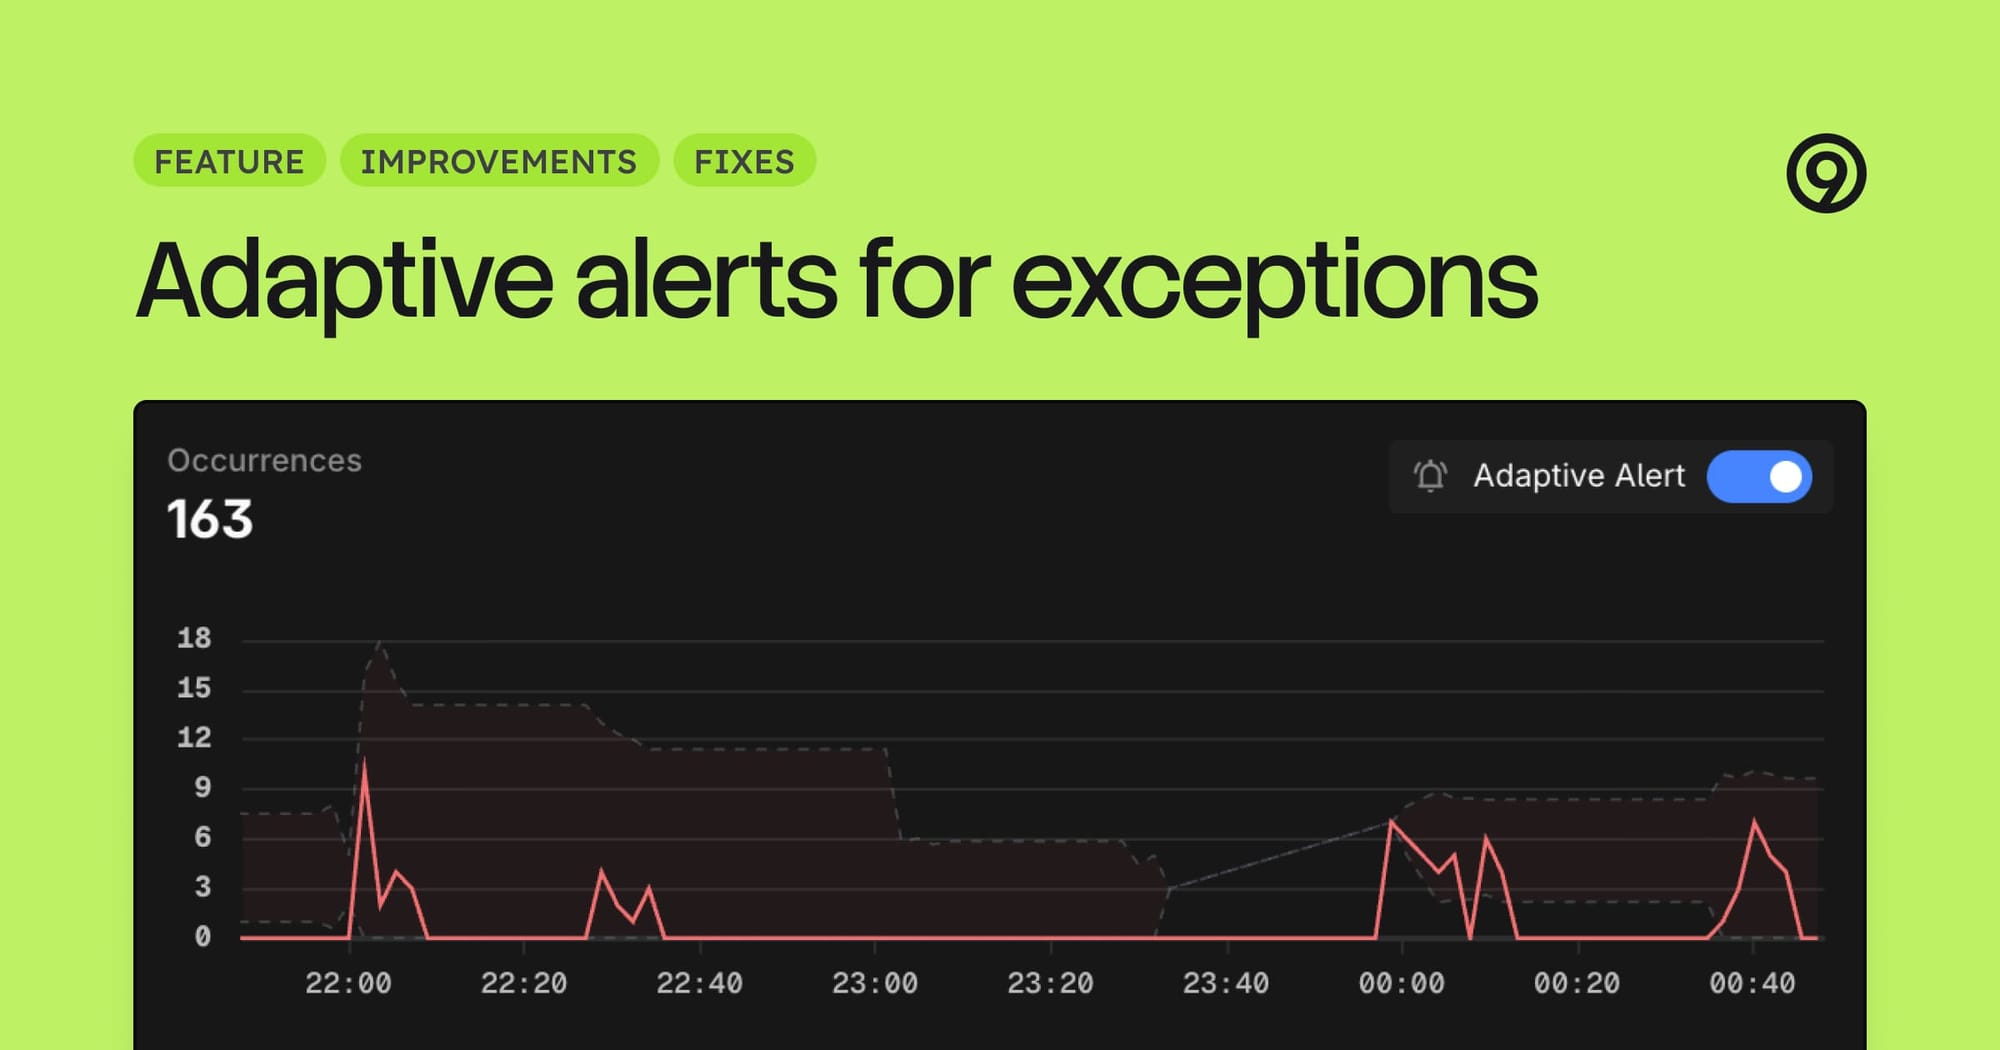
Discover Exceptions now support adaptive alerting. The system automatically learns normal exception patterns per service and operation, then alerts when counts deviate from the baseline. No manual threshold tuning required – just enable adaptive alerts from the Exceptions page and let the system learn your environment.
Key benefits:
- Alerts fire on deviation from learned baselines, not static thresholds
- Scoped per service and operation for precise, low-noise alerting
- Works alongside existing adaptive alerts already available on Discover Services
Improvements
- Dashboards: Importing Grafana dashboards into Last9 now supports table, bar, heatmap, and status history panel types in addition to timeseries (line and area)
- Discover
- Operations and endpoints pages now display max response time alongside existing latency metrics, making it easier to spot outlier requests
- Breakdown page now supports column sorting
- Truncated operation names in the Top 10 Web Operations table now show the full value on hover
- Logs: Related logs from traces now support downloading results for sharing or archival
- AI Assistant: Deep links returned by the AI assistant now use clearer, more descriptive labels
Fixes
- Discover: Exceptions page was intermittently returning incomplete results for the same time range, which also broke alert inspect links
- Logs: The logs page was becoming unresponsive for certain query pipelines
- Traces: Trace Details was hiding the root span when opened from Service Catalog if the root belonged to a different service