Assuming that you have read the Primer on Service Level Objectives (SLOs), let’s talk about the benefits of adopting SLOs.
How do Service Level Objectives help over regular (manual or per-interval threshold-based) alerting?
Short answer
Engineers and Engineering is finite resource. So would you spend them on new Features or fixing the existing problems?
Long answer (keep reading)
📊 Let’s illustrate the need using a sample service’s metrics over 15 minutes.
| Timestamp | Throughput | 5xx |
|---|---|---|
| 18:00 | 500 | 10 |
| 18:01 | 600 | 0 |
| 18:02 | 500 | 0 |
| 18:03 | 2000 | 20 |
| 18:04 | 150 | 5 |
| 18:05 | 150 | 10 |
| 18:06 | 150 | 15 |
| 18:07 | 600 | 12 |
| 18:08 | 600 | 5 |
| 18:09 | 700 | 5 |
| 18:10 | 2500 | 20 |
| 18:11 | 250 | 5 |
| 18:12 | 700 | 7 |
| 18:13 | 800 | 12 |
| 18:14 | 1250 | 5 |
| 18:15 | 1500 | 10 |
| 18:16 | 1500 | 5 |
| 18:17 | 2500 | 10 |
| 18:18 | 1000 | 10 |
3️⃣ Three questions that come to mind
- Is this Service reliable?
- Should it alert and when?
- Third, how severe is the situation?
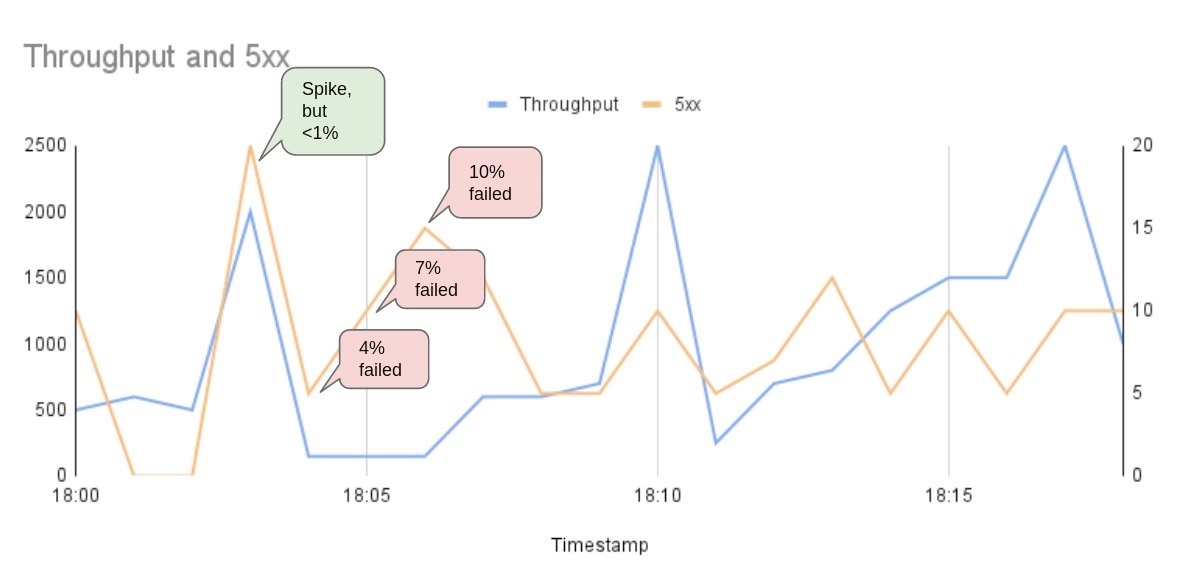
📈 Traditionally, your favorite dashboard tool would show you something like this.

🕡 There is a spike at 6:03 PM and 6:06 PM but look at the quantum of those errors.

🪂 SREs usually fall into this trap of misleading Spikes.
100% uptime is not possible. A downtime, no matter how small, is inevitable. Because you need some time off to provide for the following, some requests are bound to fail.
- 🔺Upgrades
- 🔧 Maintenance
- 🏖️ Comfort to Engineers
But this downtime, albeit small, must NOT:
- Bring down other services in the system.
- Impact a large majority of the users.
- Become a trend.
But, you cannot improve health, or anything else for that matter, without an Objective! So let's say our objective for this service is 99% health
Look at the graphs again. Is the Service Healthy?

Maybe it is?
| Total Duration | 15 minutes |
|---|---|
| Total Requests (Sum of throughput over the duration) | 17,950 |
| Total Failed (Sum of 5xx over the duration) | 156 |
| Number of minutes where error_rate (5xx/throughput) > 1% | 53% |
| Non-error Requests / Total Requests | 99.13% |
Here’s a cumulative representation of the Service’s health, or what we call a Service Level Objective.

🟢 The green line indicates the proportion of total non-error requests till that corresponding time point.
🔴 The red line is a static line at 99% health.
There would be 17 alarms for every time the Service’s error_rate was > 1%. And this would result in:
- Alert fatigue is real bro!
- Constant distraction towards Maintenance and no time for features.
Service Level Objective:
The only alert that mattered was when the Service Level Objective dropped below the desired 99% because they are not sensitive towards point-in-time fluctuations.
How to set Service Level Objectives?
At first, the thought of not paying attention to every Error seems counterintuitive, but as the business matures and the scale increases, one agrees that failures are inevitable.

How do you define the “acceptable” behavior of this Service? And the variables are:
- 🎯 How many requests should be allowed to fail, or Compliance Target.
- ⏱️ Say you are ok if 1% of the requests fail. 1% over what Compliance Period? A year, a week, a month, an hour ......?
How to choose the correct compliance?
⏱️ Compliance Period
Usually 1x or 2x of your engineering sprint cycle; this ensures that errors from one sprint do not break the budget of the next sprint. However, shorter periods also tend to be more sensitive to failure and may create more noise.
🎯 Compliance Target
Make sure to choose a limit that serves you well without multiple breakages. For example, if you desire to set 99.9%, it’s wise to start with 99% and see if it served you well.


