

Logs without structure are hard to work with. During an incident, when everything’s noisy, missing a critical error because it's buried under verbose debug logs is a common failure.
Syslog levels exist to prevent that.
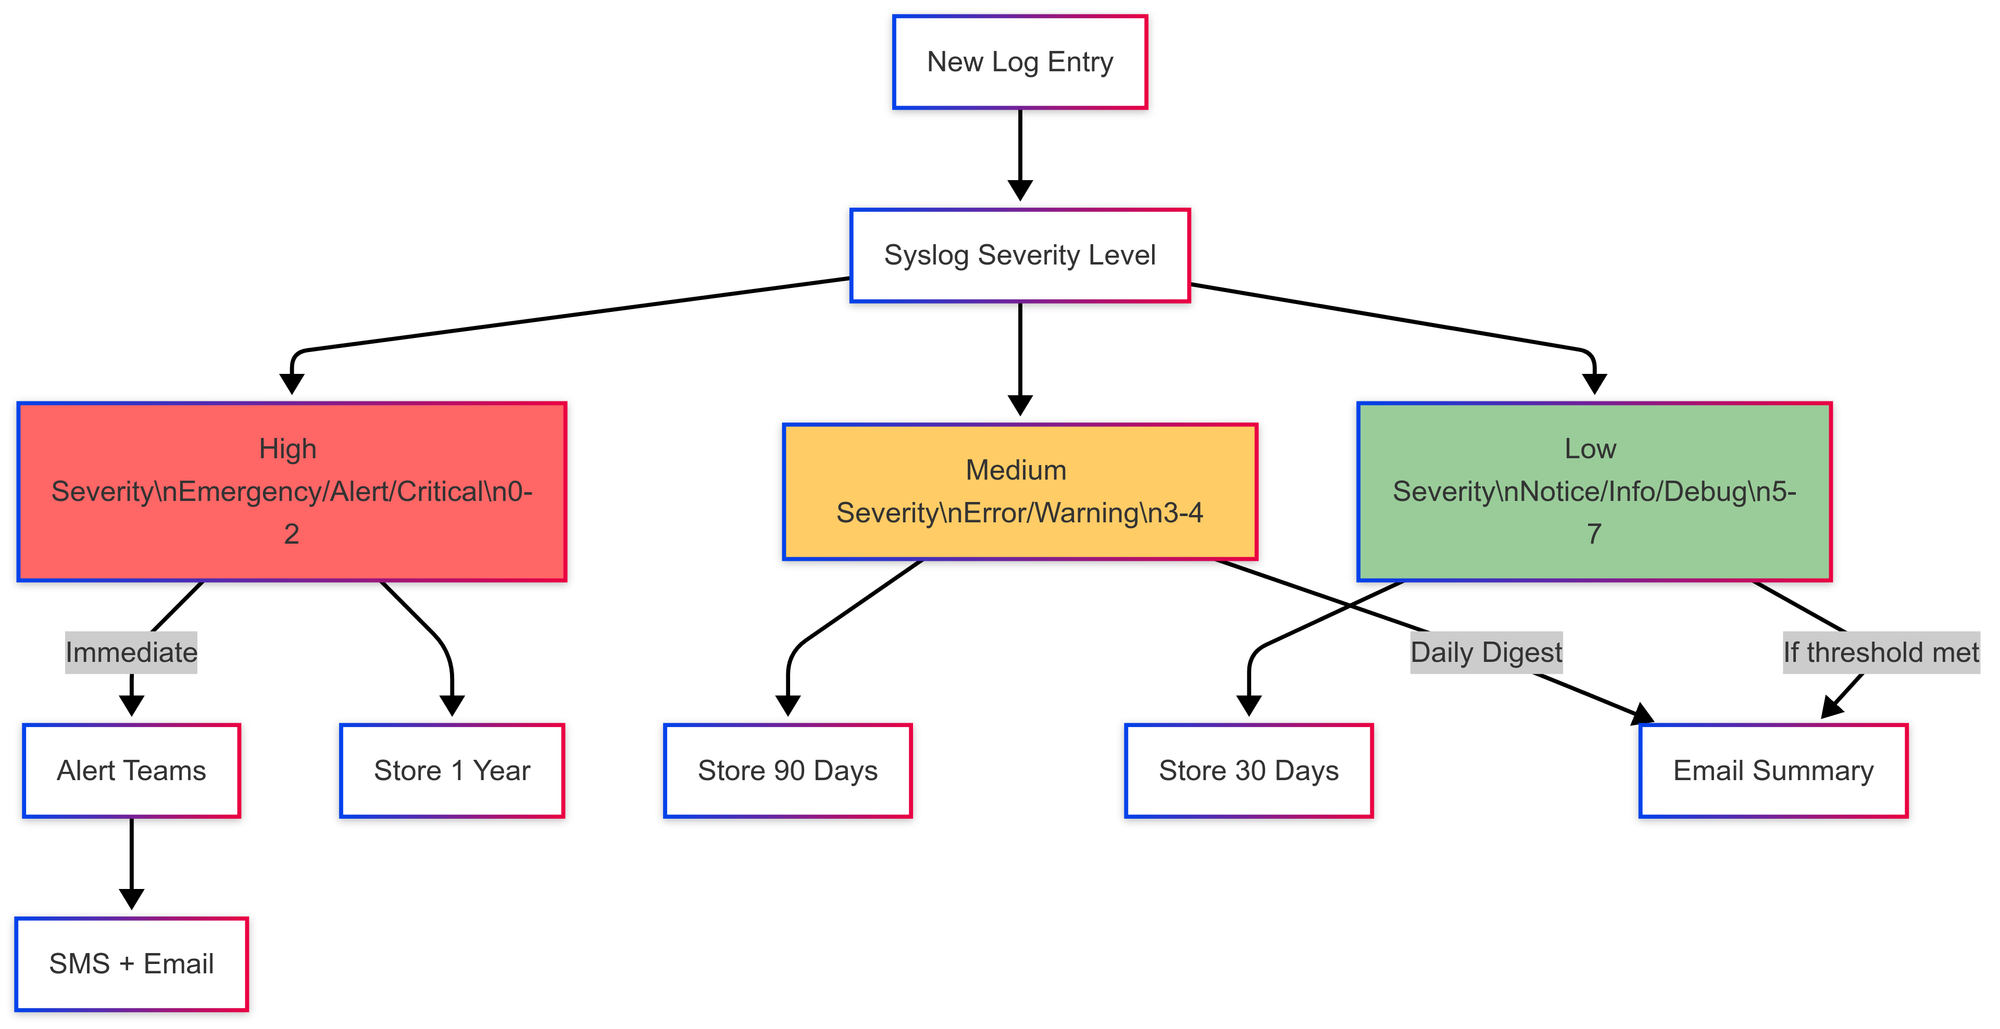
They help you classify system messages by severity, so monitoring systems can alert on the right things, and developers can filter out noise. If you're getting alert fatigue or wasting time digging through irrelevant logs, you're likely not using syslog levels properly.
Teams that properly configure syslog levels see 60% fewer false alerts and cut incident response time from hours to minutes. Here's how to get there.
What Are Syslog Levels?
Syslog levels define the severity of a log message. They help both systems and administrators figure out what needs immediate attention and what can wait.
Defined by the RFC 5424 specification, syslog assigns each log entry a numeric priority between 0 and 7:
| Level | Severity | Description | Example Use Case |
|---|---|---|---|
| 0 | Emergency | System is unusable | Hardware failure causing a full system crash |
| 1 | Alert | Immediate action required | Database corruption detected |
| 2 | Critical | Critical conditions | Firewall dropping all traffic unexpectedly |
| 3 | Error | Error conditions | Authentication failures |
| 4 | Warning | Potential issues | High CPU or memory usage |
| 5 | Notice | Normal but significant events | Configuration changes applied |
| 6 | Informational | General system activity | User logins, completed backups |
| 7 | Debug | Debugging information | Function traces, variable dumps |
The #1 Syslog Mistake
Most teams either:
- Log everything at INFO level (useless during incidents)
- Or treat every error as CRITICAL (hello, alert fatigue)
The fix: Map your actual response to log levels:
- EMERGENCY/ALERT: Page someone immediately
- ERROR: Queue for next business day
- WARNING: Monitor trends, don't alert
- DEBUG: Development only
Each level has a clear role: from catching complete system failures to giving developers context during troubleshooting. Used correctly, syslog levels make it easier to route, filter, and prioritize logs, especially when you're staring at thousands of lines during a production issue.
Quick Win: Start Here
New to syslog levels? Try this 5-minute setup:
- Set production apps to log WARNING and above only
- Route ERROR+ to your alerting system
- Send DEBUG to development environments only
This alone eliminates 80% of log noise.
Why Syslog Levels Matter
Efficient Filtering and Analysis
Syslog levels make it easier to separate signal from noise. Instead of scanning thousands of lines, you can filter logs to focus only on errors, warnings, or higher-severity issues. This speeds up debugging and shortens time to resolution, especially during incidents.
Automation and Alerting
While other tools treat logs as isolated events, Last9 connects the dots:
- Automatic Correlation: See the memory spike that caused your ERROR logs
- Intelligent Noise Reduction: 80% fewer false alerts through context-aware filtering
- One-Click Root Cause: Jump from log to metric to trace in seconds, not minutes
Other tools like Prometheus and Datadog also use severity levels to trigger alerts. An Alert (1) might page an engineer immediately. An Informational (6) log could just be stored for audit purposes. The key is configuring severity to match how your team responds.
Storage and Retention
Not all logs need to be stored equally. Debug logs can be rotated or dropped quickly, while critical errors might need to be retained for compliance or forensics. Syslog levels allow for smarter retention policies that balance cost with operational need.
Implement Syslog Levels on Network Devices
Network devices, routers, switches, firewalls generate syslog messages for everything from major failures to day-to-day events. Setting up syslog levels properly helps reduce noise and improves incident response.
1. Configure Syslog Logging
Most devices support syslog out of the box, but need some setup to forward logs to a central server.
Typical configuration steps:
- Enable logging on the device.
- Set severity level, e.g., capture only warnings and above.
- Specify the syslog server that should receive the logs.
Example configuration for a Cisco router:
logging on
logging host 192.168.1.100
logging trap warnings
This sends all messages with severity level 4 (Warning) and above to the syslog server at 192.168.1.100.
2. Technical Considerations
Manage Log Volume
High-frequency events (like interface flaps) can flood your system.
- Use rate-limiting to control volume.
- Limit production logs to
warningand above.
Ensure Log Consistency
Not all devices format logs the same way. For easier parsing and ingestion, use structured logging formats where possible.
Example (JSON):
{
  "timestamp": "2025-01-29T12:34:56Z",
  "device": "Router-1",
  "severity": "error",
  "message": "BGP session down"
}
Choose the Right Transport
Syslog can use multiple protocols:
- UDP (Port 514): Lightweight but unreliable (no delivery guarantee).
- TCP (Port 1468 or custom): More reliable with acknowledgments.
- TLS over TCP: Adds encryption to protect logs in transit.
Integrate with Monitoring or SIEM Tools
Forward syslog messages to platforms like ELK or Last9 to enable real-time search, correlation, and alerting across logs and metrics.
Configure Syslog Levels in Linux with rsyslog
Most modern Linux distributions use rsyslog as the default syslog daemon. You can customize it to control which messages get logged where, based on severity.
Step 1: Open the rsyslog Configuration File
sudo nano /etc/rsyslog.confStep 2: Set Logging Rules
Define what gets logged and where. Syslog levels range from 0 (Emergency) to 7 (Debug).
To log all authentication-related messages with severity notice and higher:
auth.notice /var/log/auth.logTo capture kernel warnings and above:
kern.warning /var/log/kern.logYou can add similar rules for other facilities like daemon, mail, or cron.
Step 3: Restart rsyslog
Apply the changes by restarting the rsyslog service:
sudo systemctl restart rsyslogThat’s it, your system is now logging messages based on severity, making it easier to route, filter, and store logs effectively.
Configure Syslog Levels Across Different Systems
Syslog isn’t just for Linux. Network devices and Windows systems can also emit syslog messages if set up correctly. Here's how to configure severity levels and forwarding on both Cisco devices and Windows hosts.
Set Up Syslog on Cisco Devices
Routers, switches, and firewalls can forward logs to a remote syslog server. You just need to define the log level and destination.
Step 1: Access the Device
ssh admin@<your-router-ip>Step 2: Set the Logging Level
Enter configuration mode:
conf tSend only logs of severity warning and above:
logging trap warningsStep 3: Specify the Syslog Server
logging host 192.168.1.100Step 4: Save the Configuration
write memoryForward Windows Logs with Syslog
Windows Event Viewer doesn’t support syslog out of the box. You’ll need a syslog forwarder like NxLog to ship logs to a collector.
Step 1: Install NxLog
Download and install the NxLog community edition.
Define inputs:
<Input in>
    Module      im_msvistalog
    Query       <QueryList><Query Id="0"><Select Path="Application">*</Select></Query></QueryList>
</Input>
Define outputs:
<Output out>
    Module      om_udp
    Host        192.168.1.100
    Port        514
</Output>
Route logs:
<Route syslog>
    Path in => out
</Route>
Step 2: Filter by Severity
Edit nxlog.conf to include only ERROR, WARNING, or other levels you want to forward.
Step 3: Restart the Service
net stop nxlog
net start nxlog
Three Things Developers Often Miss About Syslog Levels
1. Facility Codes Matter Just as Much as Severity
Syslog messages have two parts: severity level and facility code. The facility tells you where the log came from, auth systems, cron jobs, daemons, etc.
Common facility codes:
auth (4)– Authentication eventscron (9)– Scheduled tasksdaemon (3)– Background serviceslocal0–7 (16–23)– Custom apps
Pairing severity with facility makes filtering and routing more precise. For example, you might want to send all auth.error logs to a security team while ignoring daemon.debug logs during off-hours.
2. Not All Systems Interpret Levels the Same Way
There’s no universal behavior.
- Cisco devices treat
0–2as critical and often log them by default. - Apache or Nginx can log at
debug (7)but usually need extra flags for verbosity. - AWS CloudWatch and other cloud platforms might map syslog levels to JSON fields instead of treating them as true priorities.
Knowing how your system interprets log levels is key. Otherwise, you might miss something important or trigger alerts on noise.
3. Misused Log Levels Can Break Everything
Apps don’t always label logs correctly.
You’ll find apps logging a routine status check as error, or marking a failure as info. This leads to noisy alerts or, worse, missed problems. If your alert system relies on severity, make sure your app logs are accurate. Audit them occasionally.
Difference Between Syslog Facilities and Severity Levels
As we discussed, syslog messages are categorized using two dimensions: facilities and severity levels.
What Are Syslog Facilities?
Facilities identify the source of a log message, kernel, authentication, daemons, user applications, and more. Each facility is assigned a numeric code:
| Facility Code | Facility Name | Description |
|---|---|---|
| 0 | Kernel | Logs from the OS kernel |
| 1 | User-Level | User-space applications |
| 2 | Email-related logs | |
| 3 | System Daemons | Background system services |
| 4 | Authorization | Auth and security events |
| 5 | Syslog Daemon | Messages from the syslog service itself |
| 6 | Line Printer | Printer-related logs |
| 7 | Network News | Messaging/news protocols |
| 8 | UUCP | Unix-to-Unix Copy logs |
| 9 | Clock Daemon | Time sync services |
| 10 | AuthPriv | Restricted access auth logs |
| 11 | FTP | File Transfer logs |
| 16–23 | Local0–Local7 | Reserved for custom application logging |
How Facilities and Severity Levels Work Together
Every syslog message includes both a facility and a severity level. These two values are combined into a single priority (PRI) value using this formula:
PRI = (Facility × 8) + SeverityExample:
An authentication failure (Facility 4, Severity 3 – Error) would have a priority value of:
(4 × 8) + 3 = 35This priority value is included in the message header and helps syslog receivers sort, route, and filter logs efficiently.
Use Cases
- Filtering: Log collectors can be configured to ingest only logs from specific facilities and severity levels. For example, collect only
auth.warningand above. - Routing: Logs from different facilities can be sent to different files or alert systems. Security logs can go to SIEM; debug logs to cold storage.
- Security: Logs under
authprivordaemon.erroften contain sensitive data. These should be stored securely with access controls.
Best Practices for Managing Syslog Levels
1. Filter Logs by Severity
Use tools like rsyslog or syslog-ng to route important messages to specific files.
Example:
if $syslogseverity <= 3 then /var/log/critical.logThis captures all logs at Error (3) or higher severity—i.e., Critical, Alert, and Emergency.
2. Centralize Log Collection
Managing logs on individual servers doesn't scale. Use platforms like Last9, ELK, or Loki to aggregate and search logs across your fleet.
Centralization also makes it easier to correlate issues across services.
3. Rotate Logs to Avoid Bloat
Large log files slow down disk I/O and search. Use logrotate to manage retention.
Example:
/var/log/syslog {
    weekly
    rotate 4
    compress
}
This keeps four weeks of syslog data, compressing older logs to save space.
4. Correlate Logs with Metrics
Logs tell you what happened, but not always why. Pair logs with metrics like CPU, memory, and network usage to get full context.
Platforms like Last9 and Grafana can show spikes in resource usage right next to log spikes, making root cause analysis faster and less guesswork-driven.
Application of Syslog Levels in Real Systems
Syslog severity levels help teams prioritize issues, reduce alert fatigue, and troubleshoot faster. Here's how each level is used in practice, along with examples and recommendations.
Level 0 — Emergency (System Unusable)
Example: Kernel panic or hardware failure causing a full system crash.
Best Practice: Trigger immediate alerts and, if possible, initiate automated failover or recovery scripts.
Level 1 — Alert (Immediate Action Required)
Example: Database corruption, compromised credentials, or firewall misconfigurations.
Best Practice: Route directly to on-call systems with zero delay. These should bypass regular queues.
Level 2 — Critical (Service at Risk)
Example: Application memory exhaustion or storage nearing capacity.
Best Practice: Pair with threshold-based metrics to catch these before they cause downtime.
Level 3 — Error (Operational Failures)
Example: Failed API calls, login failures, or service restarts due to crashes.
Best Practice: Include enough context to debug (e.g., request ID, endpoint), but avoid logging PII or sensitive tokens.
Level 4 — Warning (Non-Critical but Concerning)
Example: CPU usage at 90%, disk I/O latency rising, or service restart without failure.
Best Practice: Use these to flag early signs of degradation. Surface in dashboards, but don’t alert unless persistent.
Level 5 — Notice (Expected but Noteworthy)
Example: Feature flags toggled, config files updated, user permissions changed.
Best Practice: Store for audit logs or compliance. No need to alert unless in regulated environments.
Level 6 — Informational (System Activity)
Example: Successful user login, backup completed, scheduled job ran on time.
Best Practice: Archive for reporting or diagnostics. Keep out of dashboards and alerts.
Level 7 — Debug (Detailed Tracing)
Example: Stack traces, variable values, internal function calls.
Best Practice: Enable selectively during testing or for specific services in staging. Avoid logging at this level in production unless scoped tightly.
Wrapping Up
Syslog levels are fundamental for structured logging, helping engineers diagnose issues efficiently.
Beyond just knowing the levels, understanding how different applications log, configuring filtering rules, and integrating logs with metrics can make troubleshooting significantly easier.
FAQs
1. What are syslog severity levels?
Syslog severity levels categorize log messages based on urgency, ranging from Emergency (0) for system failures to Debug (7) for detailed troubleshooting messages.
2. Why are syslog levels important?
They help teams prioritize issues, filter logs efficiently, and ensure critical events get immediate attention while routine messages remain accessible for analysis.
3. How many syslog severity levels exist?
There are eight levels, numbered from 0 (Emergency) to 7 (Debug).
4. Can I configure which syslog levels to log?
Yes, most systems allow filtering logs by severity. For example, you can log only warnings and above to reduce noise.
5. What’s the difference between syslog facilities and severity levels?
- Severity levels indicate the urgency of a log message.
- Facilities define the source of the log, such as authentication, networking, or system processes.
6. How do syslog levels affect monitoring and alerting?
Alerts are typically triggered by higher severity logs (Error and above), while lower severity logs (Notice and below) are stored for analysis and debugging.
7. What happens if all syslog messages are logged?
Logging everything, especially Debug messages, can generate excessive log volume, leading to storage issues and performance degradation. It’s best to log selectively based on the use case.
8. Do all devices and applications use the same syslog levels?
While syslog is standardized, different vendors may interpret severity levels slightly differently. Always check device or application documentation.
9. How can I ensure important syslog messages are not missed?
- Set up log filtering to capture relevant severity levels.
- Use centralized logging to aggregate logs from multiple sources.
- Implement alerts for critical events.
10. Is syslog used only for networking devices?
No, syslog is widely used across servers, applications, and security systems to capture and manage logs efficiently.

