📚 The year is 1984!
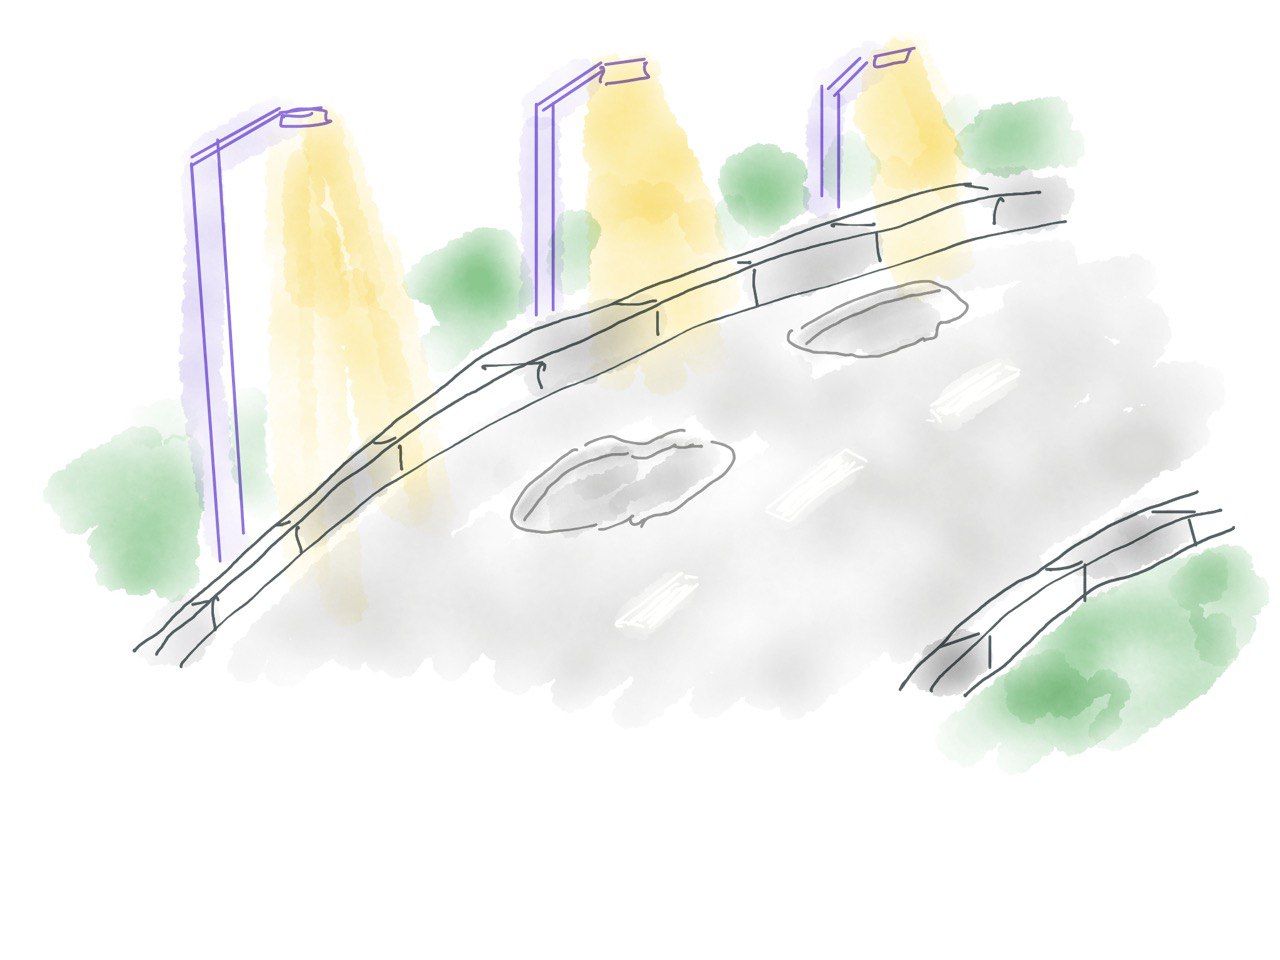
It’s been around ~80 years since Robert Frost met the two roads that diverged in the wood and took the less traveled one. Alas, no one talks about the story after - potholes everywhere!
Moral: Think before you take the road less travelled by and trust Google Maps!
The US Transportation Research Board has been contemplating publishing a Highway Capacity Manual 🛣️ to guide the numerous engineers and architects involved in building the humungous network of highways all across the United States 🇺🇸, as urbanization deeply kicks in.
However, they realize they have no objective standard to measure the performance of these highways. A lot of brainstorming led to two factors becoming crucial:
1. ASSET QUALITY INDEX: 💹 There should be an absolute measure of the performance, dependent on the quality of the material, engineering design, wear and tear of the road, etc.

Because the asset quality (the highway in this case) is ever degrading and the maintenance cost is high, it is crucial to define the absolute critical threshold below which the road is deemed “degraded” and must be attended. Until then, all one needs to do is routinely check if the condition is above the critical threshold or not.
While many such indexes exist today, the most common is the universally recognized international roughness index - an index to define how smooth a ride is based on the quality of the road.
2. CUSTOMER HAPPINESS INDEX: 🙋🏻 Over and above the floor of asset performance, we also need to understand how a customer remains happy with the asset. In the case of the US highway manual, this led to factors such as average Traffic congestion, Average vehicle speed, the density of traffic, etc. We can also further complicate this by introducing seasonality factors such as peak hour timing etc.

Example of what the Level of Standard (LOS) looks for the traffic congestion variable:
| LOS Rating | Term |
|---|---|
| A | Free flow, traffic flowing at complete mobility, 27 car lengths difference b/w two consecutive cars |
| B | Reasonably free flow, 16 car lengths |
| C | Stable/near free flow, 11 car lengths |
| D | Approaching unstable flow, eight-car lengths |
| E | Unstable flow, operating at capacity, six-car lengths |
| F | Forced or breakdown flow |
These two indexes lead to a highly used term in the heavy asset management industry (roadways, infra, etc.) called LEVELS OF SERVICE.
Accordingly, this term is used to define the performance of any service provided by the builder (analogy getting close to our software world, hang tight!)
Fact time:
Did you know that a similar Levels of Service concept is used in the sewage management industry 💩 ?
ASSET QUALITY: number of cracks per pipe 🧨
(standardized for cross-section area, the thickness of the wall, the material of the pipe, etc.)CUSTOMER HAPPINESS INDEX: number of times the flush works 🚽
( ~1 failure per 6 months seems acceptable to me, but you do you)
How does this translate to Service Level Objectives (SLOs)?
The year is 2022!
The goal of using SLOs today remains the same for which the good, wise folks were using Levels of Service back in the days:
Measure performance objectively!
Accordingly, therefore, we should measure the performance of our services on two levers:
Asset quality: factors that define the absolute measure of material involved are usually the underlying Infrastructure, regardless of the traffic it serves.Customer happiness index: factors that could define customer happiness (or business objectives given business is also a customer to the internal tech team). It is essential to understand that these factors will vary as per your business and customer demands. Still, they always need to be measured outside in - as the customer experiences it. This translates to -Monitor Services, Not Servers for those familiar with us!This leads to SLOs on factors as availability, latency, throughput etc.
Here is a quick cheat sheet on which variable to use for which kind of service:
| Type of service👇🏽 | Availability | Latency | Throughput | Correctness | TAT/Lag |
|---|---|---|---|---|---|
| Consumer-Facing | ✅ | ✅ | ✅ | ||
| Stateful | ✅ | ✅ | ✅ | ||
| Asynchronous | ✅ | ✅ | ✅ | ||
| Operational | ✅ | ✅ | ✅ |
(Learn more: How do you measure SLOs)
Summary
When deciding which SLOs to set for which service, keep in mind only two fundamental questions, and we promise you will have a smooth ride 🚀 :
- Am I measuring the factors that define the underlying Infrastructure? (asset quality index)
- Am I measuring the characteristics that determine the happiness of my customers? (customer happiness index)


