

Log management plays a critical role in managing the complexities of distributed systems. This guide explores centralized logging, an approach that has transformed how organizations handle log data in modern software architectures.
We’ll cover its benefits, essential components, and best practices to help you implement centralized logging effectively.
Table of Contents
- Introduction to Centralized Logging
- The Need for Centralized Logging
- Key Components of a Centralized Logging System
- Popular Logging Solutions
- How to Implement Centralized Logging
- Best Practices and Advanced Topics
- Centralized Logging in the Cloud
- The Future of Centralized Logging
- Conclusion
Introduction to Centralized Logging
Centralized logging gathers log data from different sources into one spot, making it much easier to manage and analyze. As our IT environments get more complex—especially with the rise of microservices—having a centralized system is key. It helps us keep an eye on everything and quickly tackle any issues that come up.
In my early days as a developer, I remember the frustration of SSH-ing into multiple servers, tailing log files, and trying to piece together what went wrong during an outage. Centralized logging has eliminated that pain point, and I can't imagine going back to those manual processes.

The Need for Centralized Logging
The shift towards centralized logging wasn't just a matter of convenience; it was a necessity born out of the increasing complexity of modern software systems.
Here are some key reasons why centralized logging has become indispensable:
- Diverse Data Sources: Our IT infrastructure includes a wide array of data sources, from application servers and databases to firewalls and IoT devices. Centralized logging provides a unified view of all these sources.
- Cross-Platform Support: With systems running on various platforms like Windows, Linux, and Docker containers, a centralized logging solution needs to support log collection from all these environments.
- Real-time Insights: Waiting for log files to be manually collected and analyzed is no longer acceptable. We need real-time insights to respond quickly to issues.
- Event Correlation: Understanding the relationship between events across different components of a system is crucial for effective troubleshooting. Centralized logging makes it easier to correlate events and identify root causes.
- Compliance and Auditing: Many industries have strict requirements for log retention and analysis. Centralized logging helps in meeting these compliance standards by providing a single location for all log data.

Key Components of a Centralized Logging System
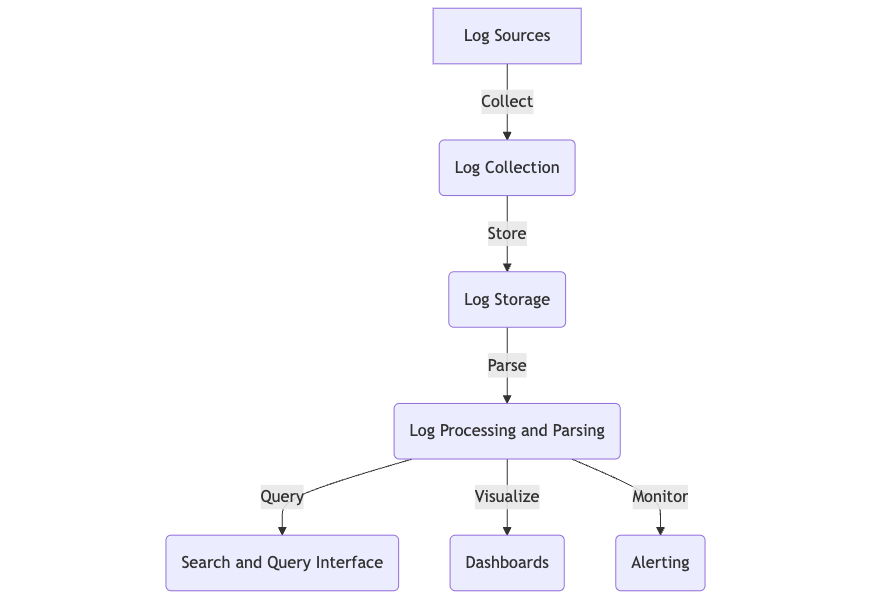
A typical centralized logging system consists of several key components:
- Log Collection: This component is responsible for gathering logs from various sources, including applications, databases, firewalls, and more. Tools like Logstash, Fluentd, or custom agents can be used for this purpose.
- Log Storage: A centralized storage solution is needed to store the collected logs. Elasticsearch is a popular choice, but there are other options like SQL databases or specialized time-series data warehouse like Last9.
- Log Processing and Parsing: Raw logs often need to be processed and parsed for efficient searching and analysis. This step involves extracting structured data from unstructured log messages.
- Search and Query Interface: A user-friendly interface for searching and querying logs is essential. Tools like Kibana provide powerful visualization and querying capabilities.
- Dashboards and Visualization: Dashboards allow you to create visual representations of your log data, making it easier to spot trends and anomalies at a glance.
- Alerting and Monitoring: The ability to set up alerts based on log patterns or metrics derived from logs is crucial for proactive monitoring.
Here's a simplified diagram of how these components typically interact:
Popular Logging Solutions
There are several popular solutions for centralized logging. Here are some that I can recommend:
- ELK Stack (Elasticsearch, Logstash, Kibana): The ELK stack is a powerful open-source solution that supports a wide range of data sources and provides robust parsing capabilities.
- Splunk: A commercial solution offering powerful log aggregation, search, and analysis capabilities, particularly strong in security information and event management (SIEM) use cases.
- Graylog: An open-source solution known for its user-friendly interface, striking a nice balance between features and ease of use.
- Syslog-ng: A traditional choice popular in Linux environments, Syslog-ng is highly configurable and can handle high volumes of log data.
- Last9: Last9 is an opentelemetry data warehouse that provides a unified platform for logging, metrics, and tracing. It offers advanced features for managing and analyzing log data, making it a great choice for organizations looking to enhance their observability and handle high-cardinality data.
Each of these solutions has its strengths, and the choice often depends on your specific requirements, existing infrastructure, and budget.

How to Implement Centralized Logging
Implementing a centralized logging system can seem daunting, but breaking it down into steps makes it manageable. Here's a high-level guide based on my experience:
Define Your Requirements:
- What types of logs do you need to collect? (Application logs, system logs, event logs, etc.)
- What platforms do you need to support? (Windows, Linux, Docker, etc.)
- How long do you need to retain logs?
- What kind of analysis and alerting do you need?
Choose Your Stack:
Based on your requirements, select the appropriate tools. For this example, let's assume we're using the ELK stack.
Set Up Your Log Storage and Indexing:
Install and configure Elasticsearch. Here's a basic elasticsearch.yml configuration:
cluster.name: myapp-logs
node.name: node-1
network.host: 0.0.0.0
http.port: 9200
discovery.seed_hosts: ["127.0.0.1", "[::1]"]
Configure Log Collection:
Set up Logstash or Filebeat to collect logs from your various data sources. Here's a simple Filebeat configuration for collecting Apache logs:
filebeat.inputs:
  - type: log
    enabled: true
    paths:
      - /var/log/apache2/*.log
output.elasticsearch:
  hosts: ["localhost:9200"]
  index: "apache-logs-%{+yyyy.MM.dd}"
Set Up Your Visualization and Query Interface:
Install and configure Kibana. Here's a basic kibana.yml configuration:
server.port: 5601
server.host: "0.0.0.0"
elasticsearch.hosts: ["http://localhost:9200"]
Configure Authentication and Permissions:
Implement proper authentication and access control to ensure that only authorized users can read and manage logs.
Set Up Parsing Rules:
Configure parsing rules to extract structured data from your logs. Here's an example Logstash configuration for parsing Apache logs:
filter {
  grok {
    match => { "message" => "%{COMBINEDAPACHELOG}" }
  }
}
Create Dashboards:
Set up dashboards in Kibana to visualize your log data. Start with basic metrics like request rates and error counts, and build up to more complex visualizations.
Implement a Log Rotation Policy:
Ensure you have a log rotation policy in place to manage disk space and comply with any retention requirements.
Set Up Alerting:
Configure alerts based on log patterns or metrics. In Kibana, you can use the Watcher feature for this.
Test and Iterate:
Start small, test thoroughly, and gradually expand your logging coverage.
Remember, this is a basic setup. In a production environment, you'd need to consider factors like security, scalability, and high availability.

Best Practices and Advanced Topics
Best Practices
Through my years of working with centralized logging systems, I've learned several best practices that can make a big difference:
- Standardize Log Formats: Use a consistent log format across all your applications. JSON is a great choice as it's both human-readable and machine-parseable.
- Include Contextual Information: Always include relevant context in your logs. Things like request IDs, user IDs, and environment details can be invaluable during troubleshooting.
- Use Log Levels Appropriately: Be judicious in your use of log levels. Too many DEBUG logs can be as unhelpful as too few ERROR logs.
- Implement Log Rotation: Even with centralized logging, it's important to implement log rotation on your application servers to manage disk space.
- Secure Your Logs: Treat logs as sensitive data. Implement proper authentication and access control, and consider encrypting logs in transit and at rest.
- Monitor Your Logging System: Your logging system is a critical part of your infrastructure. Monitor it just like you would any other important service.
- Optimize Your Queries: Large datasets can lead to slow queries. Optimize your queries and use appropriate indexing strategies to ensure good performance.
- Use Sampling for High-Volume Logs: For very high-volume logs, consider implementing sampling to reduce storage and processing requirements.
Advanced Topics
As you become more comfortable with centralized logging, there are several advanced topics worth exploring:
- Machine Learning for Log Analysis: Tools like Elasticsearch's machine learning features can help identify anomalies in your logs automatically.
- Distributed Tracing Integration: Integrating distributed tracing with your logs can provide powerful insights into request flows across microservices.
- Real-time Log Analytics: Implementing real-time analytics on your log streams can provide immediate insights into system behavior.
- Log-based Metrics: Deriving metrics from your logs can provide valuable data for monitoring and alerting.
- API-driven Log Management: Many modern log management tools offer APIs for programmatic access to logs. This can be useful for integrating log data into other systems or building custom dashboards.
Here's a simple example of how you might use the Elasticsearch API to query logs:
import requests
import json

def query_elasticsearch(index, query):
    url = f"http://localhost:9200/{index}/_search"
    headers = {'Content-Type': 'application/json'}
    response = requests.get(url, headers=headers, data=json.dumps(query))
    return response.json()

# Example query to find all ERROR logs in the last hour
query = {
    "query": {
        "bool": {
            "must": [
                {"match": {"level": "ERROR"}},
                {"range": {"@timestamp": {"gte": "now-1h"}}}
            ]
        }
    }
}

results = query_elasticsearch("my-app-logs", query)
print(json.dumps(results, indent=2))
Centralized Logging in the Cloud
Cloud environments present both opportunities and challenges for centralized logging. Here are some key considerations:
- Use Cloud-Native Solutions: Most cloud providers offer native logging solutions that integrate well with their other services.
- Consider Data Transfer Costs: Be aware of data transfer costs when sending logs across regions or to external systems.
- Utilize Managed Services: Managed Elasticsearch services can reduce the operational overhead of running your own ELK stack.
- Use Cloud Storage for Long-Term Retention: Object storage services can be a cost-effective option for long-term log storage.
- Container Logging: If you're using Docker or Kubernetes, consider specialized logging solutions designed for containerized environments.
The Future of Centralized Logging
As we look to the future, several trends are shaping the evolution of centralized logging:
- AI and Machine Learning: Expect to see more advanced anomaly detection and predictive analytics based on log data.
- Observability Platforms: The lines between logging, metrics, and tracing are blurring. Unified observability platforms that combine all three are becoming more common.
- Edge Computing: As edge computing grows, we'll need new approaches to collecting and analyzing logs from edge devices and endpoints.
- Privacy and Compliance: With increasing privacy regulations, log management systems will need to become smarter about handling sensitive data.
- Serverless Logging: As serverless architectures become more prevalent, we'll need new approaches to logging that can handle the ephemeral nature of serverless functions.
- Real-time Stream Processing: As systems generate more log data, real-time stream processing of logs will become increasingly important for timely insights and alerting.

Conclusion
Centralized logging has revolutionized how we manage and analyze log data in IT infrastructure. It's an essential tool for any developer or DevOps professional working on complex, distributed systems.
Throughout this guide, we've covered the fundamentals of centralized logging, explored popular solutions like the ELK stack, and delved into advanced topics and future trends. We've seen how centralized logging can dramatically improve observability, streamline troubleshooting, and provide valuable insights into system behavior.
Happy logging!


