In our last piece, we talked about high cardinality, how it impacts your observability setup, and why rich, granular data often reveals things that aggregated metrics miss. This part looks at how cardinality and dimensionality are connected, and a few practical ways to manage high cardinality without losing visibility.
The two go hand in hand. As you add more dimensions, labels like customer_id, region, or endpoint, the number of unique label combinations increases. That’s what drives cardinality.
And more dimensions mean more ways to slice and understand your data. But when label growth goes unchecked, it can lead to excessive time series volume, slower queries, and growing infrastructure cost, especially when many of those series aren’t used in dashboards or alerts.
You can drop metrics after the fact or rely on sampling, but those are reactive steps. A better approach is to apply ingestion-time controls, give teams visibility into their label usage, and set clear, adjustable thresholds that help guide sustainable growth.
Let’s break down how dimensionality contributes to cardinality, and how to manage that growth intentionally, without compromising on observability.
What is Dimensionality?
In monitoring, dimensionality means the labels you tag onto your metrics to give them context. Think of them as key-value pairs that help you filter and group your data:
service_name="auth-api"instance_id="i-08f557b8d2"environment="prod"region="us-west-2"customer_id="12345"request_path="/api/v1/users"
These tags let you run queries like “show me error rates for the auth-api in prod” or “what’s the p95 latency in us-west-2?” The problem? Add too many tags and you’ll blow up your storage and make queries crawl.
A Quick Comparison: Dimensionality vs. Cardinality
| Aspect | Cardinality | Dimensionality |
|---|---|---|
| Definition | How many unique values exist for a dimension | How many different labels you attach to metrics |
| Example | customer_id might have 1M+ distinct values | Adding dimensions like region, instance_id, path |
| Technical impact | High-cardinality fields create massive index tables | Each dimension multiplies your possible time series |
| Query performance | High cardinality = larger scans = slower queries | More dimensions = more complex query planning |
What Happens When Cardinality Meets Dimensionality
Here’s where things get complicated. High cardinality combined with multiple dimensions creates a combinatorial explosion:
Consider tracking API latency with these dimensions:
- customer_id (100K values)
- endpoint (50 values)
- region (5 values)
- instance_id (100 values)
Simple math: 100,000 × 50 × 5 × 100 = 2.5 billion unique time series for just one metric.
Each dimension you add multiplies your storage needs and can turn millisecond queries into minutes-long operations that timeout. Your monitoring system can quickly become more expensive than the application you’re monitoring.
The Dimensionality Challenge for Time Series Databases
Understanding the relationship between cardinality and dimensionality is crucial because these concepts directly impact how time series databases (TSDBs) function. TSDBs are designed to efficiently store and query metrics over time, but they face unique challenges when dealing with high-cardinality data.
When dimensions multiply and cardinality explodes as we’ve described, TSDBs must work harder to index, compress, and query this data. The exponential growth in time series doesn’t just consume storage, it fundamentally changes how these specialized databases perform. While traditional databases might struggle with high cardinality in general, the problem is amplified in TSDBs because they’re optimized for time-based queries across numerous time series.
So, how can we manage this explosion of data while still maintaining the performance and insights we need? Let’s explore some practical strategies for handling high cardinality in TSDBs without sacrificing observability.
-
Dropping High-Cardinality Labels at the Source
One option is to drop high-cardinality labels right at the source to prevent the explosion in the first place. While this helps avoid the data bloat, it defeats the purpose of detailed monitoring — you’re essentially throwing away valuable context.
-
Pre-computing Common Queries
Another approach is to pre-compute common queries instead of calculating them on the fly. This is especially useful for dashboards and monitoring systems that refresh frequently. By storing the results as a time series, you can save CPU cycles and significantly boost performance. Pre-computing metrics also reduces the need for CPU-intensive scans, preventing overload on time series backends and improving overall system efficiency.
There are two main ways to pre-compute your time series data:
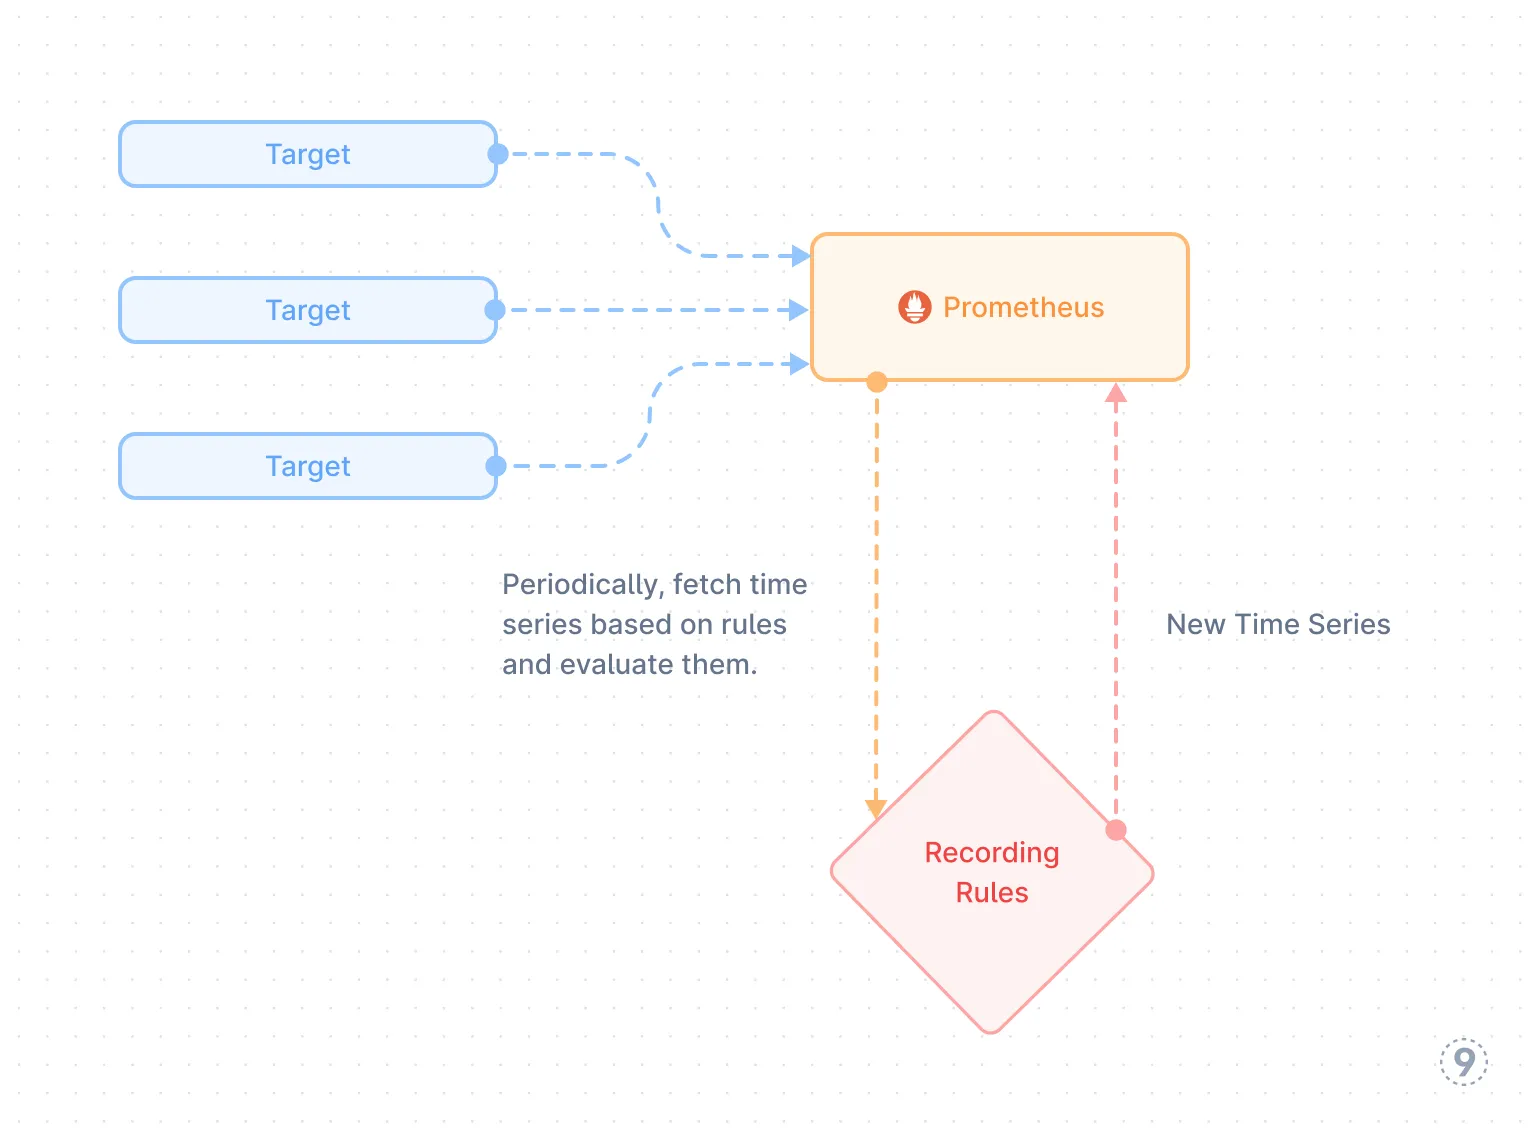
- Recording Rules: These allow you to perform advanced operations on metrics after they’ve been ingested and stored, using PromQL-based rules.
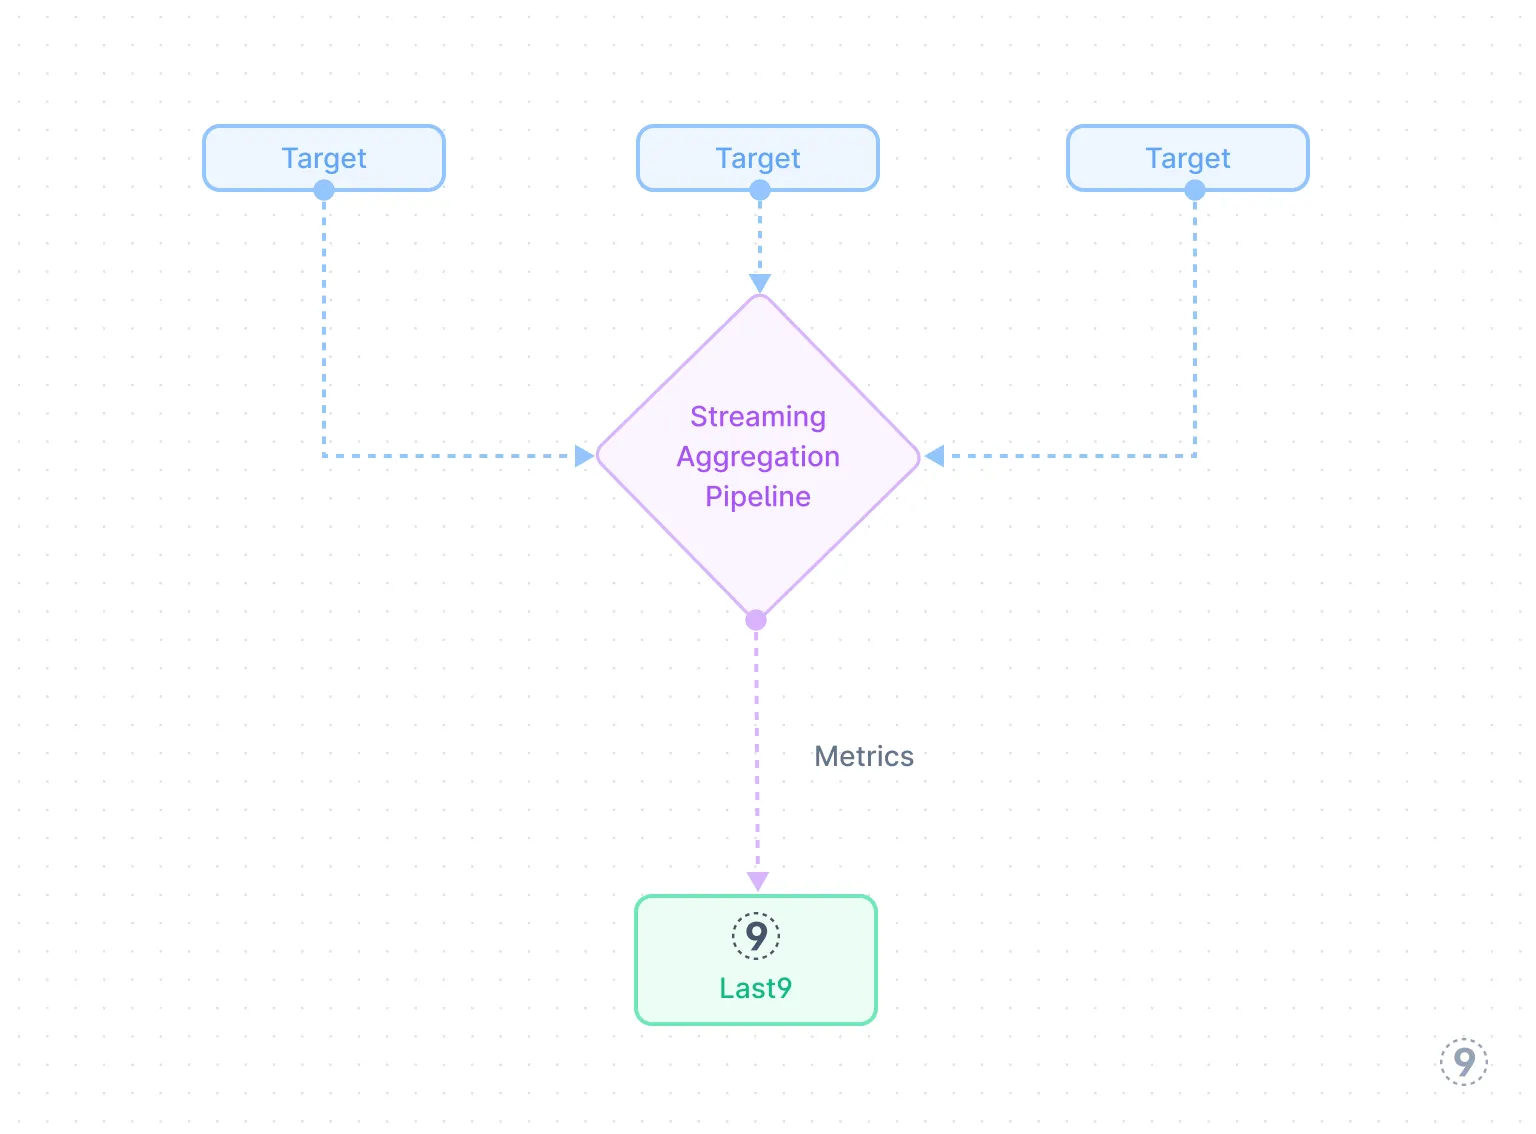
- Streaming Aggregation: This runs aggregation rules on raw data before it’s stored, reducing the amount of data saved from the start.
Let’s break down these methods further.
Recording Rules: Pre-calculating Metrics in Prometheus
Recording rules are a Prometheus feature that enables you to define new time series based on existing ones. These rules allow you to aggregate, filter, and transform your metrics into something more useful, and then query them via PromQL.

Key Consideration: Recording rules run after data is ingested, meaning they introduce a performance cost. Storing high cardinality metrics may not be the issue, but reading and generating new metrics from them is. These operations use CPU and compute resources, and if the rules are still being evaluated when queries are made, they can cause delays and impact performance.
💡 Pro Tip: Recording rules are commonly used in the Prometheus ecosystem. Tools like Sloth, a Prometheus SLO generator, rely heavily on these rules. If you’re using third-party tools, make sure to audit the recording rules they add—they could impact your time series backend’s performance!
Example:
Let’s say you want to aggregate metrics from multiple targets into a single metric. For example, you want to track the total request rate for a specific endpoint across all targets. Here’s how to set it up in Prometheus:
Define the aggregation: You want to sum the request rates for the /api/v1/ status endpoint across all targets. The query would look something like this:
http_requests_total{endpoint="/api/v1/status"} = sum(rate(http_requests_total{endpoint="/api/v1/status"}[5m])) by (job)This calculates the total request rate for the /api/v1/status endpoint using a 5-minute window, grouped by job.
Create the recording rule: Now, set up the rule in your Prometheus config:
groups: - name: http_requests rules: - record: http_requests_total:sum expr: sum(rate(http_requests_total{endpoint="/api/v1/status"}[5m])) by (job)This rule calculates the total request rate and stores it in a new metric called http_requests_total:sum. Now, you can query http_requests_total:sum directly for a simpler, faster result.
Streaming Aggregation: Real-time Data Optimization
Streaming aggregation handles high-cardinality data before it’s stored. As data comes in, it is processed in real-time, and necessary aggregations are performed immediately. This prevents excessive time series from accumulating in storage, which could otherwise slow down your queries and overload the system.

The benefits are clear:
- Better Control: It helps manage the volume of high-cardinality data.
- Speed: Aggregating on the fly ensures faster queries and quicker responses.
- Cost Efficiency: By reducing the amount of data that needs to be processed, it can help reduce costs, particularly in cloud environments.
Instead of dealing with millions of unique time series, streaming aggregation allows you to simplify queries (e.g., sum(grpc_client_handling_seconds_bucket{})) without all those extra labels bogging down performance.
Recording Rules vs. Streaming Aggregation: Which One Should You Choose?
Here’s a comparison of the two approaches to help you decide which one best fits your needs:
| What Matters | Recording Rules | Streaming Aggregation |
|---|---|---|
| When does it happen? | After the data is ingested | During data ingestion |
| Performance hit | Yes | None |
| Reliability | Fewer metrics stored, but more data processed | Less data stored = less risk |
| Scalability | Reduces storage needs but doesn’t eliminate scaling concerns | Handles huge volumes efficiently |
| Performance | Faster by processing less | Faster by storing less |
| Time to insights | Actionable, meaningful metrics | Real-time insights |
| Trade-offs | More expensive but lossless | Cheaper, but might lose some data |
The Trade-off: Cost vs. Data Fidelity
When choosing between Streaming Aggregation and Recording Rules, the main trade-off is cost versus data fidelity.
Recording Rules, on the other hand, preserve data fidelity by working with already ingested data, ensuring no points are lost. However, they come with a performance cost, as they require additional computing resources to process and store results, which can introduce latency, especially with large datasets.
Streaming Aggregation is cost-efficient for managing high-cardinality metrics. By processing data as it arrives, it reduces the number of unique time series, cutting both storage and compute costs. However, this can lead to a loss of data fidelity if the original metric is discarded. Users can still choose to store the original metric and use the generated aggregated metric for most queries, balancing cost savings with the ability to maintain finer data details when needed.
In summary, if you’re focused on cost efficiency and faster processing, streaming aggregation is the way to go. But if detailed data is critical and you can manage the added processing cost, recording rules offer more precise insights, though with a slight hit to performance.
You can also combine both approaches for the best of both worlds. For instance, streaming aggregation can handle high-cardinality metrics, like user_id or session_id, by aggregating them in real time. This reduces the number of unique time series, saving on storage and compute.
Afterward, you can apply recording rules to generate summary metrics, such as total_user_sessions, based on the aggregated data. This lets you keep the high-level overview while still having access to the original data for deeper dives when necessary.
Using both methods allows you to balance performance, cost, and data detail, making your observability setup both efficient and flexible.
Best Practices for Sustainable and Scalable Observability
Solving cardinality issues once is just the beginning. To prevent future explosions in data, you need guardrails and ongoing practices to keep things under control.
1. Design With Cardinality in Mind From Day One
- Create clear labeling guidelines: Define rules on which labels should be used and which ones should be avoided.
- Educate your team: Make sure everyone understands the impact of adding new labels and how they can affect the system.
- Audit regularly: Periodically review metrics for unused or redundant labels and clean them up.
2. Monitor Your Monitoring
- Track time series growth: Monitor the number of unique time series over time to catch spikes early.
- Set up alerts for cardinality changes: Get notified when the number of unique time series or dimensions grows unexpectedly.
- Measure your monitoring system’s performance: Keep an eye on how your observability tools are performing and adjust accordingly.
3. Set Boundaries
- Implement hard limits: Define maximum thresholds for the number of time series or unique labels.
- Use soft warnings: Alert your team when they’re approaching these predefined limits.
- Have fallback plans: When the system is under pressure, consider switching to lower-cardinality versions of key metrics to ease the load.
4. Balance Detail and Practicality
- Prioritize what matters: Focus on dimensions that provide meaningful insights into your system.
- Think long-term: Consider whether a particular metric will still be useful in six months. If not, it might not be worth tracking.
- Use tiered retention: Keep high-cardinality data for shorter periods and aggregate data for longer-term storage.
5. Clean House Regularly
- Audit your metrics: Regularly check which metrics are still relevant and actively used, and remove the ones that aren’t.
- Remove outdated metrics: Don’t hesitate to delete metrics that no longer serve a purpose in your observability efforts.
- Standardize naming conventions: Consistent naming prevents duplication and confusion, making it easier to manage your data.
The Missing Layer in Cardinality Management
It usually starts small, a new label like customer_id gets added during a release. Nothing breaks immediately, but over time, series count grows, queries get slower, and dashboards start to time out. Costs increase quietly in the background until someone notices.
Without visibility or constraints, it’s hard to know when things are drifting. Here’s how to introduce governance that work with your existing workflows:
Set Hard Limits in Prometheus
Instead of asking teams to remember cardinality guidelines, define guardrails at the monitoring layer.
You can use alert rules in Prometheus to track series count per service and team. Here’s a basic setup:
groups:  - name: cardinality_governance    rules:      - alert: CardinalityBudgetWarning        expr: |          count by (service_name, team) (            {__name__=~".+", service_name!=""}          ) > 75000        labels:          severity: warning          team: "{{ $labels.team }}"        annotations:          summary: "{{ $labels.service_name }} approaching cardinality budget"
      - alert: CardinalityBudgetExceeded        expr: |          count by (service_name, team) (            {__name__=~".+", service_name!=""}          ) > 100000        labels:          severity: critical          team: "{{ $labels.team }}"        annotations:          summary: "{{ $labels.service_name }} exceeded cardinality budget"          action: "Deployment blocked"
Raise a warning at 75K, block deploys at 100K. You can adjust those numbers based on your infrastructure and query load.
Block High-Cardinality Deployments Before They Merge
Most of the time, teams only find out about a cardinality issue after it lands in production. But it’s possible to catch this earlier, with a CI check that queries current usage before a deploy.
#!/bin/bash# cardinality-check.shSERVICE_NAME=$1
CARDINALITY=$(curl -s "http://prometheus:9090/api/v1/query?query=count({__name__=~%22.%2B%22,service_name=%22${SERVICE_NAME}%22})" | jq '.data.result[0].value[1] // "0"')
if [ "$CARDINALITY" -gt 100000 ]; then  echo "❌ Cardinality budget exceeded: ${SERVICE_NAME}"  echo "📊 Current: ${CARDINALITY} series"  echo "📋 Limit: 100,000 series"  exit 1fi
echo "✅ Cardinality check passed: ${CARDINALITY}/100,000 series"
This check prevents accidental overruns by validating current series count before changes are deployed. It’s a low-effort addition that closes the loop.
Set Budgets That Reflect How Teams Work
Start with something simple and adjust as you go:
- 50K series per service by default
- +25K for services with wide data models or complex logic
- +50K for shared infrastructure components like ingress, queueing, or control planes
These numbers are just a starting point for visibility. Once you have a baseline and know where they stand, cleanup and optimization become easier to prioritize.
Manage High Cardinality With Last9—Without Breaking a Sweat
High cardinality and dimensionality are often treated as a headache. But with the right approach and the right tools, such as Last9, you can make them work in your favor.
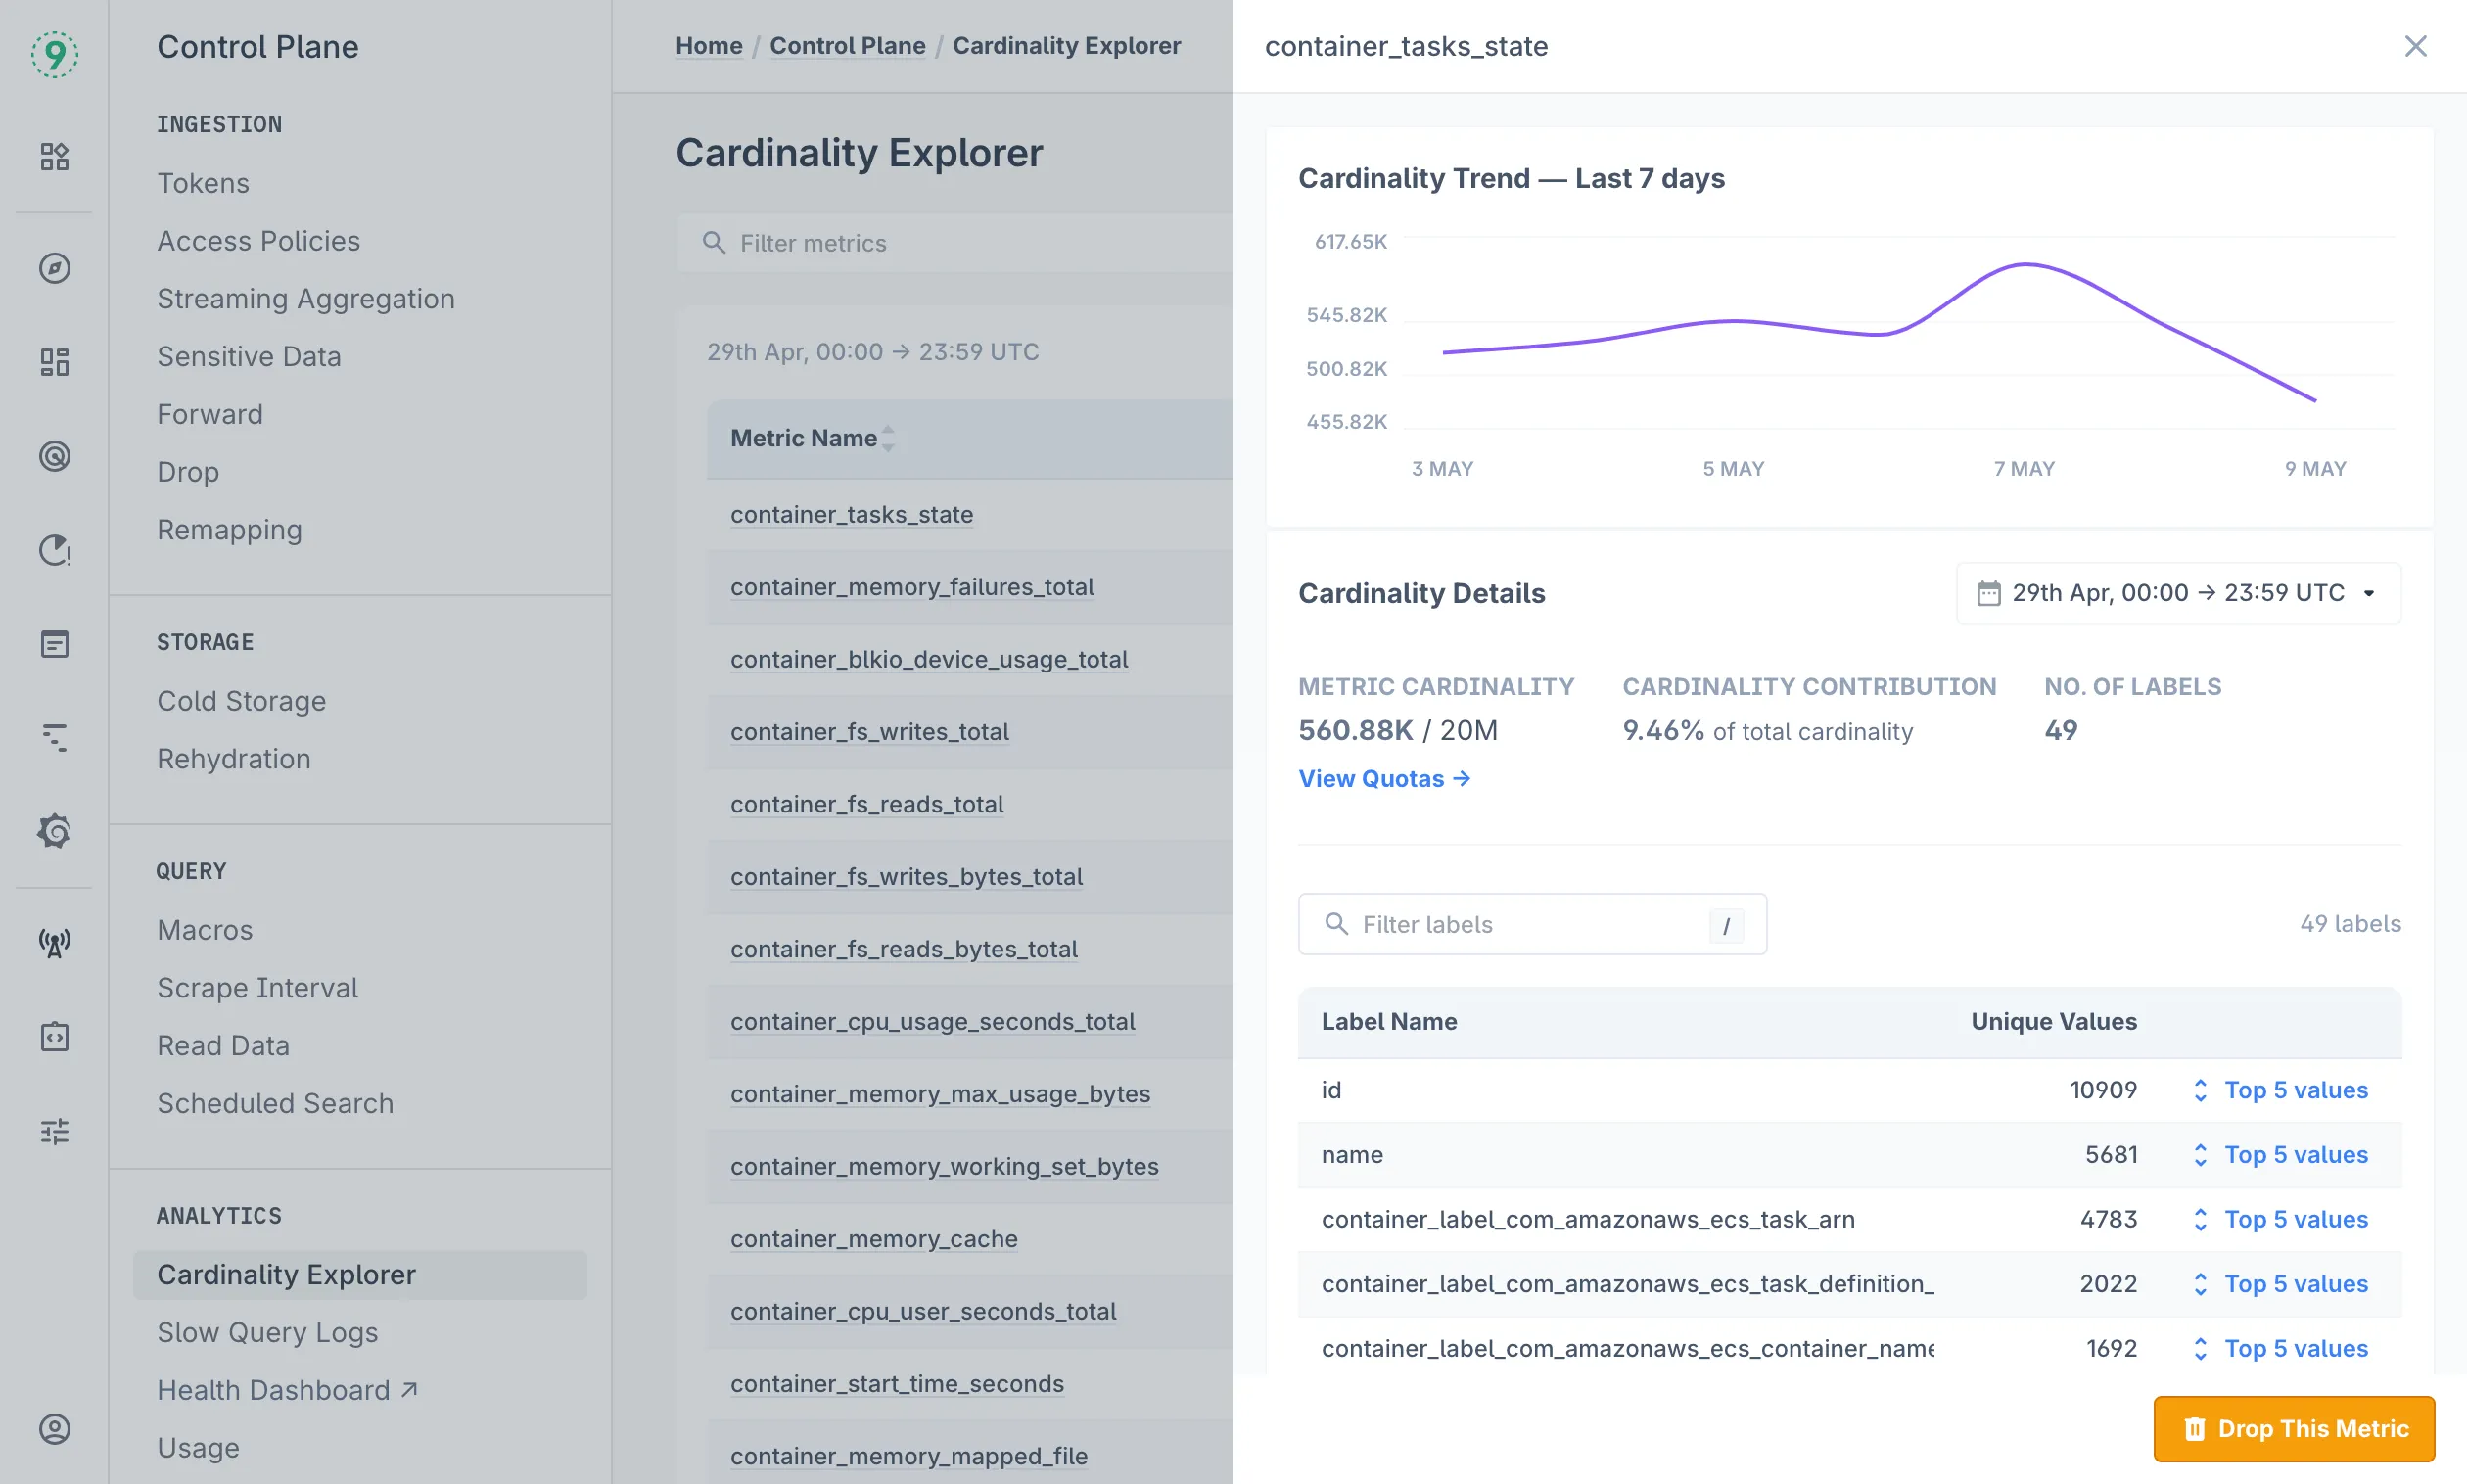
Last9’s Cardinality Explorer gives you a time-based view of how metric cardinality changes across your environment. It helps you identify metrics and labels that are driving up series count, so you can fix the right things early.
 You can:
- Track how the total number of series for a metric changes over time
- Break it down by label to spot high-cardinality keys
- Filter by team, service, environment, or metric
- See exactly when a label started to grow unexpectedly
If a deploy introduces a new label, or causes something like user_id or session_id to spike, you’ll catch it here. Now, you’ve just enough context to clean things up before they affect query latency or cost.
Streaming Aggregation for Label Control
With Streaming Aggregation, you can control cardinality before it becomes a problem. Instead of cleaning things up later, decide which labels to keep and which to drop, as metrics come in.
For example:
- Drop high-cardinality labels like
session_idthat aren’t used in queries - Keep only what matters, like
status_codeormethod - Apply the same logic across services, without reprocessing anything
All of this happens at ingestion. No reindexing. No patching old data. Once configured, it applies to every new metric that comes in.
With a default quota of 20M time series per metric, there’s room to work with high-cardinality data, without sacrificing performance or burning budget.
Now that we’ve covered how dimensionality and cardinality work together, the next piece will talk about how streaming aggregation makes high-cardinality data easier to handle—preserving detail while reducing query load and controlling costs.

