
Slow queries are the most common cause of database bottlenecks. A single unoptimized query hitting a large table can spike latency across your entire application, and the fix is rarely "add more hardware."
This guide covers the SQL optimization techniques that make the biggest difference in production, from reading execution plans to restructuring queries, with examples for PostgreSQL and MySQL.
What is SQL query optimization?
SQL query optimization is the process of rewriting queries and adjusting database configuration so they execute faster and use fewer resources. The most common fixes are adding indexes to columns in WHERE and JOIN clauses, selecting only needed columns instead of SELECT *, eliminating N+1 query patterns, and rewriting subqueries. Use EXPLAIN ANALYZE to see how the database executes your query before and after changes.
How the Database Executes Your Query
Before optimizing, you need to understand what the database actually does with your SQL. Every query goes through a planner (or optimizer) that decides how to retrieve the data. It chooses between sequential scans, index scans, join strategies, and sort methods based on table statistics.
The execution plan is your window into this process:
-- PostgreSQL
EXPLAIN ANALYZE SELECT * FROM orders WHERE customer_id = 12345;

-- MySQL
EXPLAIN SELECT * FROM orders WHERE customer_id = 12345;
Key things to look for in the plan:
- Seq Scan on a large table: likely needs an index
- Nested Loop with high row counts: consider a hash join or restructure the query
- Sort on unindexed columns: adding an index can eliminate the sort step entirely
- Rows estimate vs actual: if these differ by 10x+, table statistics are stale (run
ANALYZE)
The Biggest Wins: Where to Start
Not all optimizations are equal. These consistently deliver the largest improvements.
1. Add missing indexes
The single most impactful change. If your WHERE, JOIN, or ORDER BY references a column without an index, the database scans the full table every time.
-- Before: full table scan on 5M rows (800ms)
SELECT * FROM events WHERE user_id = 42 AND created_at > '2026-01-01';

-- Add a composite index
CREATE INDEX idx_events_user_date ON events (user_id, created_at);

-- After: index scan (2ms)
Column order in composite indexes matters. Put the equality column (user_id) first, then the range column (created_at). For a deeper look at index types and tradeoffs, see our database indexing guide.
2. Select only the columns you need
SELECT * forces the database to read and transfer every column, even if you only need three. On wide tables with 50+ columns or large text/blob fields, this is a measurable performance hit.
-- Slow: reads all 47 columns including a 2KB description field
SELECT * FROM products WHERE category_id = 5;

-- Fast: reads only what the application needs
SELECT id, name, price FROM products WHERE category_id = 5;
If all selected columns are covered by an index, the database can answer the query from the index alone (an "index-only scan") without touching the table.
3. Fix N+1 query patterns
The most common performance bug in application code. Instead of one query that fetches everything, the application fires one query per row:
-- N+1 pattern: 1 query + 100 queries
SELECT id FROM orders WHERE status = 'pending';  -- returns 100 rows
-- then for each order:
SELECT * FROM order_items WHERE order_id = ?;     -- 100 times

-- Fixed: one query with a JOIN
SELECT o.id, oi.*
FROM orders o
JOIN order_items oi ON oi.order_id = o.id
WHERE o.status = 'pending';
This goes from 101 round trips to 1. On a database with 2ms network latency, that alone saves 200ms.
4. Avoid functions on indexed columns
Wrapping an indexed column in a function prevents the database from using the index:
-- Bad: can't use index on created_at
SELECT * FROM orders WHERE YEAR(created_at) = 2026;

-- Good: rewrite as a range
SELECT * FROM orders
WHERE created_at >= '2026-01-01' AND created_at < '2027-01-01';
Same applies to LOWER(), CAST(), COALESCE(), and arithmetic on columns. Move the transformation to the constant side of the comparison when possible.
5. Use EXISTS instead of IN for subqueries
For correlated subqueries, EXISTS stops at the first match. IN materializes the entire subquery result:
-- Slower with large subquery results
SELECT * FROM customers
WHERE id IN (SELECT customer_id FROM orders WHERE total > 1000);

-- Faster: stops at first match per customer
SELECT * FROM customers c
WHERE EXISTS (
  SELECT 1 FROM orders o
  WHERE o.customer_id = c.id AND o.total > 1000
);
The difference grows with table size. On tables with millions of rows, EXISTS can be 10x faster.
Join Optimization
Joins are where queries get expensive. The database has to decide which table to read first, which join algorithm to use, and how to handle the intermediate results.
Choose the right join order
The database optimizer usually handles this, but you can help by filtering early:
-- Better: filter the smaller result set first with a CTE or subquery
SELECT o.id, o.total, c.name
FROM orders o
JOIN customers c ON c.id = o.customer_id
WHERE o.created_at > '2026-01-01'
  AND c.country = 'US';
Make sure both sides of the JOIN ON clause are indexed. A missing index on the join column turns every join into a nested loop with full scans.
Avoid joining on expressions
Like WHERE clauses, joins on expressions bypass indexes:
-- Bad: function on join column
SELECT * FROM a JOIN b ON LOWER(a.email) = LOWER(b.email);

-- Better: normalize data at write time, then join on the stored column
SELECT * FROM a JOIN b ON a.email_normalized = b.email_normalized;
Pagination Done Right
OFFSET pagination gets slower as the offset grows, because the database still reads and discards all skipped rows:
-- Page 1000: reads 10,000 rows, returns 10
SELECT * FROM events ORDER BY created_at DESC LIMIT 10 OFFSET 9990;

-- Keyset pagination: always fast regardless of "page number"
SELECT * FROM events
WHERE created_at < '2026-02-20T10:30:00Z'
ORDER BY created_at DESC
LIMIT 10;
Keyset (cursor-based) pagination uses the last seen value as the starting point. It performs consistently regardless of how deep into the result set you go.
Monitoring Query Performance
Fixing slow queries is only half the job. You need to catch new slow queries before they become incidents.
Slow query logs
Both PostgreSQL and MySQL can log queries exceeding a time threshold:
-- PostgreSQL: log queries over 200ms
ALTER SYSTEM SET log_min_duration_statement = 200;
SELECT pg_reload_conf();

-- MySQL: log queries over 200ms
SET GLOBAL long_query_time = 0.2;
SET GLOBAL slow_query_log = ON;
pg_stat_statements (PostgreSQL)
The most useful performance extension. It tracks execution statistics for every query pattern:
SELECT query, calls, mean_exec_time, total_exec_time
FROM pg_stat_statements
ORDER BY total_exec_time DESC
LIMIT 10;
This tells you which queries consume the most total database time, which is more actionable than just finding the single slowest query.
Ship your database metrics to an observability platform so you can correlate query performance with application-level latency. A query that is "fast enough" in isolation can still cause problems when called thousands of times per minute.
For a broader view of database performance beyond query optimization, see our database optimization guide.
See Every Database in Your Cloud from One Place
Most teams run five or six different databases across dev, staging, and production, and nobody has a single view of all of them. When a query starts timing out, the first question is always "which database is this hitting?" followed by "who owns that service?"
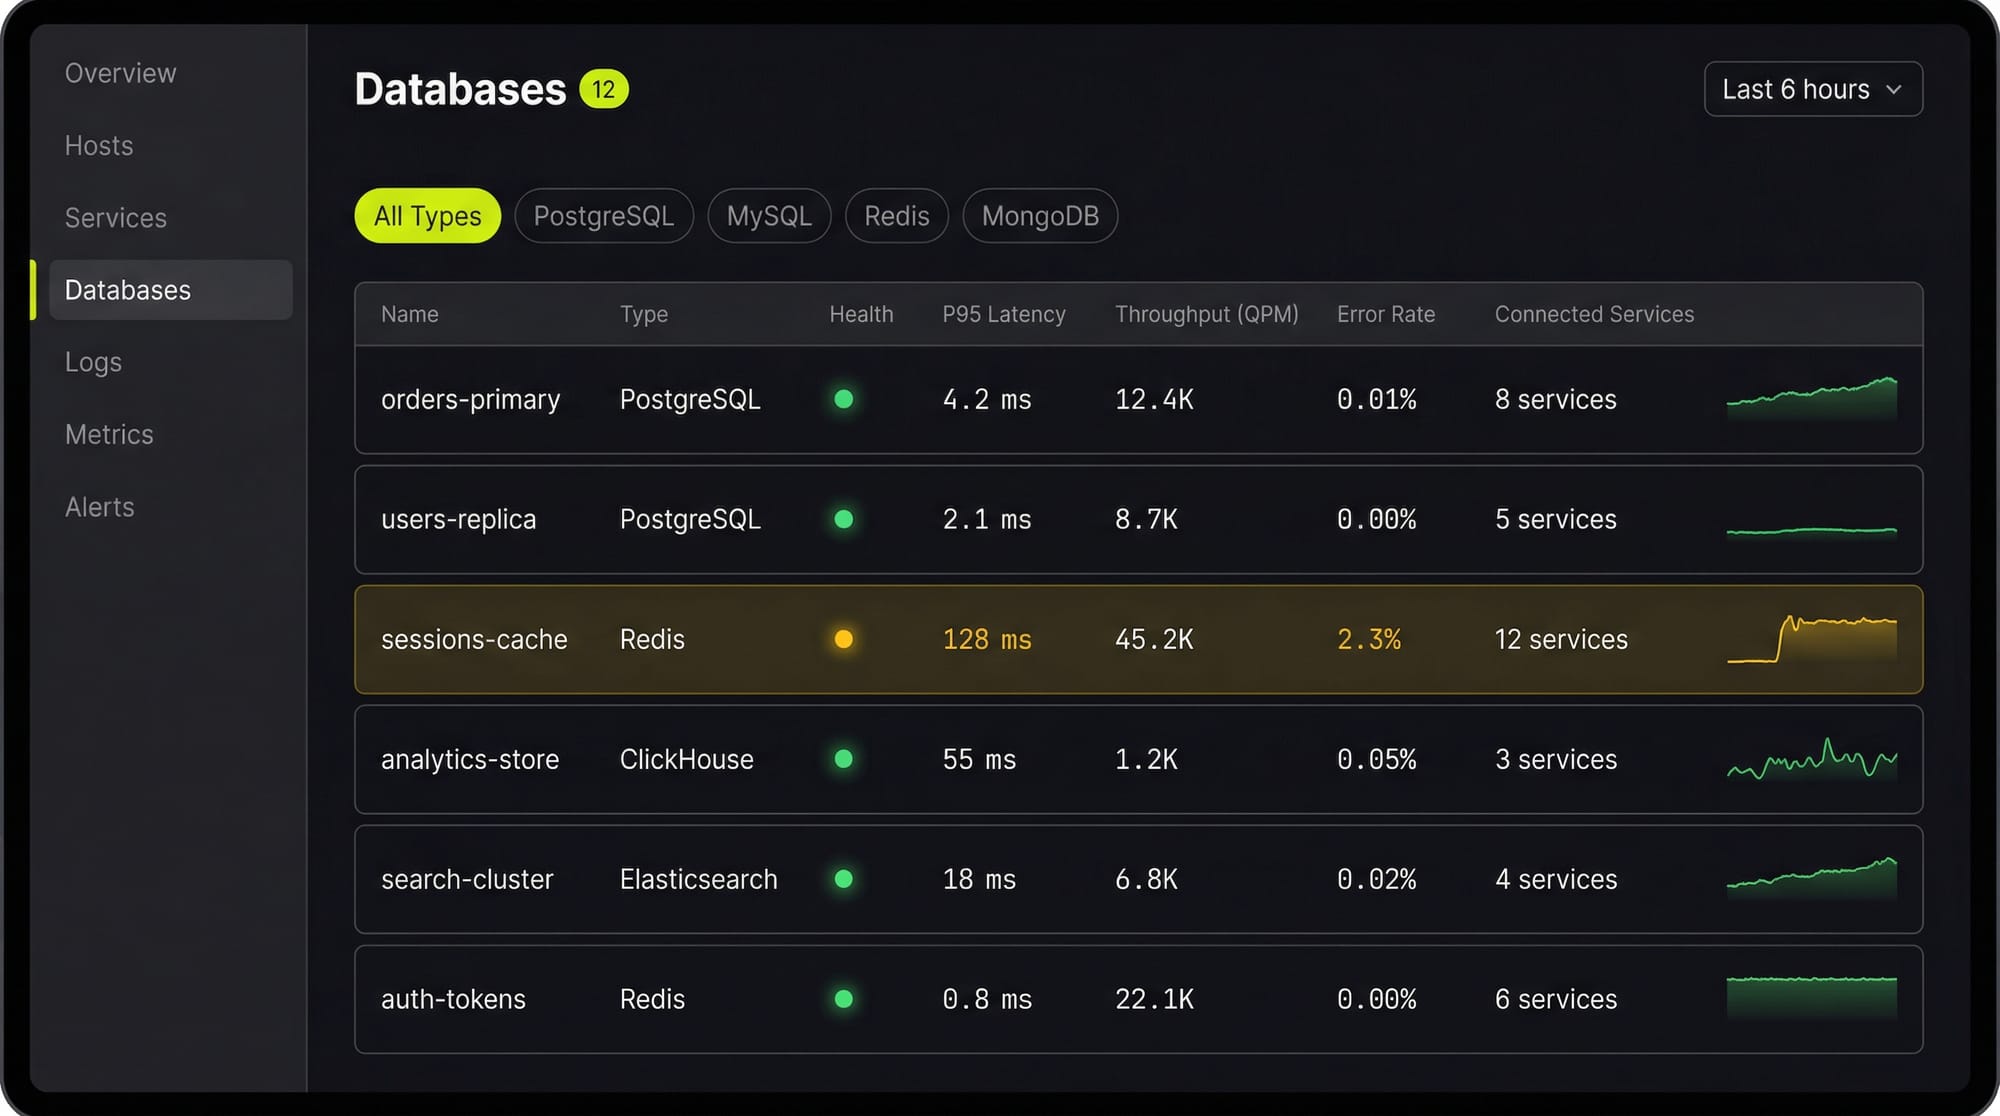
Last9's Discover Databases gives you that single view. It automatically detects every database in your cloud (PostgreSQL, MySQL, MongoDB, Redis, Elasticsearch, and more) and shows them alongside the services that talk to them and the infrastructure they run on. You get:
- Every database, one screen: No more hunting through AWS consoles, Kubernetes dashboards, and team wikis to figure out what databases exist and who owns them
- Service-to-database mapping: See which services call which databases, so when a database is slow you immediately know the blast radius
- Infrastructure context: CPU, memory, disk, and connection pool metrics for the underlying host or pod, right next to query performance
- Traces to queries: Click from a slow API endpoint trace directly into the database query that caused the latency
If you are tuning databases by hand and correlating metrics across three different tools, Discover Databases puts everything in one place so you can find the bottleneck in minutes instead of hours.
FAQs
How do I find slow queries in production?
Enable slow query logging (PostgreSQL: log_min_duration_statement, MySQL: slow_query_log) and use pg_stat_statements or performance_schema to find queries by total execution time. Sort by total time, not individual execution time, to find the queries with the most cumulative impact.
Should I use ORMs or raw SQL for performance?
ORMs are fine for most queries. The problems come from N+1 patterns, unnecessary eager loading, and ORMs generating suboptimal SQL for complex joins. Profile your actual queries in production rather than guessing. Use raw SQL for the hot paths where milliseconds matter.
How often should I run ANALYZE?
PostgreSQL's autovacuum handles this automatically for most tables. Run ANALYZE manually after bulk data loads, large deletes, or schema changes. Stale statistics cause the planner to make bad decisions (like choosing a sequential scan when an index scan would be faster).
What is query plan caching and when does it hurt?
PostgreSQL caches query plans for prepared statements. This is usually good, but if data distribution changes significantly (a table goes from 1K to 1M rows), the cached plan may be wrong. Use DISCARD ALL or reconnect to force re-planning. MySQL re-plans every query by default.
How do I optimize COUNT queries on large tables?
Exact COUNT(*) requires a full table scan in PostgreSQL (MVCC means each transaction sees different row visibility). For approximate counts, use SELECT reltuples FROM pg_class WHERE relname = 'your_table'. For exact counts that need to be fast, maintain a counter table updated via triggers.
Is DISTINCT always slow?
DISTINCT requires sorting or hashing all result rows to remove duplicates. It is slow on large result sets. Often you can eliminate DISTINCT by fixing the query (removing an accidental cartesian product from a bad join) rather than de-duplicating after the fact.
When should I denormalize?
When read performance matters more than write complexity, and you have measured the bottleneck. Common cases: storing aggregated counts, caching computed values, duplicating a frequently joined column. Always measure first. Premature denormalization creates data consistency bugs that are worse than the performance problem.
How do I optimize queries with LIKE patterns?
LIKE 'abc%' (prefix match) can use a B-tree index. LIKE '%abc%' (contains) cannot. For full-text search, use PostgreSQL's tsvector/tsquery or MySQL's FULLTEXT indexes instead of LIKE '%term%'.