Today at KubeCon North America 2024, we're announcing a major evolution of Last9. After helping companies like Disney+ Hotstar, Clevertap, and Replit handle high-cardinality metrics at scale, we've expanded our platform to include comprehensive support for logs and traces along with Control Plane.
Why This Matters
Last9 has been the go-to platform for companies dealing with massive-scale monitoring and has proven its capabilities in demanding scenarios:
- Processed millions of data points per second for Disney+ Hotstar's 55 million concurrent users
- Improved Replit's Grafana dashboard load times from minutes to seconds
- Currently handling 40TB of daily logs and traces for a customer, with 1TB rehydration in under 20 minutes
With Last9, we eliminated the toil. It just works.
— Matt Iselin, Head of SRE, Replit
Control Plane: Because Data Control Shouldn't Be an Afterthought

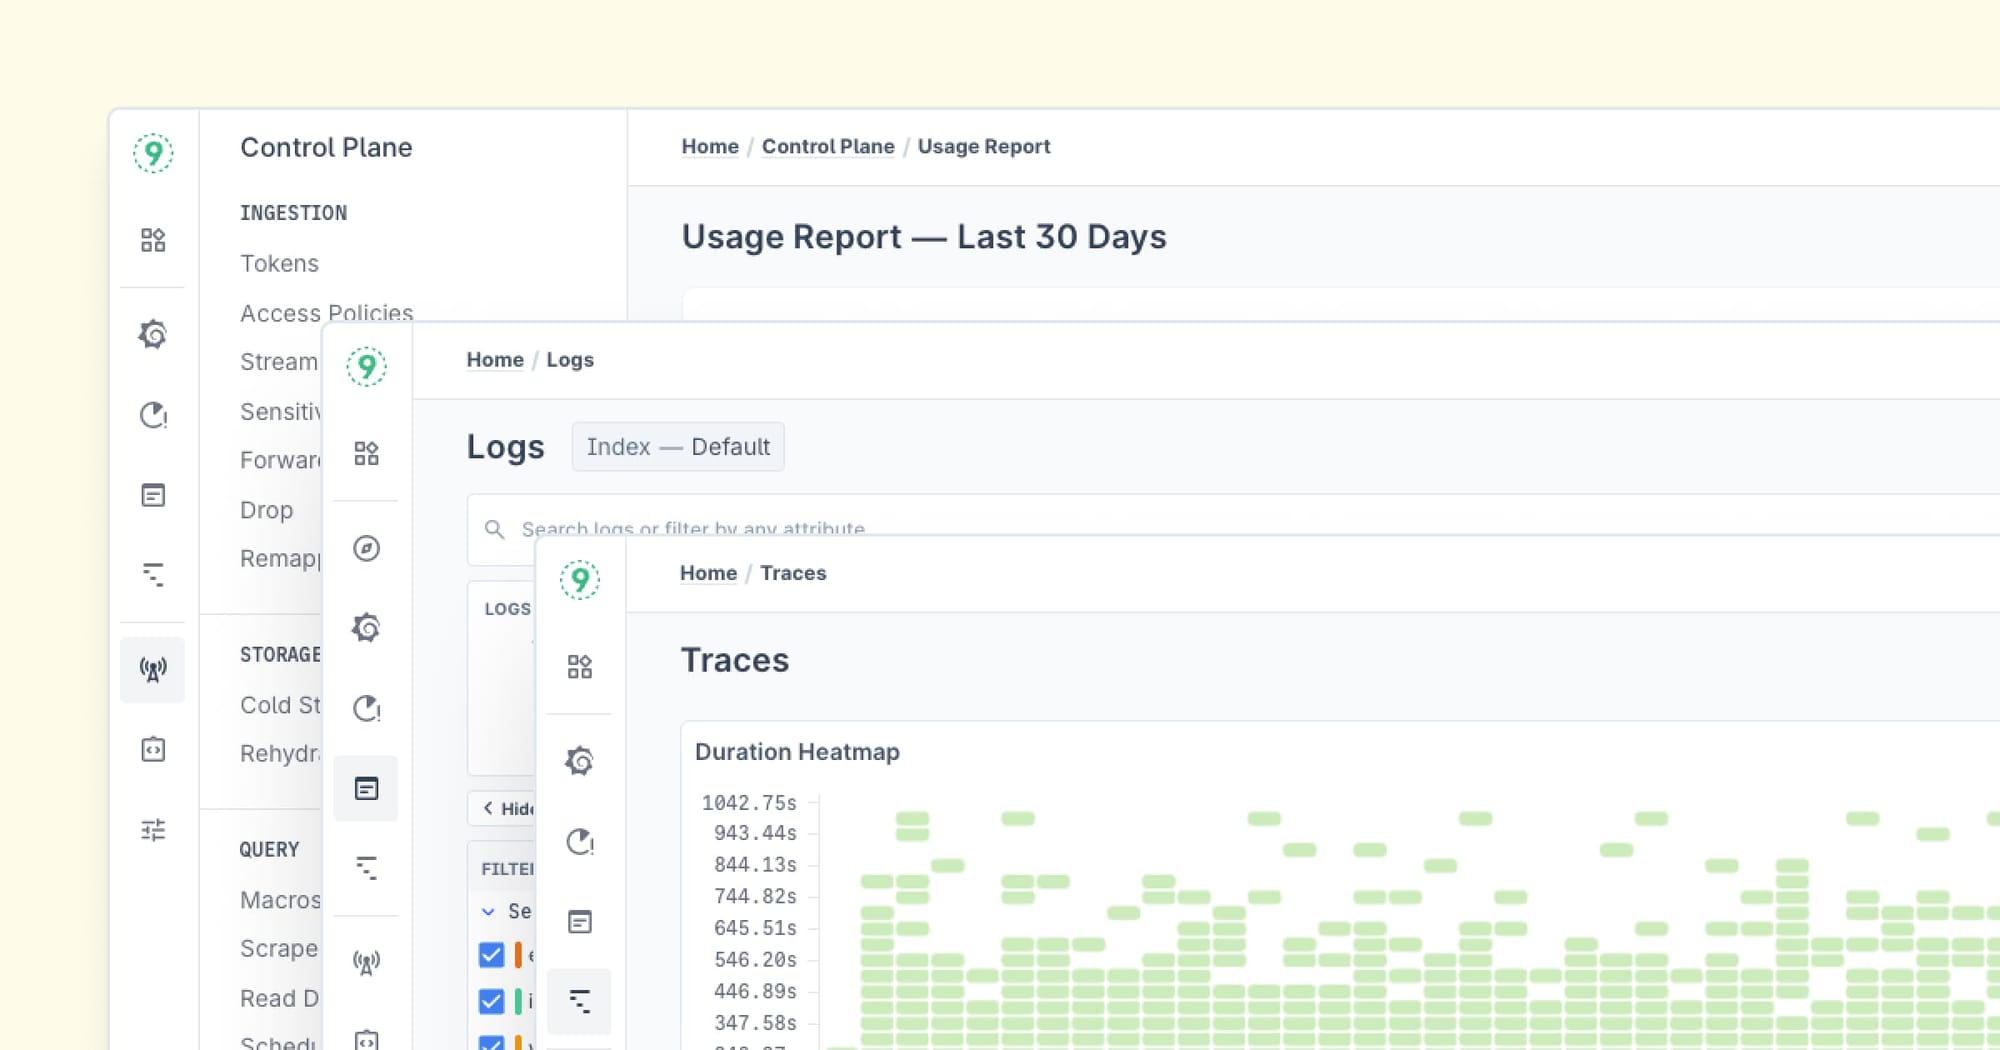
With no sampling of data by default, comes great power and responsibility. Our telemetry warehouse powers a comprehensive Control Plane that gives you power over your data:
- Pre-Ingestion Workflows for defining run-time for PII filtering, data enrichment, and forwarding or dropping unnecessary data
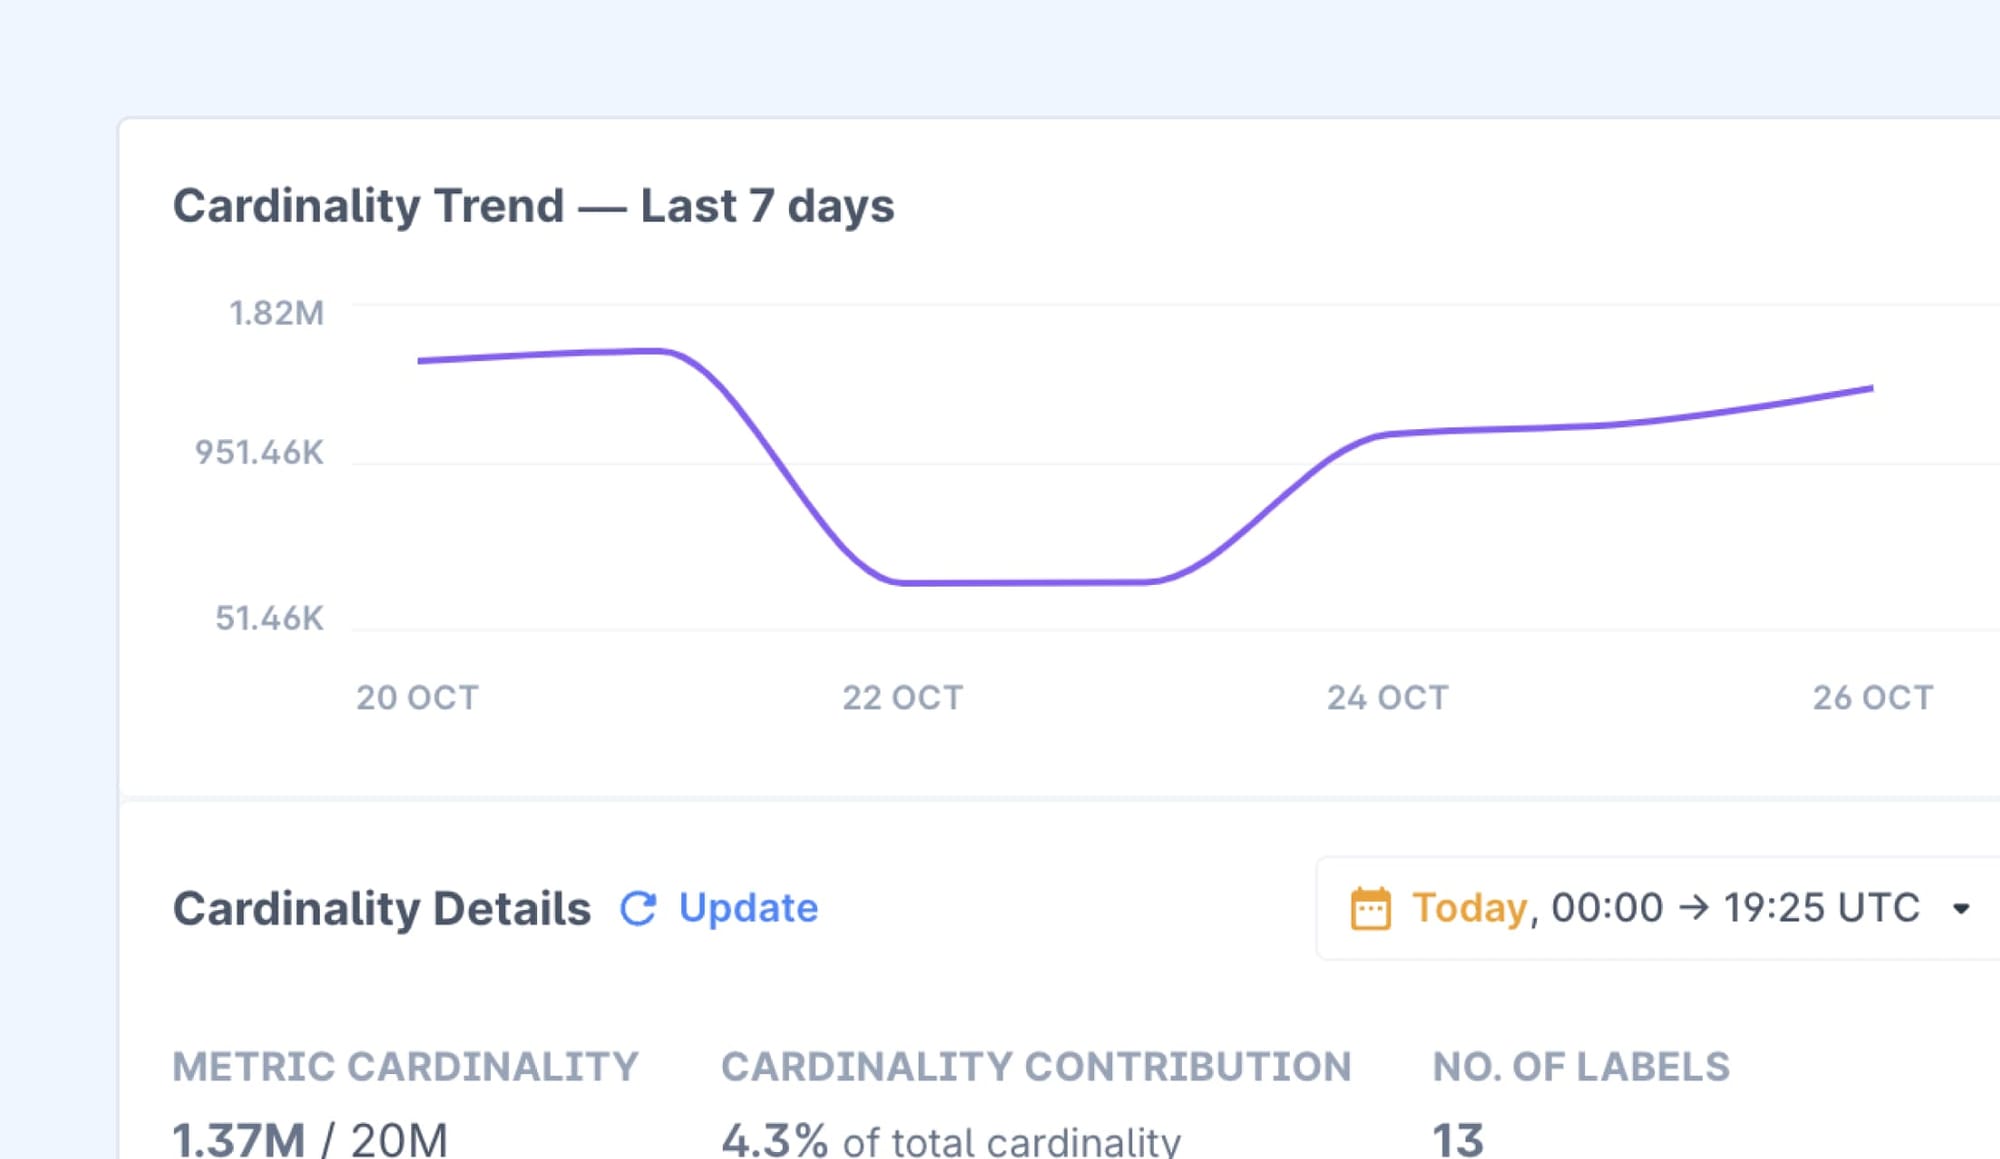
- Usage Management for tracking by telemetry type, teams, or services; and exploring high-cardinality telemetry and their impacted labels
- Governance with fine-grained access controls, and usage analytics & trends
Using Last9’s high cardinality workflows, we were able to accurately measure customer SLAs across dimensions, extract knowledge about our systems, and measure customer impact proactively.
— Ranjeet Walunj, SVP Engineering, CleverTap
Correlated Telemetry: Reduced MTTR, Better Productivity

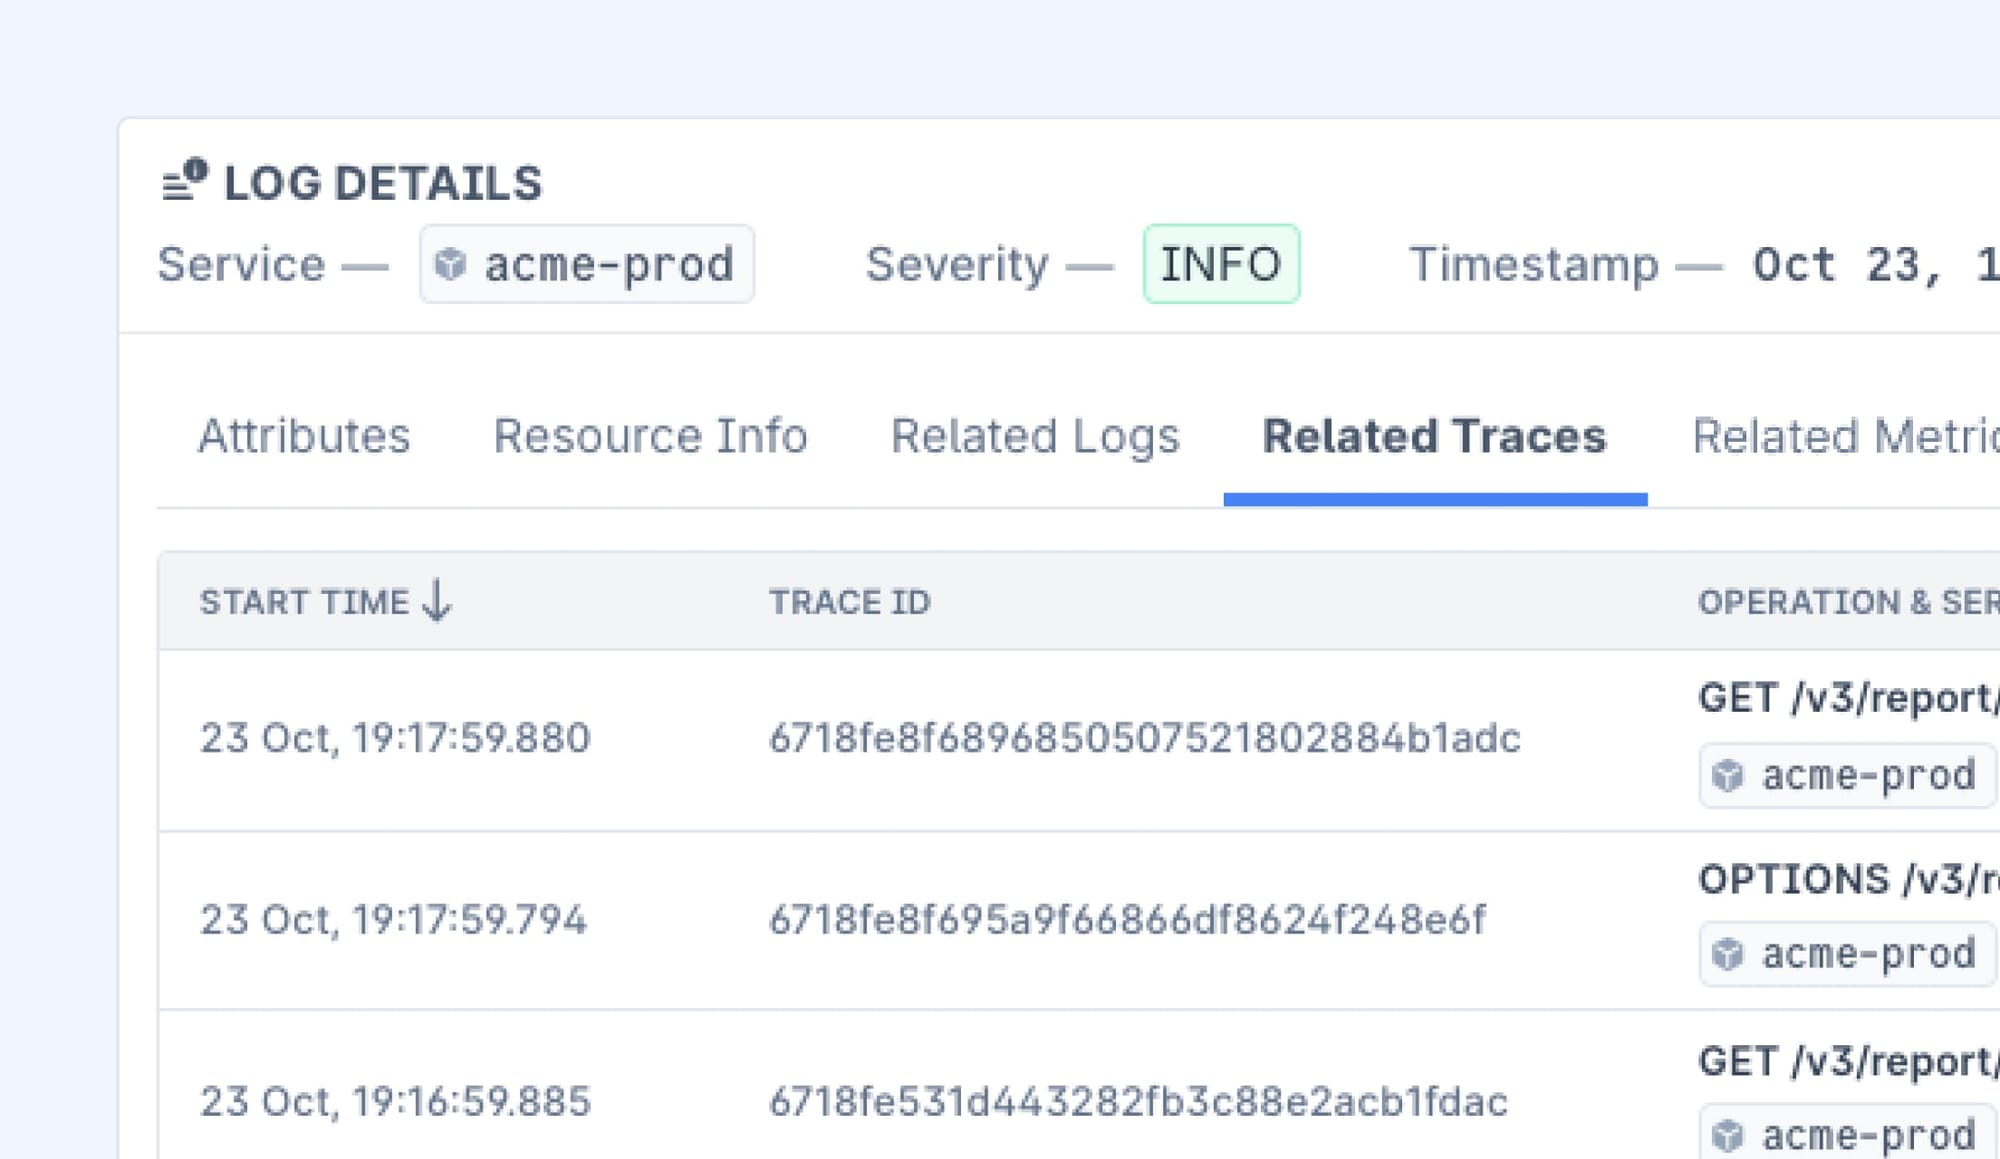
Our unified approach eliminates context-switching between tools by connecting logs, traces, and metrics, enabling rapid RCA and reduced MTTR.
Our native interface offers real-time monitoring with powerful search capabilities across millions of data points, service dependency visualization, and direct telemetry correlation. Teams preferring flexibility and options in tooling can also leverage our embedded Grafana dashboard with Loki and Tempo support for familiarity.
Last9 has been crucial for us. We’ve been able to find interesting bugs, that were not possible for us with New Relic.
— Shekhar Patil, Founder & CEO, Tacitbase
Out of the box OpenTelemetry-Native Observability, along with 100+ other sources
With recent developments around OpenTelemetry, more teams are looking to adopt OTel pipelines.
We're not just adding support for logs and traces — we're making Last9 completely OTel-native. This means, zero vendor lock-in, being future-proof as you evolve with the OTel ecosystem, and easy migration if you’re already using OTel.
We continue to support ingesting data from Prometheus, InfuxDB, Statsd, and many more.
See It in Action at KubeCon India 2024
If you're at KubeCon India 2024 Delhi, stop by Booth S6 — we'd love to show you these new capabilities in person. We'll be doing live demos throughout the conference, showing how Last9 handles real-world scenarios at scale.
Getting Started
For existing Last9 users, these new capabilities are available now in your dashboard. New to Last9? Schedule a demo or signup to see how unified observability can transform your operations.
We're excited to see how you'll use these new capabilities. As always, we're here to help you scale your observability with confidence.
What’s Next
We’ve just added support for a unified search experience across all your telemetry data along with the ability to use natural language instead of having to familiarize yourself with a query language for each type.
Remote agent configurations, Real User Monitoring, CPU Profiling, and Exception Tracking are up next to be released to our customers.


