If you’re here, it’s safe to say your monitoring setup is facing some growing pains. Scaling Prometheus isn’t exactly plug-and-play—especially if your Kubernetes clusters or microservices are multiplying like bunnies. The more your infrastructure expands, the more you need a monitoring solution to keep up without buckling under the pressure.
In this guide, we’ll talk about the whys and the hows of scaling Prometheus. We'll dig into the underlying concepts that make scaling Prometheus possible, plus the nuts-and-bolts strategies that make it work in the real world. Ready to level up your monitoring game?
Understanding Prometheus Architecture
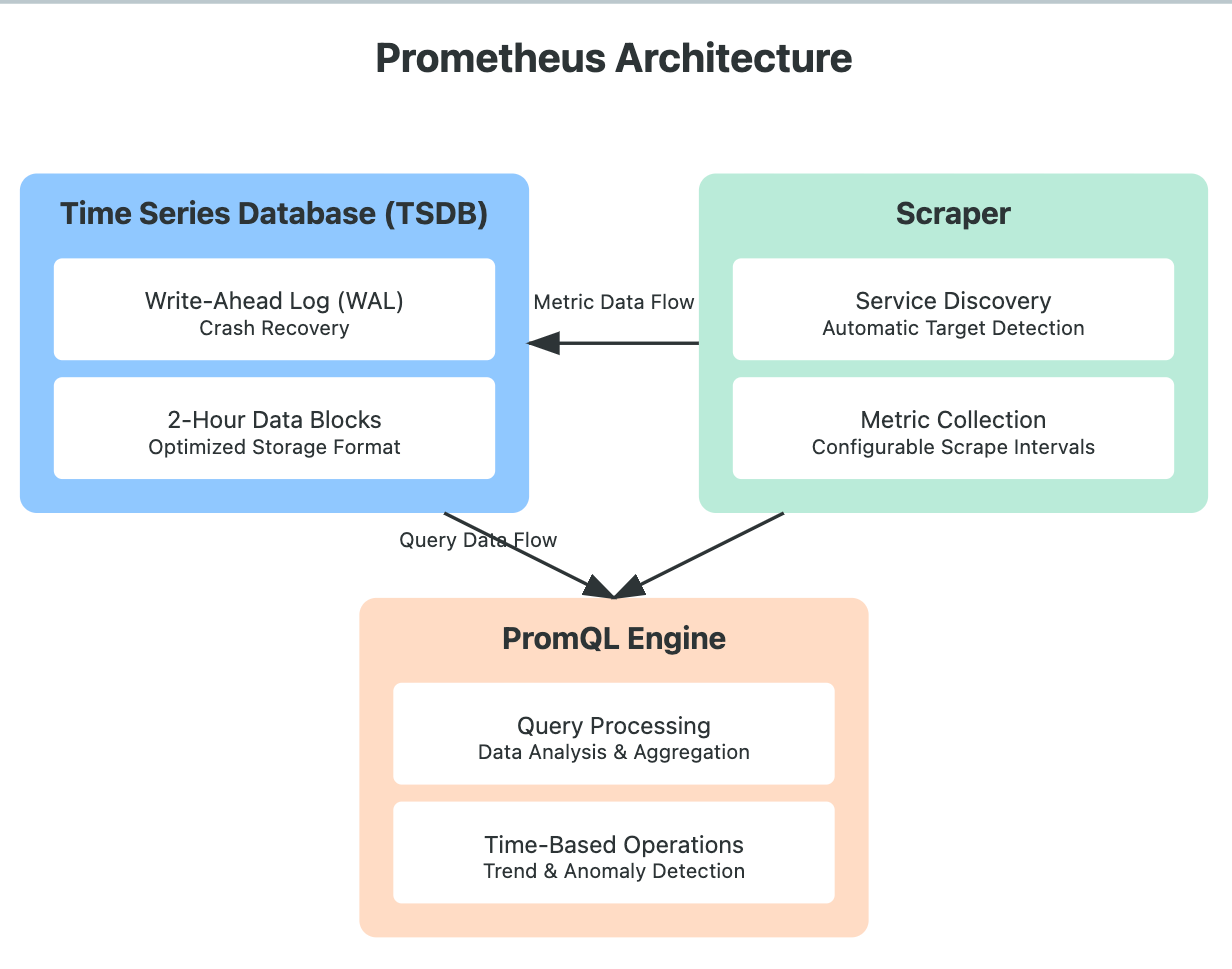
Before we jump into scaling Prometheus, let’s take a peek under the hood to see what makes it tick.

Core Components
- Time Series Database (TSDB)
- Data Storage: Prometheus’s TSDB isn’t your typical database—it’s designed specifically for handling time-series data. It stores metrics in a custom format optimized for quick access.
- Crash Recovery: It uses a Write-Ahead Log (WAL), which acts like a safety net, ensuring that your data stays intact even during unexpected crashes.
- Data Blocks: Instead of lumping all data together, TSDB organizes metrics in manageable, 2-hour blocks. This way, querying and processing data stay efficient, even as your data volume grows.
- Scraper
- Metric Collection: The scraper component is like Prometheus’s ears and eyes, continuously pulling metrics from predefined endpoints.
- Service Discovery: It handles automatic service discovery, so Prometheus always knows where to find new services without needing constant reconfiguration.
- Scrape Configurations: The scraper also lets you define scrape intervals and timeouts, tailoring how often data is collected based on your system’s needs.
- PromQL Engine
- Query Processing: The PromQL engine is where all your queries get processed, making sense of the data stored in TSDB.
- Aggregations & Transformations: It’s built for powerful data transformations and aggregations, making it possible to slice and dice metrics in almost any way you need.
- Time-Based Operations: PromQL’s time-based capabilities let you compare metrics over different periods—a must-have for spotting trends or anomalies.
The Pull Model Explained
Prometheus uses a pull model, meaning it actively scrapes metrics from your endpoints rather than waiting for metrics to be pushed. This model is perfect for controlled, precise monitoring. Here’s an example configuration:
scrape_configs:
  - job_name: 'node'
    static_configs:
      - targets: ['localhost:9100']
    scrape_interval: 15s
    scrape_timeout: 10s
    metrics_path: /metrics
    scheme: http
Benefits of the Pull Model:
- Control Over Failure Detection: Prometheus can detect if a target fails to respond, giving you insight into the health of your endpoints.
- Firewall Friendliness: It’s generally easier to allow one-way traffic for scrapes than to configure permissions for every component.
- Simple Testing: You can verify endpoint availability and scrape configurations without a lot of troubleshooting.
Scaling Strategies:
When Prometheus starts to feel the weight of growing data and queries, it’s time to explore scaling. Here are three foundational strategies:
1. Vertical Scaling
The simplest approach is to beef up your existing Prometheus instance with more memory, CPU, and storage.
Here’s a sample configuration for optimizing Prometheus’s performance:
global:
  scrape_interval: 15s
  evaluation_interval: 15s

storage:
  tsdb:
    retention:
      time: 15d
      size: 512GB
    wal-compression: true

exemplars:
  max-exemplars: 100000

query:
  max-samples: 50000000
  timeout: 2m
Key Considerations:
- Monitor TSDB Compaction: Regularly check TSDB compaction metrics, as they’re essential for data storage efficiency.
- Watch WAL Performance: Keep an eye on WAL metrics to ensure smooth crash recovery.
- Track Memory Usage: As data volume grows, memory demands will too—tracking this helps avoid resource issues.
2. Horizontal Scaling Through Federation
Federation allows you to create a multi-tiered Prometheus setup, which is a great way to scale while keeping monitoring organized. Here’s a basic configuration:
# Global Prometheus configuration
scrape_configs:
  - job_name: 'federate'
    scrape_interval: 15s
    honor_labels: true
    metrics_path: '/federate'
    params:
      'match[]':
        - '{job="node"}'
        - '{job="kubernetes-pods"}'
        - '{__name__=~"job:.*"}'
    static_configs:
      - targets:
          - 'prometheus-app:9090'
          - 'prometheus-infra:9090'

# Recording rules for federation
rules:
  - record: job:node_memory_utilization:avg
    expr: avg(node_memory_used_bytes / node_memory_total_bytes)
Advanced Scaling Solutions
When Prometheus alone isn’t enough, tools like Thanos and Cortex can extend their capabilities for long-term storage and high-demand environments.
Thanos Architecture and Implementation
Thanos adds long-term storage and global querying. Here’s a basic setup:
apiVersion: apps/v1
kind: Deployment
metadata:
  name: thanos-query
spec:
  replicas: 3
  template:
    spec:
      containers:
        - name: thanos-query
          image: quay.io/thanos/thanos:v0.24.0
          args:
            - 'query'
            - '--store=dnssrv+_grpc._tcp.thanos-store'
            - '--store=dnssrv+_grpc._tcp.thanos-sidecar'
Cortex for Cloud-Native Deployments
If you’re in a cloud-native environment, Cortex offers the following benefits:
- Dynamic Scaling: It can scale with your infrastructure automatically.
- Multi-Tenant Isolation: The Cortex is built for multi-tenancy, keeping each environment isolated.
- Cloud Storage Integration: Cortex connects seamlessly with cloud storage for long-term retention.
- Query Caching: It offers query caching to improve performance under heavy load.
Practical Performance Optimization
To keep Prometheus running smoothly, here are some optimization tips:
1. Query Optimization
Avoid complex or redundant PromQL queries that could slow down Prometheus. For example:
Before:
rate(http_requests_total[5m]) or rate(http_requests_total[5m] offset 5m)After:
rate(http_requests_total[5m])2. Recording Rules
For frequently-used, heavy queries, recording rules can lighten the load:
groups:
  - name: example
    rules:
      - record: job:http_inprogress_requests:sum
        expr: sum(http_inprogress_requests) by (job)
3. Label Management
Avoid high-cardinality labels, as they can create performance issues.
- Good Label Usage:
metric_name{service="payment", endpoint="/api/v1/pay"}
Monitoring Your Prometheus Instance
Keeping Prometheus itself healthy requires monitoring key metrics:
TSDB Metrics:
rate(prometheus_tsdb_head_samples_appended_total[5m])
prometheus_tsdb_head_series
Scrape Performance:
To monitor the performance of your scrape targets, use the following query to track the rate of scrapes that exceeded the sample limit:
rate(prometheus_target_scrapes_exceeded_sample_limit_total[5m])
prometheus_target_scrape_pool_targets
Query Performance:
To evaluate the performance of your queries, this query measures the rate of query execution duration:
rate(prometheus_engine_query_duration_seconds_count[5m])Troubleshooting Guide
Scaling can introduce new challenges, so here are some common issues and quick solutions to keep Prometheus running smoothly:
High Memory Usage
High memory consumption often points to high-cardinality metrics or inefficient queries. Here are some steps to diagnose and mitigate:
# Check series cardinality
curl -G http://localhost:9090/api/v1/status/tsdb

# Monitor memory usage in real-time
container_memory_usage_bytes{container="prometheus"}
Tip: Keep an eye on your metrics’ labels and reduce unnecessary ones. High-cardinality labels can quickly inflate memory use.
Slow Queries
If queries are slowing down, it’s time to check what’s running under the hood:
# Enable query logging for insights into problematic queries
--query.log-queries=true

# Monitor query performance to spot bottlenecks
rate(prometheus_engine_query_duration_seconds_sum[5m])
Tip: Implement recording rules to pre-compute frequently accessed metrics, reducing load on Prometheus when running complex queries.
Conclusion
Scaling Prometheus isn’t just about adding more power—it’s about understanding when and how to grow to fit your needs. With the right strategies, you’ll keep Prometheus performing well, no matter how your infrastructure grows.
FAQs
Can you scale Prometheus?
Yes! Prometheus can be scaled both vertically (by increasing resources on a single instance) and horizontally (through federation or by using solutions like Thanos or Cortex for distributed setups).
How well does Prometheus scale?
Prometheus scales effectively for most use cases, especially when combined with federation for hierarchical setups or long-term storage solutions like Thanos. However, it’s ideal for monitoring individual services and clusters rather than being a one-size-fits-all centralized solution.
What is Federated Prometheus?
Federated Prometheus refers to a setup where multiple Prometheus servers work in a hierarchical structure. Each “child” instance gathers data from a specific part of your infrastructure, and a “parent” Prometheus instance collects summaries, making it easier to manage large, distributed environments.
Is Prometheus pull or push?
Prometheus operates on a pull-based model, meaning it scrapes (pulls) metrics from endpoints at regular intervals, rather than having metrics pushed to it.
How can you orchestrate Prometheus?
You can orchestrate Prometheus on Kubernetes using custom resources like Prometheus Operator, which simplifies the deployment, configuration, and management of Prometheus and related services.
What is the default Prometheus configuration?
In its default configuration, Prometheus has a retention period of 15 days for time-series data, uses local storage, and scrapes metrics every 1 minute. However, these settings can be customized based on your needs.
What is the difference between Prometheus and Graphite?
Prometheus and Graphite both handle time-series data but have different design philosophies. Prometheus uses a pull model, has its query language (PromQL), and supports alerting natively, while Graphite uses a push model and relies on external tools for alerting and query functionalities.
How does Prometheus compare to Ganglia?
Prometheus is more modern and flexible than Ganglia, especially in dynamic, containerized environments. Prometheus offers better support for cloud-native systems, more powerful query capabilities, and better integration with Kubernetes.
What is the best way to integrate Prometheus with your organization's existing monitoring system?
Integrate Prometheus with existing systems using exporters, AlertManager for notifications, and tools like Grafana for visualizations. Additionally, consider using Federation or Thanos to bridge Prometheus data with other systems.
What are the benefits of Federated Prometheus?
Federated Prometheus offers scalable monitoring for large, distributed environments. It enables targeted scraping across multiple Prometheus instances, reduces data redundancy, and optimizes resource usage by dividing and conquering.


