
PromQL (Prometheus Query Language) is a powerful query language used by Prometheus, a popular open-source monitoring and alerting toolkit. This guide will introduce you to the basics of PromQL and help you get started with writing queries.
What is PromQL?
PromQL is a query language designed to work with time series data, allowing you to select and aggregate data in real time. It's used for both graphing and alerting in Prometheus.
Basic Concepts
1. Metrics: Named measurements collected at regular intervals
2. Labels: Key-value pairs that add dimensions to metrics
3. Samples: Individual data points consisting of a float64 value and a millisecond-precision timestamp
PromQL Structure
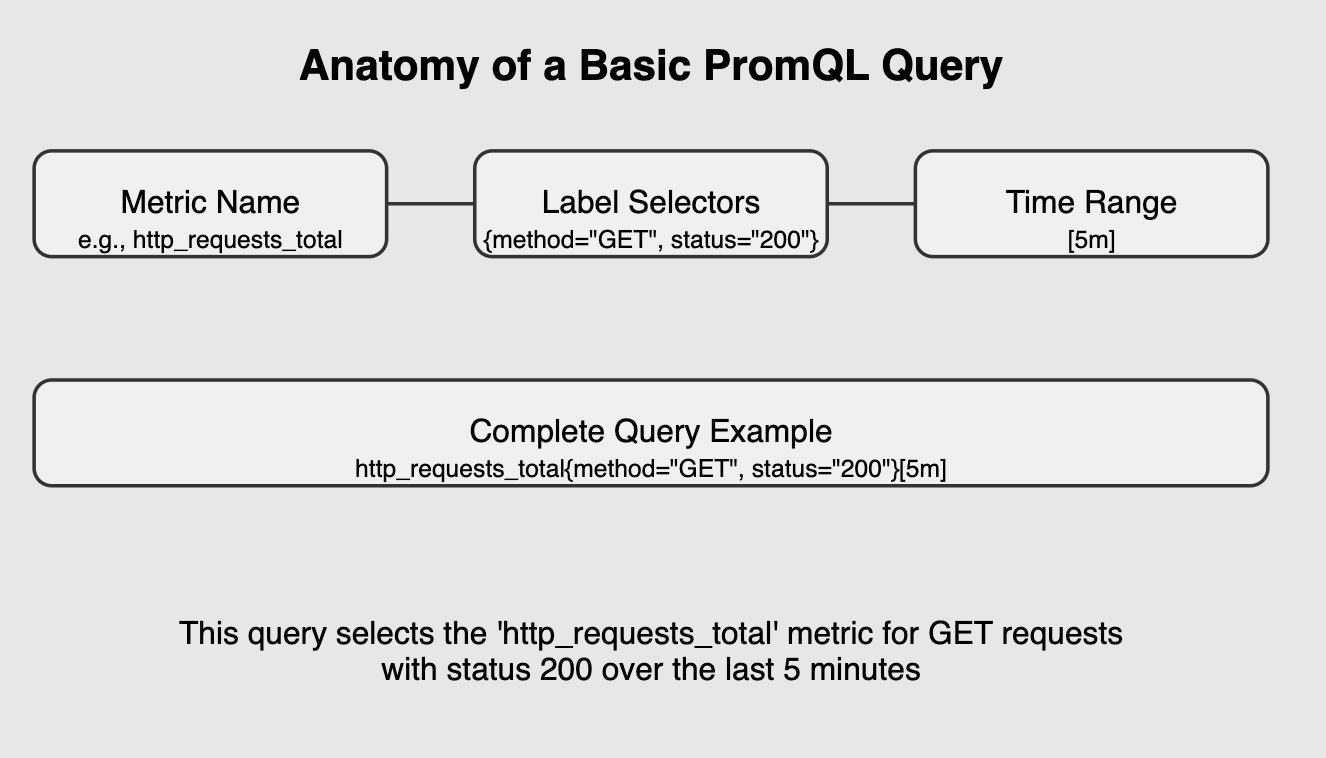
This image illustrates the three main components of a basic PromQL query:
Metric Name: This is the name of the metric you want to query, such as http_requests_total
Label Selectors: These allow you to filter the metric based on specific labels, like method="GET" and status="200"
Time Range This optional component specifies the time range for the query, such as [5m] for the last 5 minutes. In the example query:
http_requests_total{method="GET", status="200"}[5m]Simple Queries
The most basic PromQL query is just the name of a metric:
http_requests_totalBasic PromQL Query
This returns the current value of the `http_requests_total` metric for all monitored endpoints.
Label Matchers
You can filter metrics using label matchers:
http_requests_total{status="200", method="GET"}Filter a metric for GET endpoints and status 200
This query selects only the HTTP requests with a status code of 200 and a GET method.
Range Vectors
To query data over time, use range vectors:
http_requests_total[5m]This returns all values of `http_requests_total` over the last 5 minutes.
Basic Functions
PromQL provides various functions to work with data:
rate(): Calculate the per-second rate of increase
rate(http_requests_total[5m])sum(): Add up values
sum(http_requests_total)avg(): Calculate average
avg(node_cpu_utilization)This guide has introduced you to the basics of PromQL. As you become more comfortable with these concepts, you'll be able to write more complex queries to gain deeper insights into your systems.
Data Types in PromQL
Understanding the different data types in PromQL is crucial for writing effective queries and analyzing time series data. Prometheus, through PromQL, handles various data types that represent different kinds of metrics.
These data types allow you to perform calculations, aggregations, and more.
Here’s a breakdown of the key data types you’ll encounter when using PromQL:
1. Counter
Counters are metrics that can only increase over time (they may reset to zero on application restarts or other specific events).
They're commonly used to track things like the number of requests handled by a service or the number of bytes transmitted over a network.
Example Use Case:
- Tracking the total number of HTTP requests received by a web server.
PromQL Query Example:
rate(http_requests_total[5m])This query returns the rate of HTTP requests per second over the last 5 minutes.
2. Gauge
Gauges are metrics that can go up or down, allowing them to represent values that fluctuate over time, such as temperature, memory usage, or CPU load. A gauge can be used to track instantaneous values that aren't necessarily increasing.
Example Use Case:
- Monitoring system memory usage or CPU load.
PromQL Query Example:
avg(node_memory_MemAvailable_bytes[5m])This query gives the average available memory over the last 5 minutes.
3. Histogram
Histograms are metrics that track the distribution of data across different "buckets." They are used to record the frequency of occurrences of events in specified ranges, making them ideal for latency or duration measurements. Histograms are often used in Prometheus to capture request durations or response sizes.
Histograms consist of two components:
- Buckets: They represent ranges of values.
- Sum: The total sum of observed values.
- Count: The total number of observations.
Example Use Case:
- Measuring the distribution of request durations.
PromQL Query Example:
histogram_quantile(0.95, rate(http_request_duration_seconds_bucket[5m]))4. Summary
Summaries are similar to histograms but are optimized for tracking quantiles without storing the entire distribution of values. They are less storage-intensive than histograms but provide less flexibility in the types of queries you can run.
Summaries include:
- Sum: The total sum of observed values.
- Count: The number of observations.
- Quantiles: Pre-calculated quantiles, such as the 99th percentile.
Example Use Case:
- Tracking the response time percentiles for a service.
PromQL Query Example:
rate(http_request_duration_seconds_sum[5m]) / rate(http_request_duration_seconds_count[5m])This query computes the average request duration by dividing the sum by the count over the last 5 minutes.
5. Untyped
Untyped metrics are simply raw values without any specific semantics or categorization, often used for experimental or unclassified data. They are not common in typical Prometheus usage but may be seen in certain edge cases.
Example Use Case:
- Temporary or testing metrics that don't fit into other categories.
PromQL allows you to work with these different data types efficiently, making it possible to track everything from simple counters to more complex distributions with histograms and summaries.
Operators in PromQL
Operators are a fundamental part of PromQL and are used to manipulate time series data in various ways, whether for comparison, arithmetic, or logical operations. Here’s an overview of the key operators you'll use in PromQL:
1. Arithmetic Operators
Arithmetic operators allow you to perform mathematical operations on metrics, including addition, subtraction, multiplication, and division.
- Addition (
+): Adds two metrics or values. - Subtraction (
-): Subtracts one metric or value from another. - Multiplication (
*): Multiplies two metrics or values. - Division (
/): Divides one metric by another.
Example Use Case:
- Calculating the ratio of success to total HTTP requests.
PromQL Query Example:
sum(http_requests_total{status="200"}) / sum(http_requests_total)2. Comparison Operators
Comparison operators are used to compare two values or time series. These operators return a boolean result.
- Equal (
=): Checks if two metrics or values are equal. - Not Equal (
!=): Checks if two metrics or values are not equal. - Greater Than (
>): Checks if one metric is greater than another. - Greater Than or Equal (
>=): Checks if one metric is greater than or equal to another. - Less Than (
<): Checks if one metric is less than another. - Less Than or Equal (
<=): Checks if one metric is less than or equal to another.
Example Use Case:
- Identifying metrics where the CPU usage is greater than 80%.
PromQL Query Example:
node_cpu_seconds_total{mode="idle"} < 0.2This query selects the time series where the CPU idle time is less than 20%.
3. Logical Operators
Logical operators are used to combine multiple conditions or time series. They return a boolean result (true/false).
- AND (
and): Returns true if both conditions are true. - OR (
or): Returns true if either of the conditions is true. - Unless (
unless): Returns the left-hand operand unless the right-hand operand is true.
Example Use Case:
- Comparing two different metrics to see if one condition is true while another is false.
PromQL Query Example:
http_requests_total{status="200"} and http_requests_total{status="500"}This query returns results where both the HTTP request counts for status "200" and "500" are true.
4. Aggregation Operators
Aggregation operators allow you to combine multiple time series into a single value, typically by applying a function like sum, average, max, or count.
- sum(): Calculates the sum of values across time series.
- avg(): Calculates the average of values across time series.
- min(): Finds the minimum value across time series.
- max(): Finds the maximum value across time series.
- count(): Counts the number of time series.
Example Use Case:
- Aggregating data to see the total number of requests across multiple instances.
PromQL Query Example:
sum(http_requests_total) by (status)5. Offset Modifier
The offset modifier is used to shift the time range of a time series by a specified amount, useful for comparing data from different time periods.
Example Use Case:
- Comparing CPU usage from this week with CPU usage from last week.
PromQL Query Example:
rate(http_requests_total[5m]) - rate(http_requests_total[5m] offset 1w)This query shows the difference in HTTP requests between now and the same time last week.
6. Grouping Operators
Grouping operators are used to define how data is grouped when performing aggregation. Common grouping operators include:
- by(): Groups time series by specified labels.
- without(): Performs aggregation without considering certain labels.
Example Use Case:
- Grouping data by instance to see request counts for each individual instance.
PromQL Query Example:
sum(http_requests_total) by (instance)This query sums HTTP requests, grouped by instance.
7. Time Duration and Range Operators
These operators are used for specifying time ranges in PromQL queries.
- [duration]: This is used to specify a time window for calculating a function, like
rate(),avg_over_time(), etc.
Example Use Case:
- Calculating the rate of HTTP requests over the last 5 minutes.
PromQL Query Example:
rate(http_requests_total[5m])Applications of PromQL
PromQL isn’t just a query language – it’s a powerful tool that can help you monitor, troubleshoot, and optimize your systems with precision.
Here are some key applications of PromQL that make it an essential skill for any developer or operator working with Prometheus:
1. Real-Time Monitoring and Dashboards
PromQL allows you to craft custom queries that provide real-time insights into your system’s health.
Whether you're tracking HTTP request rates, CPU utilization, or memory usage, you can create dashboards that give you a clear picture of your infrastructure’s current state.
2. Trend Analysis and Forecasting
PromQL is ideal for spotting trends over time, enabling you to predict future behavior based on historical data.
For example, you can track how the memory usage of a node has evolved over the past week, or how the number of incoming HTTP requests has increased over the past month. This data-driven insight can be critical for capacity planning and understanding system performance as it scales.
3. Anomaly Detection
One of the most powerful uses of PromQL is anomaly detection. By using PromQL to compare current metrics to historical baselines, you can automatically detect when something is out of the ordinary.
For example, if the CPU usage of a service spikes beyond its usual range, PromQL can help identify this anomaly quickly, alerting you before it turns into a bigger issue.
4. Alerting and Incident Response
PromQL plays a key role in defining alerting rules in Prometheus. You can use it to set thresholds for various metrics, such as high response times or low available memory, and create alerts when those conditions are met.
These alerts can then trigger automated responses or notify your team, ensuring that issues are addressed before they escalate.
5. Resource Optimization and Cost Efficiency
With PromQL, you can identify which services are consuming the most resources, such as CPU or memory, and use this information to optimize your system’s performance.
For example, you might discover that a specific microservice is consuming more CPU than necessary and take action to optimize it, potentially reducing operational costs and improving overall system efficiency.
6. Capacity Planning
As systems grow, it’s important to ensure that infrastructure is sized appropriately. PromQL helps you track resource usage trends, allowing you to predict when your system might run out of capacity.
PromQL is an incredibly versatile tool, enabling you to not only understand what's happening in your system at any given time but also predict, prevent, and optimize for future performance.
Next Steps
- Experiment with different functions and operators
- Learn about aggregation and grouping
- Explore more advanced PromQL features like subqueries and offset modifiers.
FAQs
1. What is the basics of PromQL?
PromQL (Prometheus Query Language) is a powerful query language used for querying time-series data stored in Prometheus. It allows you to retrieve and manipulate metrics data, perform aggregations, apply filters, and compute time-series functions. PromQL is designed to give you flexible access to your metrics, enabling both simple and complex queries to monitor and analyze your systems.
2. What does =~ mean in PromQL?
In PromQL, =~ is the regular expression matching operator. It is used to match label values against a regular expression pattern. For example, if you want to match a status code label that starts with "5", you can use =~ like this:
http_requests_total{status=~"5.*"}This would match all status codes starting with 5, such as 500, 503, etc.
3. What type of databases does PromQL work with?
PromQL is specifically designed to work with Prometheus, a time-series database. Prometheus stores and queries time-series data (metrics), but PromQL is not used with traditional relational databases like MySQL or PostgreSQL. It's tailored for Prometheus to handle time-series data generated from applications, systems, and infrastructure.
4. What language does Prometheus use?
Prometheus uses PromQL (Prometheus Query Language) to query time-series data. PromQL allows you to perform powerful and flexible queries to extract metrics, apply aggregation functions, and manipulate time-series data stored in Prometheus.
5. What are Selectors in Prometheus?
Selectors in Prometheus are used to specify the subset of time-series data you want to query. There are two types:
- Metric selectors: Used to select the metric (e.g.,
http_requests_total). - Label selectors: Used to filter time series based on specific label values (e.g.,
status="200"). Together, they help you narrow down and work with specific data.
6. Are you ready to level up your DevOps skills with PromQL?
PromQL can significantly enhance your DevOps skillset by enabling you to efficiently query and monitor your system metrics. By mastering PromQL, you'll be able to troubleshoot, optimize performance, and gain insights into your infrastructure and applications.
7. Where can you use PromQL?
You can use PromQL within Prometheus, which is commonly deployed for monitoring cloud-native environments, containers, and microservices architectures. It’s used to query metrics, set up alerts, and integrate with visualization tools like Grafana.
8. How to select time series for devices starting with eth?
To select time series for devices starting with "eth" (typically network interfaces like eth0, eth1), you can use regular expressions in PromQL:
up{instance=~"eth.*"}This query selects all time series where the instance label matches any string that starts with "eth".
9. What is Grafana?
Grafana is an open-source visualization and monitoring tool used to visualize time-series data, including data from Prometheus. It integrates with Prometheus and other data sources, allowing you to create dashboards, graphs, and alerts to monitor the health and performance of your systems.
10. How can I query a histogram?
To query a histogram in PromQL, you typically work with the bucket and count metrics associated with histograms. For example, to get the count of requests in a specific bucket, you can use:
histogram_quantile(0.95, rate(http_request_duration_seconds_bucket[5m]))This query calculates the 95th percentile of the http_request_duration_seconds histogram over the last 5 minutes.
11. How do I get started with a PromQL tutorial for beginners?
To get started with PromQL as a beginner, it's helpful to follow a structured tutorial. A good starting point is:
- Familiarizing yourself with Prometheus and how to collect and store metrics.
- Learning the basics of PromQL, including how to query metrics, use aggregation functions, and filter data.
- Experimenting with queries using a tool like Grafana to visualize the data.
There are many tutorials and resources available on the official Prometheus website and community forums.
12. How do I start learning PromQL for beginners?
Start by learning the fundamentals of Prometheus and how it stores time-series data. Once you’re familiar with that, focus on understanding basic PromQL concepts like:
- Metric selection and label filtering.
- Using basic operators like
=,!=, and=~. - Aggregation functions like
sum(),avg(), andrate().
After grasping the basics, practice writing queries on a live Prometheus instance or in Grafana.
13. How do I write my first PromQL query?
To write your first PromQL query:
- Choose a metric to query, such as
http_requests_total. - Start with a simple query to retrieve the metric:
http_requests_total- Refine your query by filtering on labels. For example:
http_requests_total{status="200"}14. How do I write my first query in PromQL?
Your first PromQL query should retrieve basic metrics from your Prometheus database. Start with a simple query like:
upThis will return a list of time series for the up metric, which indicates whether a target is alive. You can then refine it with additional filters to select specific metrics or conditions, like:
up{job="api"}