
PromCon is the go-to event for Prometheus and observability enthusiasts, and this year, it’s happening in Berlin. It’s where top experts in monitoring and metrics gather to discuss the latest breakthroughs, share practical knowledge, and explore future trends.
On the first day, we saw the release of Prometheus 3.0.0 beta live on stage. The Prometheus team shared updates on OpenTelemetry metrics support in Prometheus. It was encouraging to see wider adoption for OpenTelemetry and a lot of efforts to make Prometheus a de-facto backend for OpenTelemetry metrics. The other talks also revolved around cost optimizations, resource optimizations, and practical experiences of people running monitoring at scale.
Here are some key takeaways, ideas, and highlights from Day 1 of PromCon 2024!
Prometheus 3.0 Overview – Jan Fajerski
Jan kicked off the conference with exciting news: the beta release of Prometheus 3.0. This version brings notable updates, including improved OpenTelemetry (OTEL) compatibility to streamline integration with other observability tools and a new. This was a whirlwind summary of the last year of progress made by the Prometheus team on making Prometheus the backend for OpenTelemetry Metrics.
A Look at the New Prometheus 3.0 UI by Julius Volz.
Jan also discussed the proposed governing model for the Prometheus project and how the team is making the project more inclusive by encouraging more contributors.
Practical OpenTelemetry with Prometheus 3.0 – Arve Knudsen and Jesus Vazquez
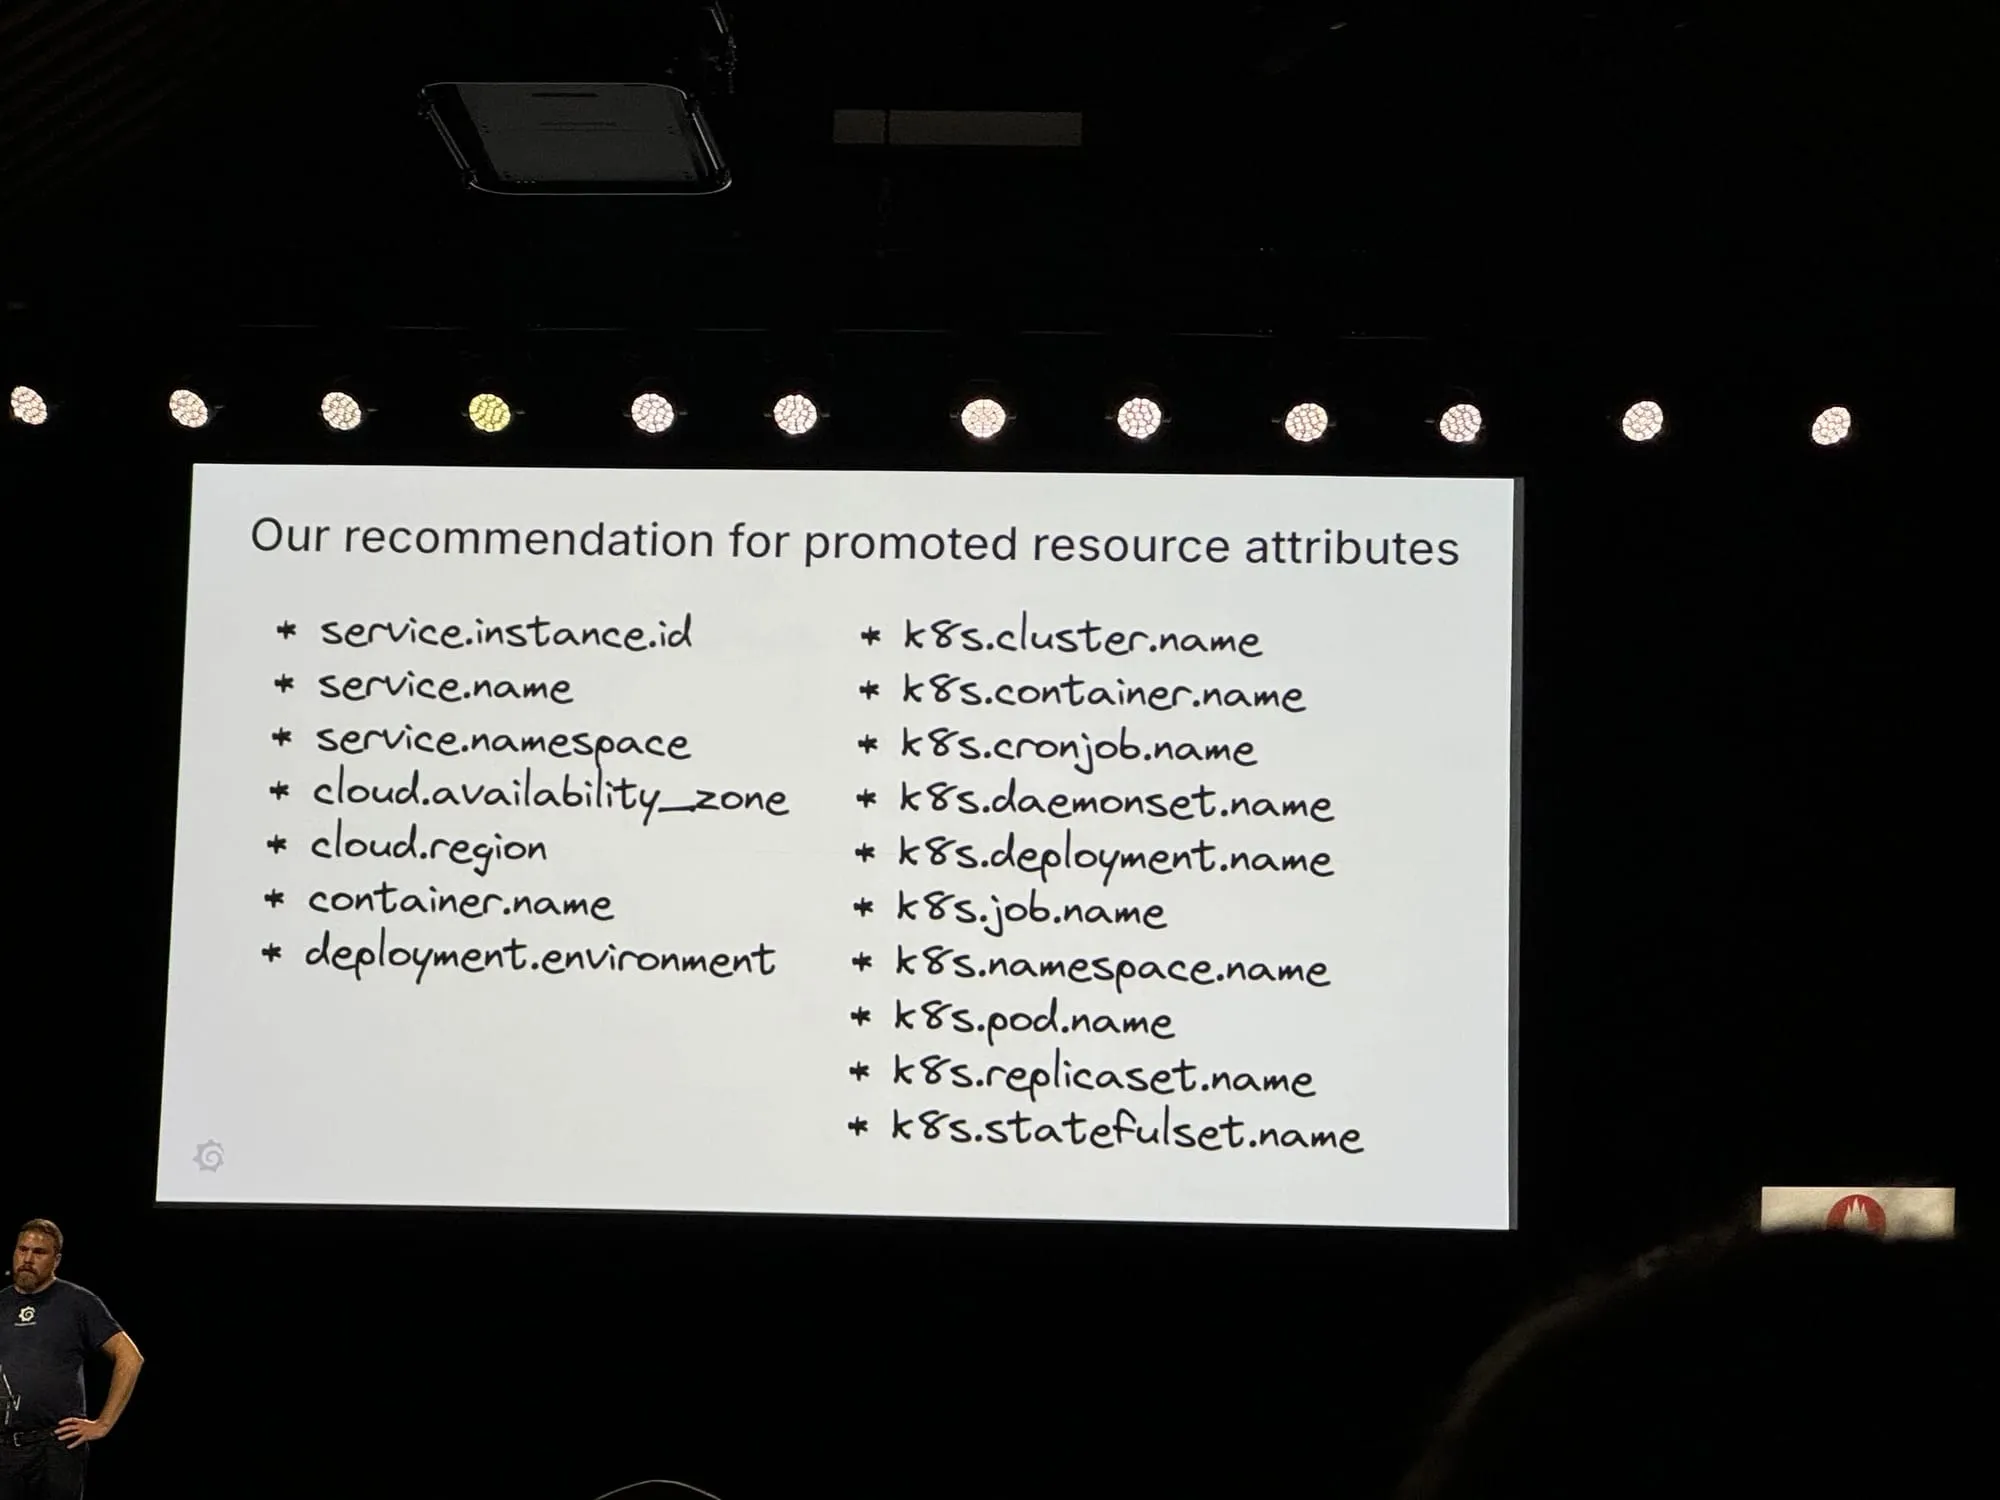
Arve and Jesus went into detail about the changes in Prometheus 3.0 that were made for OpenTelemetry compatibility.
A few notable changes caught my eye including the ability to promote select resource attributes as dimensions. There is a separate proposal to make Prometheus metadata store resource attributes which is under review.
The new info function, making life easier for performing joins with resource attributes.
Without the info function to include target_info labels (Prometheus’ encoding of OTel resource attributes), you have to write a join query like the following:
sum by (k8s_cluster_name, http_status_code) ( rate(http_server_request_duration_seconds_count[2m]) * on (job, instance) group_left (k8s_cluster_name) target_info)With the info function, you can instead of the above write:
sum by (k8s_cluster_name, http_status_code) ( info( rate(http_server_request_duration_seconds_count[2m]), {k8s_cluster_name=~".+"} ))This is not yet part of the 3.0.0 beta; the pull request can be found here.
There is no support for delta temporality in Prometheus 3.0 yet. Instead, the delta-to-cumulative processor was highlighted to handle delta temporality to cumulative temporality.
The OpenTelemetry ingestion in Prometheus is now considered stable. A guide for OpenTelemetry integration with Prometheus is also available.
Overall, the Prometheus team has worked very hard on Otel Compatibility, and they are still working on making the support for OpenTelemetry even more seamless in coming releases.
Unlocking Cost Savings & New Possibilities: Your Guide to Prometheus Remote Write 2.0 – Alex Greenbank and Bartłomiej Płotka
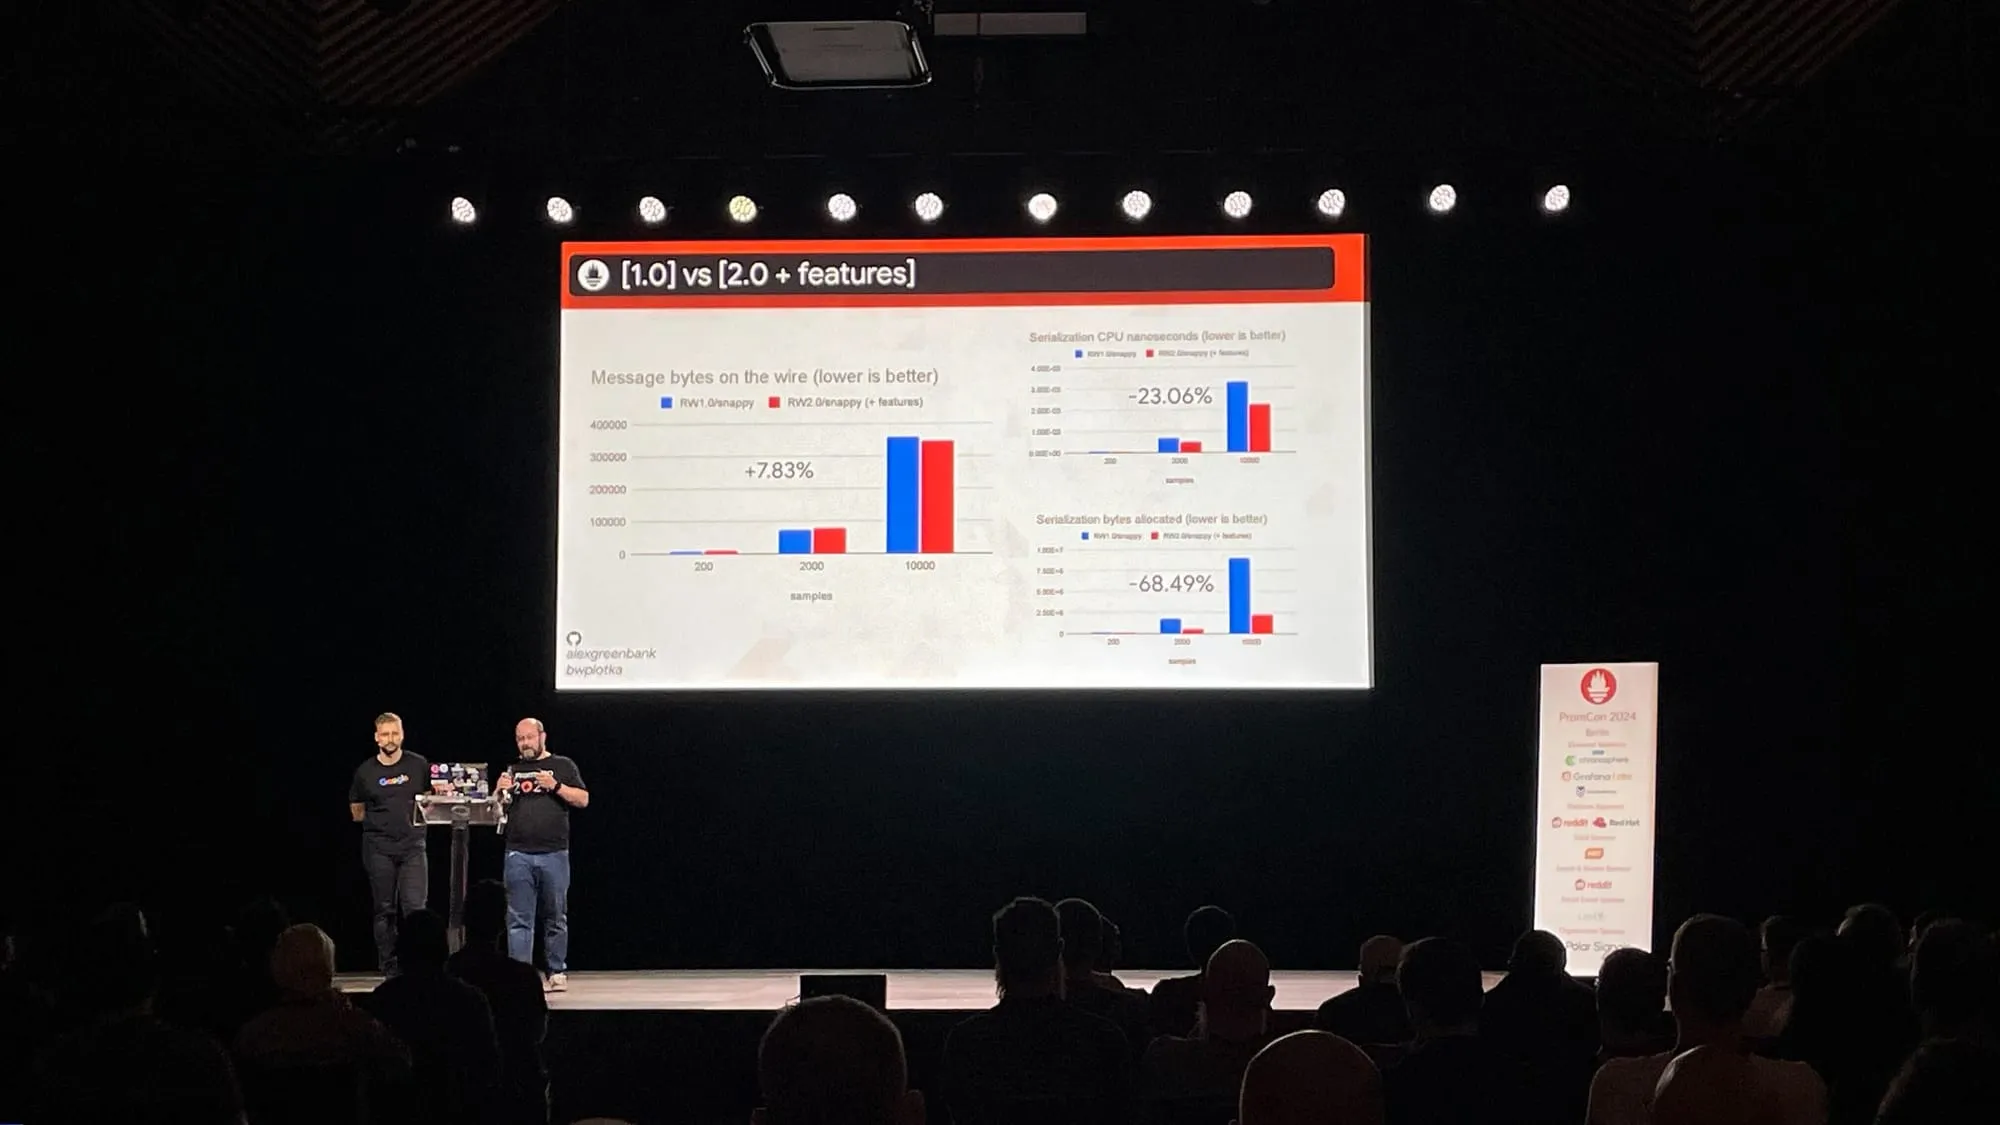
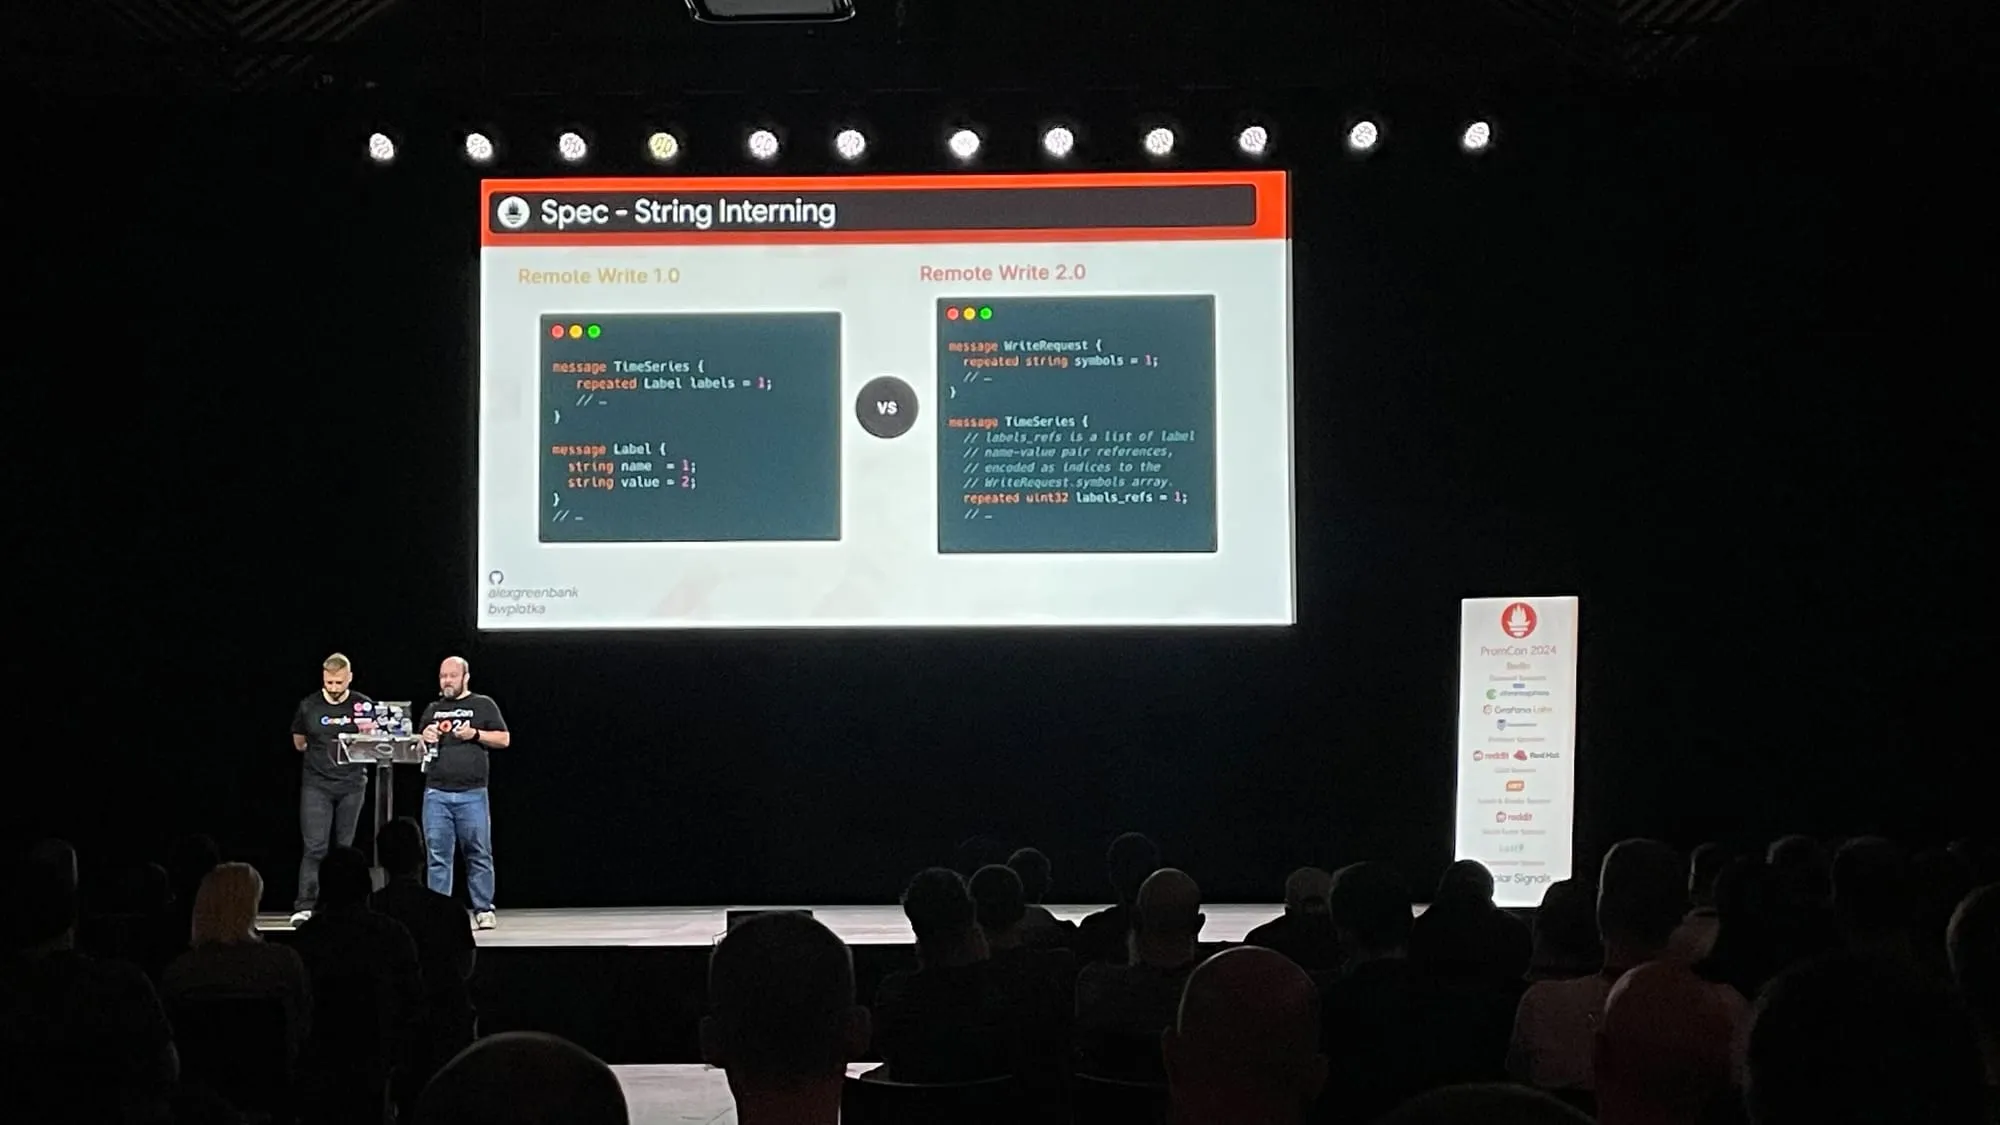
A standout session covered the Remote Write 2.0 update, focusing on reducing resource usage. This improvement aims to make systems more efficient, potentially lowering operational costs and boosting performance.
The new remote write protocol supports partial writes, native histograms, Created Timestamp, Exemplars, and UTF-8 support.Additionally, it supports metadata to be written to WAL, almost always-on mode.
The team has taken great efforts in making sure performance efficiency is maintained while developing the new protocol version and this can be game changer for long term storage of metrics.
Refer to the slides to know more about Prometheus Remote Write 2.0
There were lot of other interesting talks which I could not attend completely but you should check out once videos are out.
Why Not Just Dots? UTF-8 Support in Prometheus 3.0 – Owen Williams
This talk gave an overview of the design and implementation of UTF-8 support for metric and label names in Prometheus. This is important again from an OpenTelemetry integration perspective as Otel supports dots in metrics names.
Applying GitOps Principles for Central Alert Management – Juraj Michálek and Pradeep Lalwani
This was an interesting talk that discussed how to store and review alerts for Prometheus and compatible backends such as Mimir, Thanos, and Cortex. This is a very important automation aspect, considering the reliance of engineering teams on Gitops and the elasticity of components on which alerting is set.
Shopify’s Journey from Conventional to Native Histograms – Sebastian Rabenhorst and Pedro Tanaka
This was a great story about how Shopify migrated from conventional histograms to native histograms in its monitoring setup. The Shopify team uses a Thanos-based solution for monitoring clusters, and the talk also delved into adding more support for native histograms in Thanos.
”Gluing It All Together” aka Building a Platform Around Prometheus – Martin Chodur
Martin talked about building the monitoring platform from the basic blocks to cater to over 500 developers in tens of teams running apps in more than 150 k8s clusters so they “don’t have to care”.
Agile Monitoring At Scale With Thanos – Mihail Mihaylov
Mihail discussed how he had to align monitoring strategies within his organization with changing priorities, cost pressure, and team dynamics to build a monitoring platform at scale with Thanos.
Aggregating Metrics In-Flight: Challenges and Opportunities – Roman Khavronenko
Roman discussed pre-aggregating metrics before they are stored, his experience with this feature in VictoriaMetrics, and the challenges he encountered.
Find the slides from Roman’s talk here.
Trivia Quiz
Goutham Veeramachaneni and Matthias Loibl made the day fun with a trivia quiz, testing attendees’ knowledge in a relaxed setting.
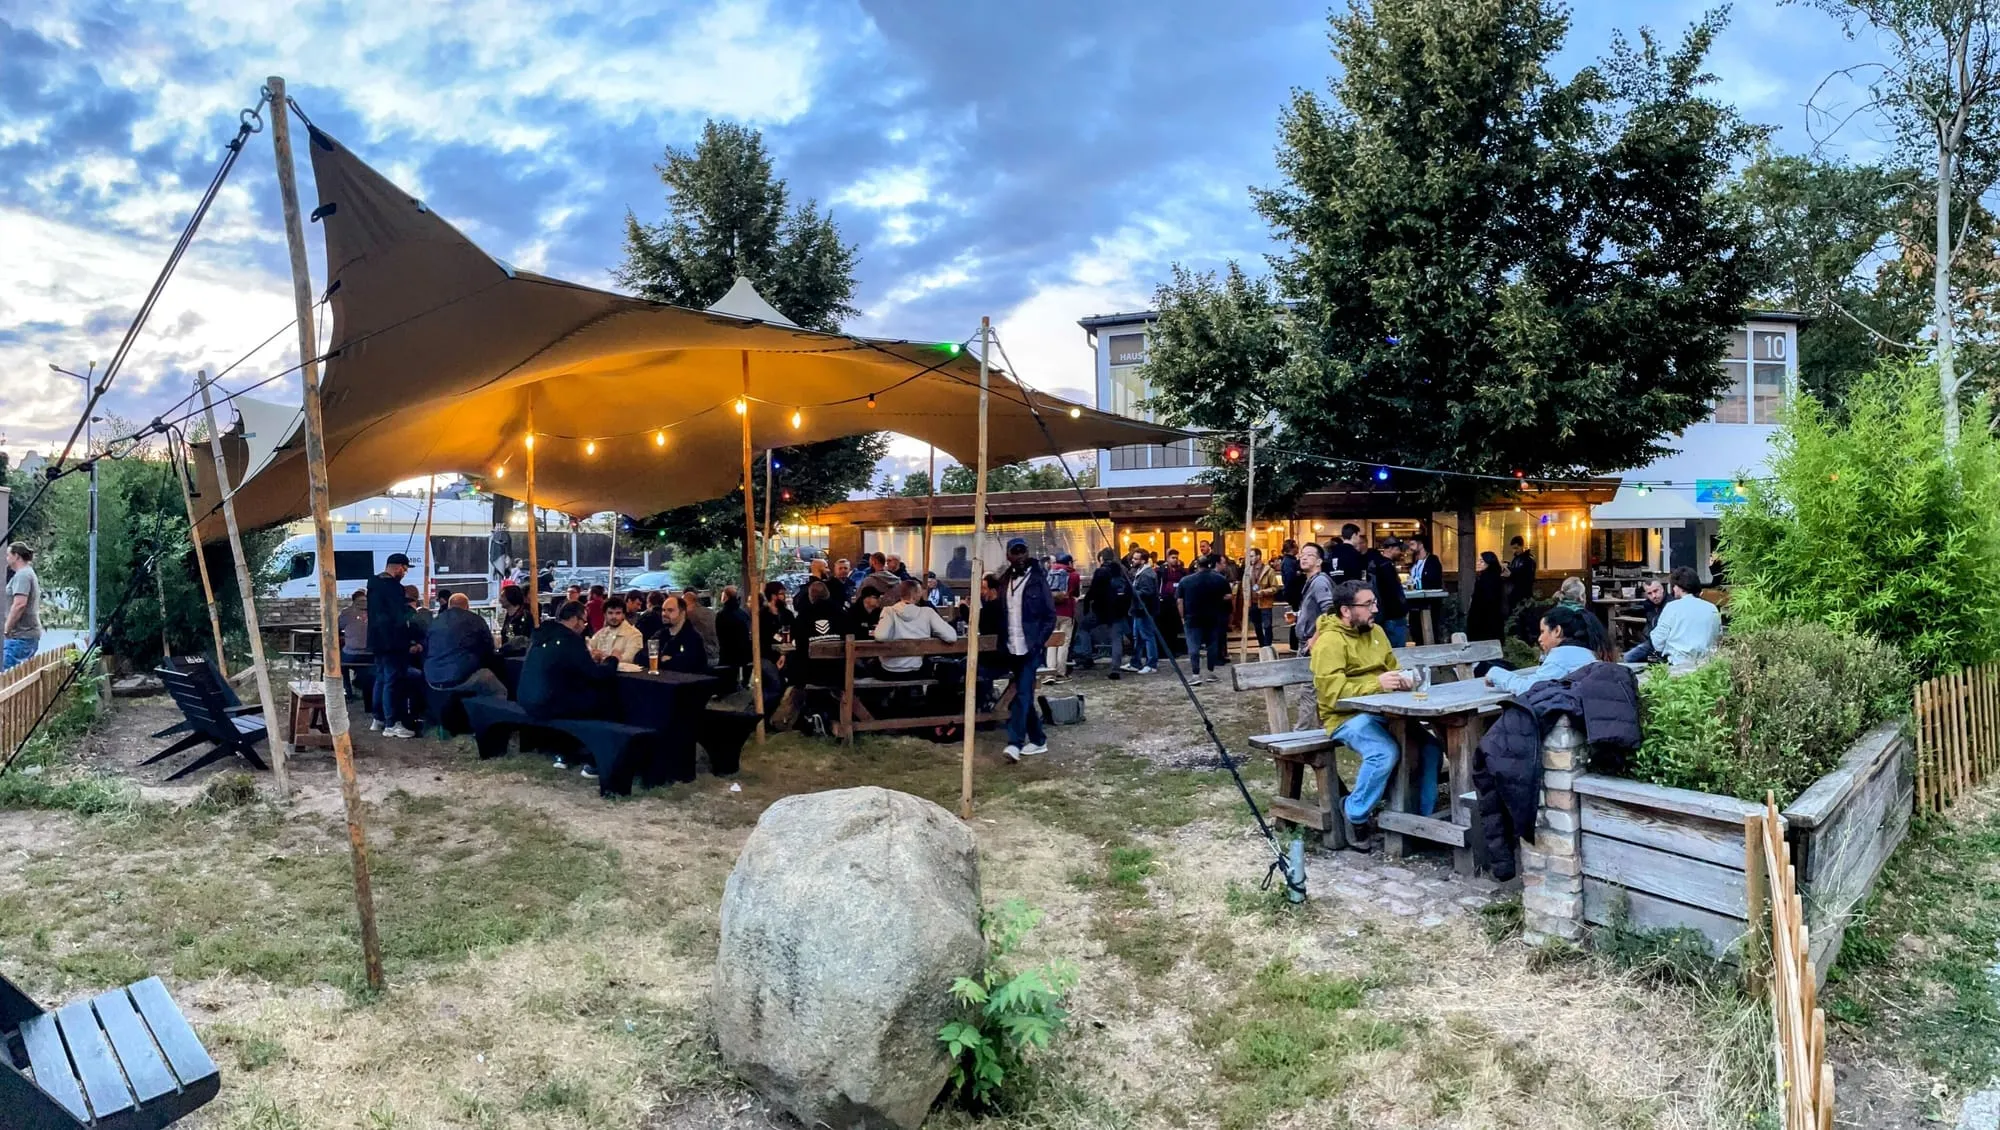
Social Event, Sponsored by Last9
The day concluded with a social event at NAUMANNS Biergarten, sponsored by Last9, offering a great chance to unwind and network.
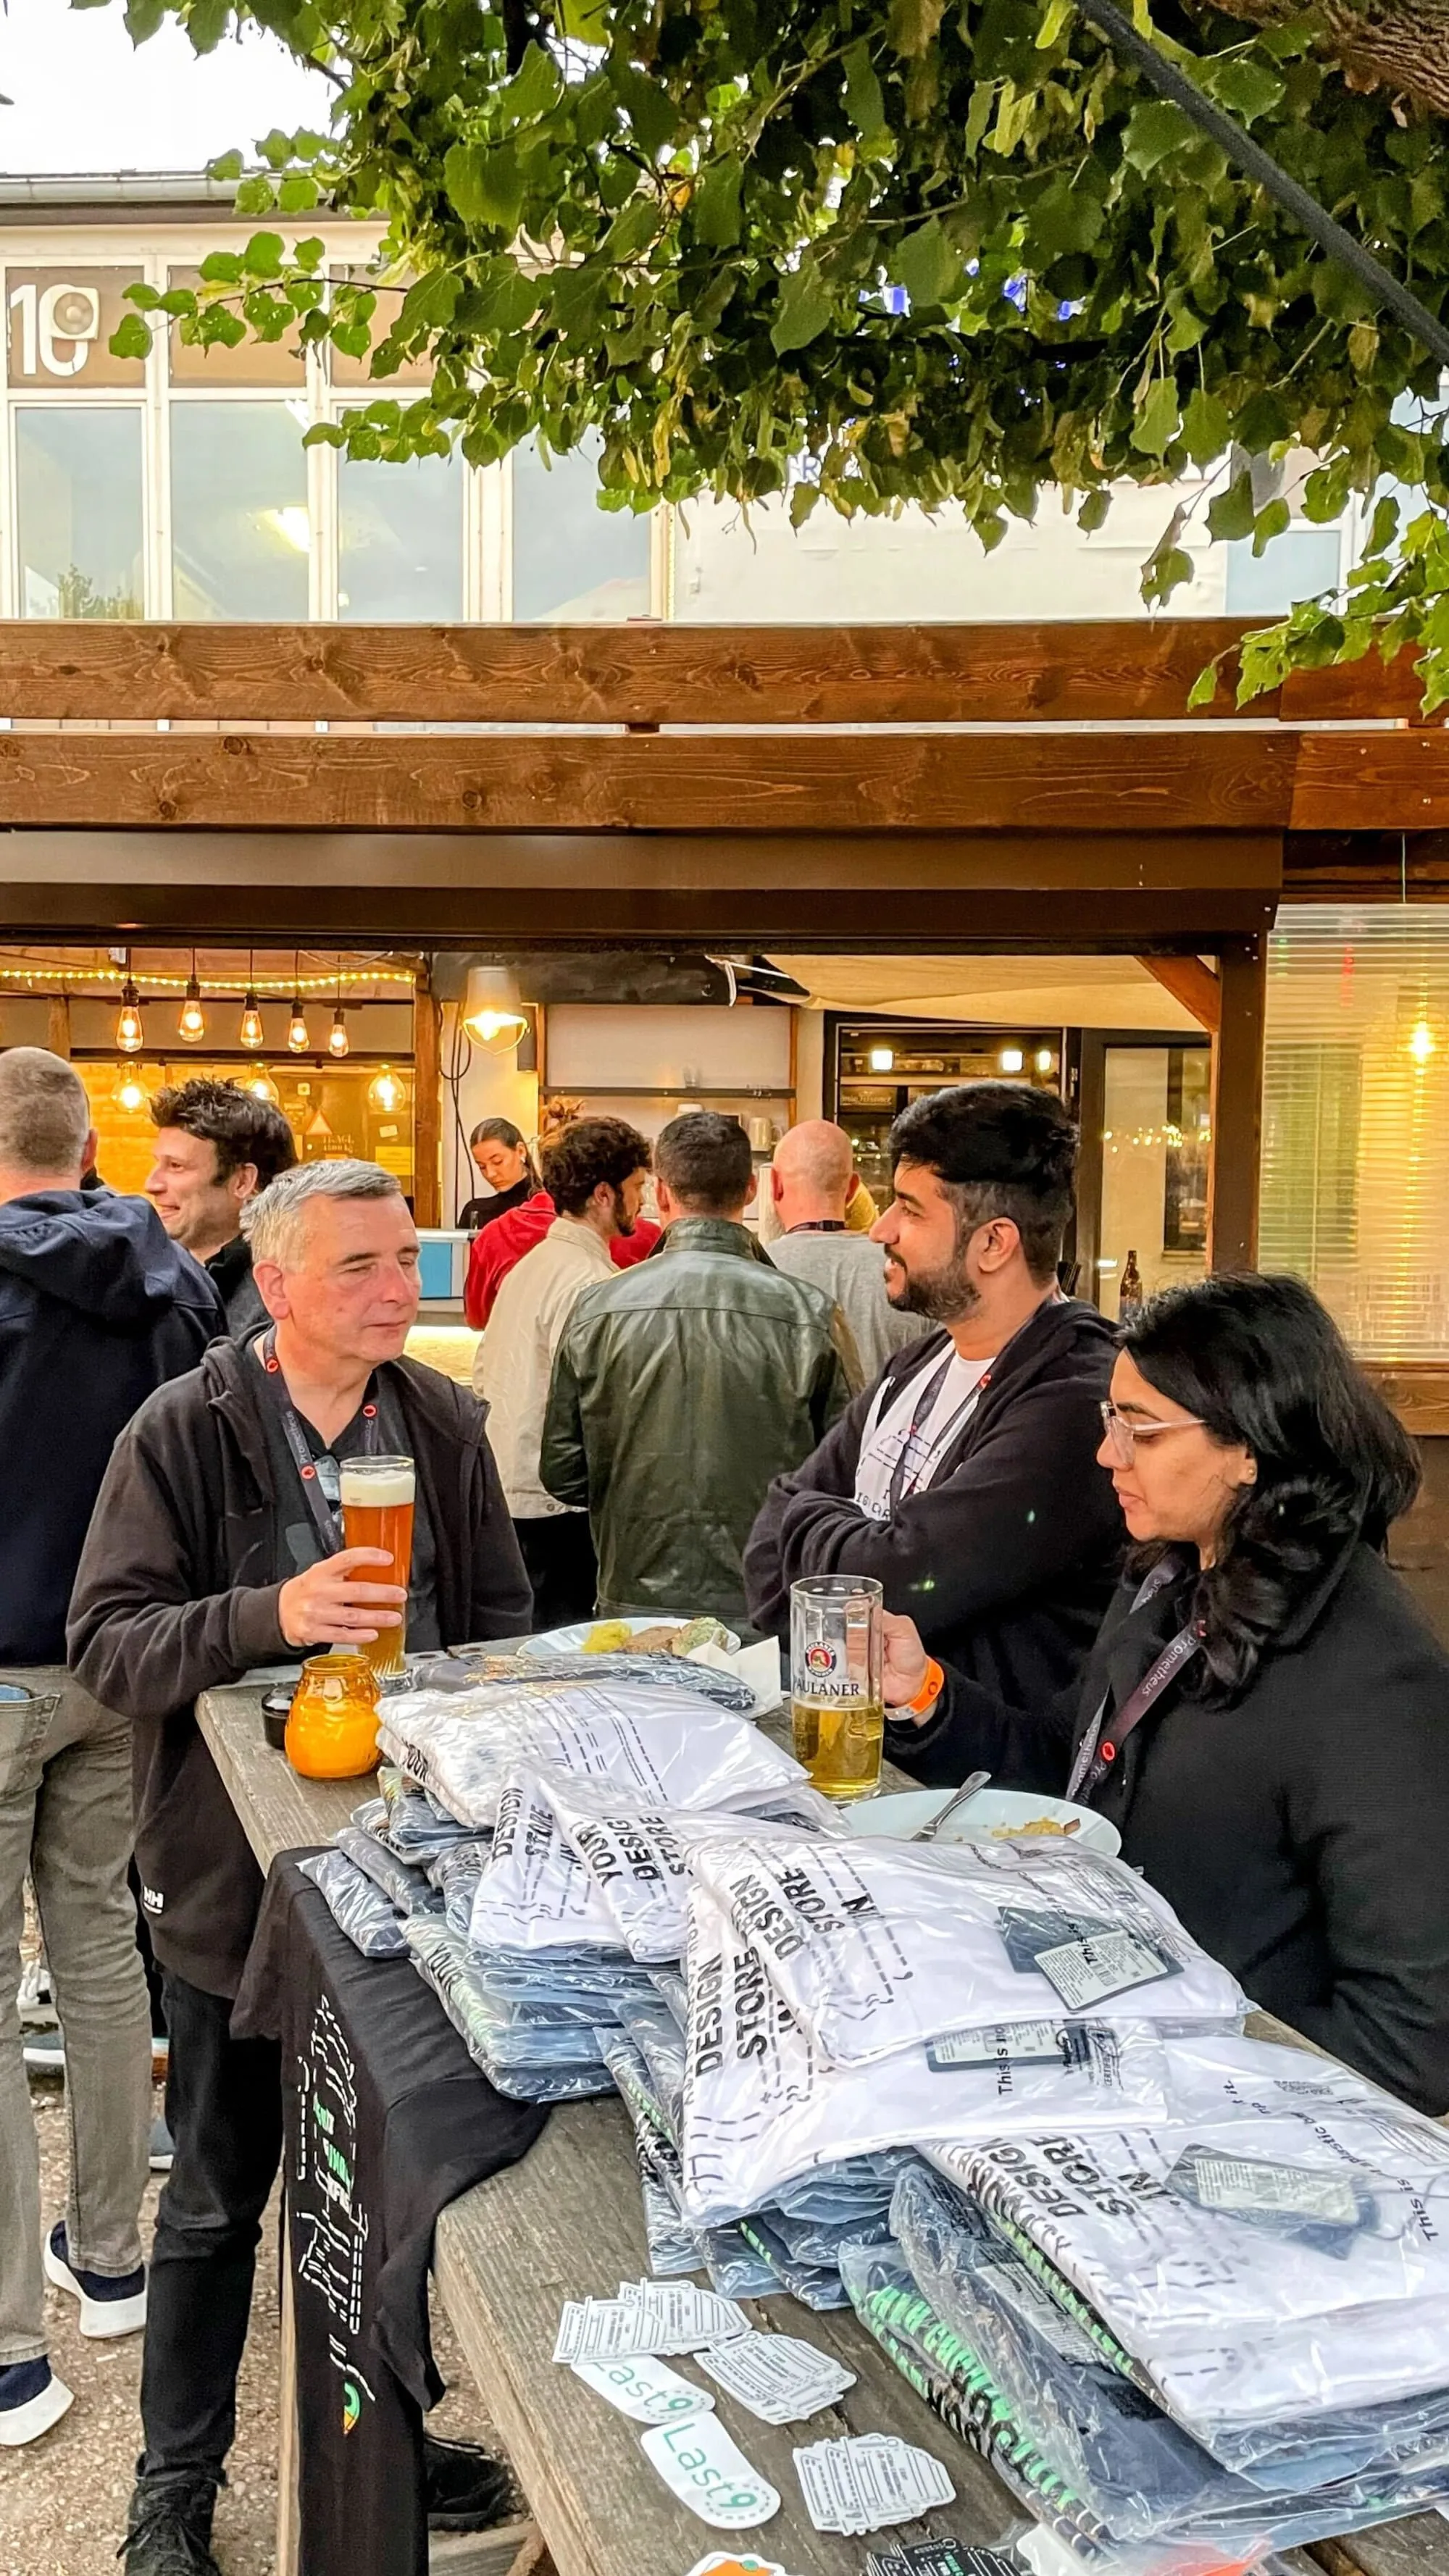
Our team’s got some awesome merch with them, so don’t miss out—track us down and grab yours! 😎

I am already looking forward to Day 2 of PromCon EU 2024.

